
Abstract
Electrochemical impedance spectroscopy of Ni and Ni–ZrO2 composite coatings was studied. Investigation of corroded surfaces showed that the cluster boundaries in pure Ni and weak bonds between Ni matrix and ZrO2 particles in Ni–ZrO2 composite coating are the appropriate paths for corrosion to proceed. An equivalent circuit diagram based on blocked and partially corroded surface characterisations was proposed, and good agreement was observed between theoretical impedance spectra obtained on the basis of the equivalent circuit and spectra recorded during the measurements. Changes of microstructure and corrosion proceeding paths were recognised as the reasons for the higher corrosion resistance of Ni–ZrO2 with respect to pure Ni.
Introduction
Composite coatings produced by co-electrodeposition method have many applications because of the low cost and simplicity of the production procedure and superior properties such as high wear resistance, high microhardness and high corrosion resistance. In these coatings, a metal matrix such as nickel, chromium and cobalt is reinforced with additional particles such as SiC, Al2O3, ZrO2, etc., which are co-deposited in the matrix during co-electrodeposition procedure.1 – 17
In many cases, the aim of composite coating fabrication is corrosion behaviour modification, and some mechanisms have been proposed to explain why the corrosion resistance is higher for composite coatings compared to pure coatings,18 – 22 but in this case, it is necessary to perform some extensive investigations.
In previous work,23 it has been shown that the amount of ZrO2 deposited in the coating sharply depends on the zirconia concentration of the bath. With increasing ZrO2 concentration in the bath up to 90 g L−1, the approaching probability of the particles to the surface of the sample increases so that more ZrO2 particles codeposit in the coating. If the concentration of ZrO2 in the bath surpasses 90 g L−1, the contact probability between particles in the electrolyte increases, and powder agglomeration occurs, so that the ZrO2 content in the coating decreases, and its distribution becomes non-uniform; hence, the sample electroplated in the bath containing 90 g L−1 zirconia has the maximum ZrO2 content.23 In that work,23 the corrosion behaviour of Ni–ZrO2 composite coating was evaluated using potentiodynamic polarisation method.
Electrochemical impedance spectroscopy (EIS) is a reliable and non-destructive technique to determine the corrosion resistance and its proceeding mechanism. In industrial applications, this method can be used for the online determination of corrosion behaviour if the resulting data can be correctly modelled. In the case of composite coatings, the EIS method has been used in a few works due to complications in the modelling of the data and understanding of the corrosion proceeding mechanisms. On the other hand, the study of corrosion proceeding paths is a helpful way to understand the corrosion mechanism, but few works have been performed on this case for composite coatings. In this work, for the first time, the study of corrosion proceeding paths has been used for modelling the EIS spectra of pure Ni and Ni–ZrO2 composite coatings.
Experimental
Previously fabricated Ni and Ni–ZrO2 composite coatings (using ZrO2 particles with a particle size of <5 μm dispersed in the watts bath in an amount of 90 g L−1)23 have been studied in this work. The surface morphologies of the coatings were examined using a Cam Scan model MV2300 scanning electron microscope (SEM) operated at 30 kV. The EIS measurements were carried out using a Zahner ELEKTRIK IM6e measuring apparatus in a three-electrode electrochemical cell with a platinum counter electrode and a saturated calomel electrode as reference, while the corrosive media were normally aerated 3 wt-% NaCl solution at room temperature. The frequency range of 100 kHz to 10 mHz using an amplitude of 5 mV peak to peak ac signals at the open circuit potential (Ecorr) was selected as the condition of EIS measurements. Before experiments, the working electrode (electroplated sample) was first immersed into the test solution for 2 h to establish a steady state open circuit potential. Using Zview software version 2.0, theoretical models (described by a simple equivalent circuit diagram) for the impedance spectra, which their traces were comparable to the impedance spectra recorded during the EIS measurements, were selected.
To investigate the corrosion proceeding paths, the samples were immersed into the 3 wt-% NaCl solution for 30 days, and then SEM studies were performed.
Results and discussion
Figure 1 shows the surface morphologies of pure Ni (Fig. 1a) and Ni–ZrO2 composite (Fig. 1b) coatings. Zirconia particles are uniformly distributed in the nickel matrix. The honeycomb morphology is clear for pure Ni coating. This structure is due to the columnar growth of Ni clusters. However, in the case of Ni–ZrO2 composite coating, this morphology seems to be inhibited probably due to the higher nucleation sites provided by ZrO2 particles. In previous work,23 it has been shown that these particles stop the columnar growth of Ni clusters and provide new nucleation sites so that the microstructure changes from columnar to granular and the surface morphology changes from honeycomb to a smooth one.
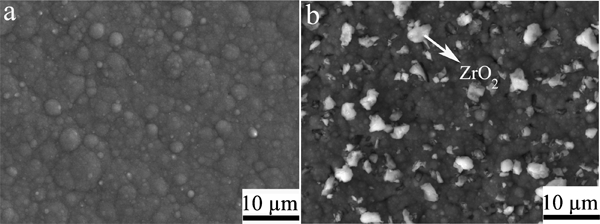
Images (SEM) of a pure Ni and b Ni–ZrO2 composite coating morphologies
Nyquist plots for (a) pure Ni and (b) Ni–ZrO2 composite coatings are shown in Fig. 2. The corrosion resistance of Ni–ZrO2 composite coating is higher than that of pure Ni. In some previous works, Randles simple circuit has been used for modelling the EIS spectra of Ni in Cl− containing media, but the resulting data from this circuit have no good agreement with the experimental data because uniform corrosion does not happen in this case. To select a comparable theoretical model with experimental data, consideration of the corrosion mechanism of Ni coating in Cl− containing media is necessary. Nickel coatings have high corrosion resistance in many environments (except oxidising acids) and at high temperatures below 875°C. This resistance is due to the formation of a layer of oxide (passive layer) on the surface of the coating. However, in a medium containing chloride ions, these ions dissolve the protecting oxide layer in some places, and local corrosion cells arise on the nickel surface. In Fig. 3, the corroded surface morphologies of a pure Ni and b Ni–ZrO2 composite coatings are shown (30 days immersed into the 3 wt-% NaCl solution). In the case of pure Ni coating (Fig. 3a), the roughness of the surface has been increased, and more cluster boundaries have appeared (compare with Fig. 1a) showing that the cluster boundaries are the appropriate paths for corrosion proceeding so that dissolution of the passive layer mainly occurs at cluster boundaries that are weak bonds between Ni clusters. According to Fig. 3b, the matrix/co-deposited particle interfaces have been corroded and disappeared (demonstrated with arrows) so that weak bonds between Ni matrix and ZrO2 particles are the appropriate sites for the dissolution of passive layer and easy corrosion paths for Ni–ZrO2 composite coating. Both coatings (pure Ni and Ni–ZrO2) have blocked surfaces with localised corrosion.
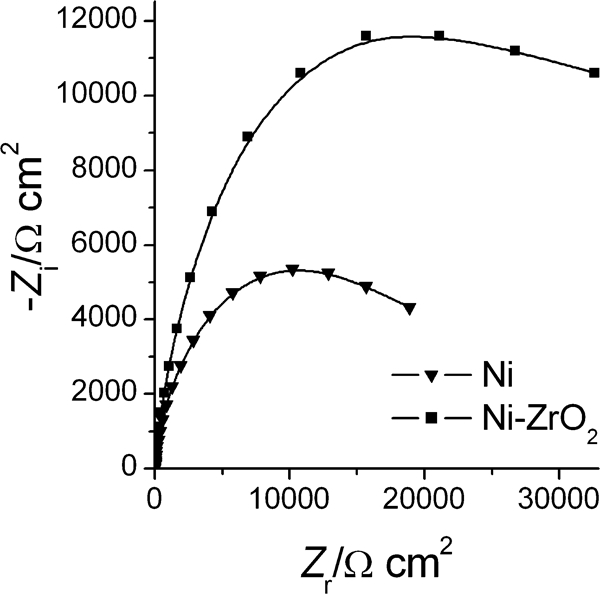
Nyquist diagrams of impedance spectrum for pure Ni and Ni–ZrO2 composite coatings
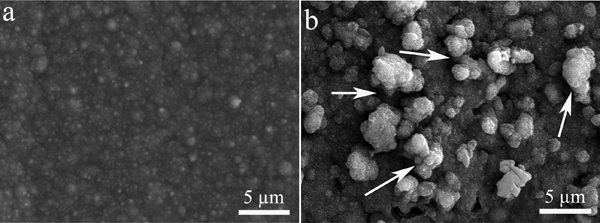
Images (SEM) of a pure Ni and b Ni–ZrO2 composite coating morphologies after immersing into 3 wt-% NaCl solution for 30 days
In Fig. 4a, a blocked surface with localised corrosion is shown. In any uniform electrode, the total potential is the sum of electrode surface potential and IR drop of the electrolyte between working electrode and reference electrode. The total current is the sum of Faradic current and charging current of the surface double layer. If mass transport does not play a role in the electrochemical reaction, then Faradic current will depend on the charge transfer resistance. Here, there are two surfaces, and each of them has a surface double layer. At blocked surface, the Faradic current is too low and not important, but the surface double layer is the determinant factor of the total current. This double layer has been shown by a capacitor Cd. At the corroded surface, both the surface double layer (Cdl) and the charge transfer resistance (Rct) are the determinant factors that have been depicted. Furthermore, at the corroded surface, the surrounding electrolyte in the hole has a resistance that is demonstrated with a resistor (Rl). The IR drop of the electrolyte between working electrode and reference electrode is shown by a resistor (Re) too.24 Because of the roughness and non-uniformity of the surface, the ideal capacitor cannot be used to model the surface double layer, and in such cases, the constant phase element (CPE) can be used instead. The CPE can be modelled by equation (1)

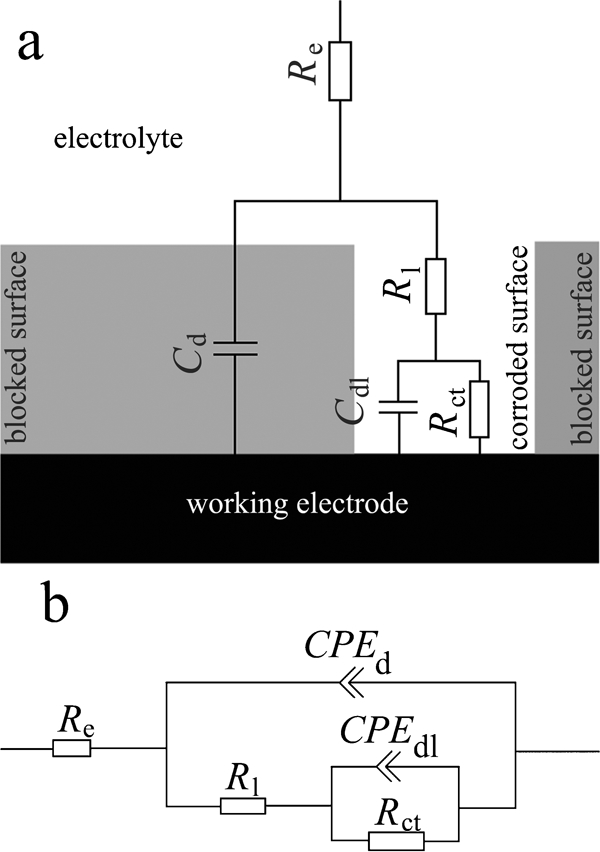
a schematic of corroded Ni surface in Cl− containing media24 and b equivalent circuit diagram for impedance spectra
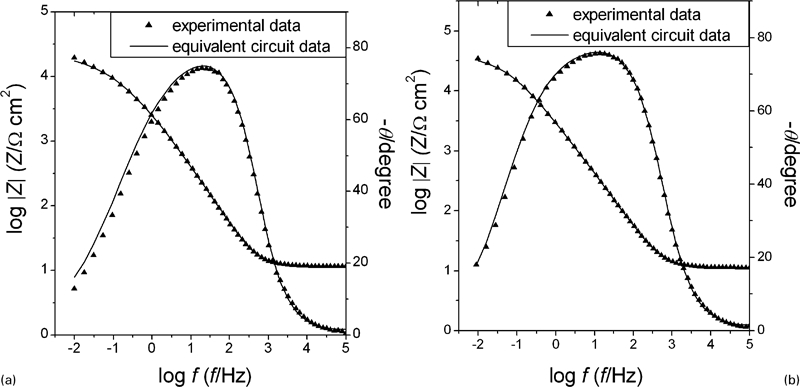
Comparison of Bode diagrams obtained from experimental impedance spectra and theoretical impedance spectra based on equivalent circuit for a pure Ni and b Ni–ZrO2 composite coatings
Equivalent circuit parameters determined by modelling impedance spectra of pure Ni and Ni–ZrO2 composite coatings
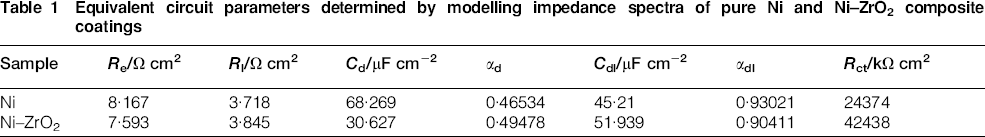
The charge transfer resistance (Rct) of Ni–ZrO2 composite coating is higher than that of pure Ni. Rct is the most important factor to determine the corrosion resistance. In the previous work,23 it has been shown that co-deposition of ZrO2 particles changes the microstructure of the Ni matrix. It was proposed that ZrO2 particles provide new nucleation sites for Ni clusters and stop their growth and change the microstructure from columnar to granular so that the corrosion resistance of Ni–ZrO2 becomes higher than that of pure Ni.23 Investigation of corrosion proceeding paths (immersing of the samples for 30 days into 3 wt-% NaCl solution) in this work illustrates that the corrosion proceeding paths changes from grain boundaries for pure Ni coating to matrix/particle interface for Ni–ZrO2 composite coating. In Fig. 6, the schematics of the microstructures are demonstrated. The easy corrosion proceeding paths in pure Ni coating are the grain boundaries (see Fig. 3a) that are long and straight from the surface of the coating to the substrate. Therefore, corrosion proceeding will not stop after breaking of the passive layer at the grain boundaries. In the case of Ni–ZrO2 composite coating, the grain boundaries are not long and straight so that they are not appropriate paths for corrosion to proceed, and corrosion proceeding paths change from grain boundaries to Ni matrix and ZrO2 particles interfaces (see Fig. 3b). Since these paths are not long and they do not reach the substrate, corrosion proceeding stops or becomes slower after a period of time. This investigation showed that the changes of microstructure and corrosion proceeding paths result in higher corrosion resistance of Ni–ZrO2 composite coating with respect to pure Ni.
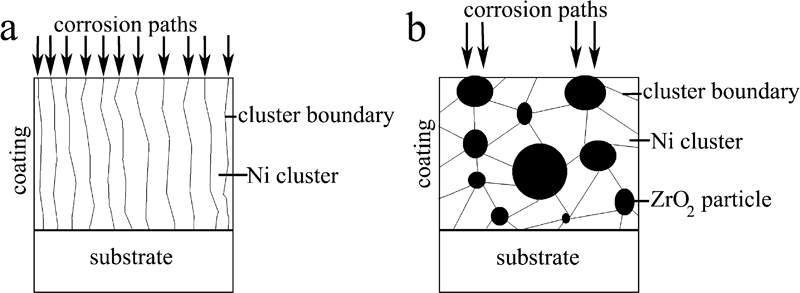
Schematic microstructures of a pure Ni and b Ni–ZrO2 composite coatings
Conclusion
The study of the corrosion proceeding path can be used to model the EIS spectra of composite coatings.
Localised corrosion occurs on the surface of pure Ni and Ni–ZrO2 composite coatings in Cl− containing media due to localised dissolution and breaking of the passive layer.
Investigation of corroded surfaces showed that the appropriate sites for breaking of the passive layer in pure Ni coating are the Ni cluster boundaries, and these sites for Ni–ZrO2 composite coating are the weak bonds between Ni matrix and ZrO2 particles.
An equivalent circuit was proposed to model the EIS spectra of the coatings recorded in 3 wt-% NaCl solution on the basis of their corrosion mechanism (blocked surface with localised corrosion). This circuit has two CPEs: one for blocked parts of the surface and the other for corroded parts. The theoretical impedance spectra obtained on the basis of this equivalent circuit are in good agreement with the spectra recorded during the measurements.
Changes of Ni microstructure and corrosion proceeding paths are recognised as the reasons for the higher corrosion resistance of Ni–ZrO2 compared to that of pure Ni.