
Abstract
Plasma sprayed coatings of yttrium oxide, exhibiting good adhesion and thermal shock resistance, were developed on various substrates using thermal spray grade yttrium oxide powder developed in our laboratory. Numerical simulation of particle behaviour in the thermal plasma jet was combined with experimental method to develop the coatings. Phase structure and microstructural characterisation of the deposits were evaluated by X-ray diffraction, Raman spectroscopy and scanning electron microscopy. Deposition efficiencies and adhesion strength of the coatings deposited at different power levels could be well explained with the predictions provided by the model. The process was optimised using deposition efficiency as the response parameter.
Notation
Biot number
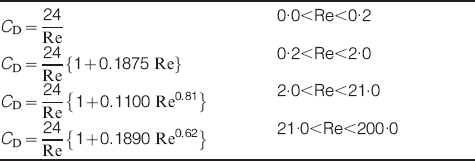
drag coefficient
specific heat of the gas
new diameter of the particle after dissociation correction
diameter of the particle
heat transfer coefficient
thermal conductivity of the gas
thermal conductivity of particle

averaged thermal conductivity of plasma gas over a given temperature range
dissociation energy
latent heat of fusion
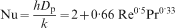
Nusselt number
Prandtl number
Reynolds number
temperature of the particle
temperature of the gas
velocity of the gas
velocity of the particle
time
liquid fraction
viscosity of the gas
density of the gas
density of the particle
Introduction
Yttrium oxide has excellent thermal stability up to its melting temperature and also possesses superior resistance to aggressive chemical attack by molten metals, salts, slag and glass at high temperatures. Yttrium oxide coatings have been reported to offer resistance to corrosion against many molten metals, including uranium.1 – 6 Yttrium oxide has been proposed as a promising candidate material for collector electrodes used in the laser enrichment system of uranium-235.2 Hollis et al.4 have used plasma sprayed yttrium oxide coatings to prevent corrosion by highly reactive molten metals like uranium, titanium, chromium and aluminium. The authors found that yttrium oxide coating offered sufficient resistance to corrosion attack by molten aluminium. Hollis and Bartram5 have developed a process for spray forming yttrium oxide crucibles for molten metal processing. The authors could produce crack free crucibles by controlling the stresses by directed cooling and spray trajectory selection.
Padmanabhan et al.6 reported that yttrium oxide is chemically stable against attack by uranium up to 3000 K using thermodynamic analysis based on the free energy minimisation principle. The authors also studied the interaction between yttrium oxide and molten uranium using differential thermal and thermogravimetric analysis and found that there was no reaction between the molten metal and the oxide.
Plasma spray deposition of yttrium oxide has been carried out by Gourlaouen et al.7, 8 These authors reported the formation of metastable monoclinic phase of Y2O3 in minor amount along with the stable cubic phase. The presence of the metastable phase was found to result in poor mechanical stability of the coatings. The authors found that the addition of zirconia in small amounts (∼3 mol.-%) inhibited metastable phase formation during plasma spraying.8
However, systematic investigation relating simulation studies with experimental studies on yttrium oxide is lacking. Moreover, the deposition characteristics and their dependence on process parameters are specific to the plasma device used for deposition. Therefore, a developmental study on the plasma spray deposition of yttrium oxide was undertaken. The present paper reports simulation studies on the thermal behaviour of yttrium oxide particles injected in the thermal plasma jet and experimental studies on coating development. Particle temperature and velocity at various operating parameters obtained from simulation studies guided in the interpretation of experimental results. Precursor powder for plasma spray applications is quite expensive and contributes to a substantial fraction of the coating production cost. Therefore, deposition efficiency was used as the response parameter for process optimisation, which was carried out by maximising deposition efficiency.
Simulation studies
Plasma–particle interaction
The velocity and thermal history of yttrium oxide particles were obtained by modelling the particle behaviour in the plasma jet. In order to predict the particle behaviour in the plasma jet, the distribution of plasma jet velocity and the temperature are necessary. A two-dimensional axis symmetric plasma jet model was developed to simulate the plasma jet velocity and temperature for different gas flowrates and input powers. Details of this model can be obtained elsewhere.9 Simulations of plasma jet were carried out using commercial code Fluent. The temperature and the velocity distribution for the plasma jet obtained from this model were used to analyse the heat transfer and momentum transfer from the plasma to the particle. The main objective behind the modelling studies was to get an idea of the thermal history and particle velocity, which could be used in selecting the experimental parameters.
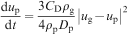
The ‘in-flight’ behaviour of yttrium oxide particles in the plasma jet is governed by the Lagrangian equation of motion that takes into account the momentum transfer between plasma jet and particles and the heat balance equation for heat transfer between the plasma jet and the particles. The velocity and trajectory of the spherical particle in the plasma jet10 can be found out by solving equation (1)
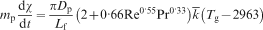
The temperature of the spherical particle until it reaches the melting point of 2963 K can be obtained by solving the following equation
The initial boundary condition is Tp = 300 K. Since the particles are injected in a direction perpendicular to the plasma flow and then turn at right angle at the axis of the flow before the nozzle, the initial boundary condition up = 0 is the same for all particles. The powder is injected inside the nozzle, 2 mm before the nozzle exit.
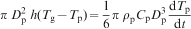
At the instant the Y2O3 particle reaches the melting temperature of 2963 K, partial melting starts, and hence, the temperature is kept constant at 2963 K for subsequent time steps, and the calculated heat flux is used to determine the liquid fraction χ of the particle using the equation given below
 is the averaged thermal conductivity of the gas over a given temperature range. When complete melting is achieved (χ = 1), then equation (2) is used for predicting the further increase in temperature.
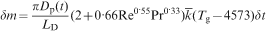
If the Y2O3 particle reaches the dissociation temperature 4573 K, Y2O3 dissociates into Y and O atoms, and then the mass of yttrium oxide dissociated can be computed from the following equation
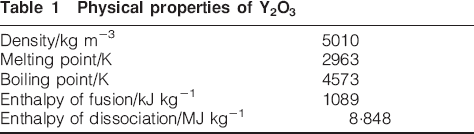
Physical properties of Y2O3
Equation (2) assumes that the particle temperature is homogeneous, and there is no thermal gradient across the particle. This assumption is justified because the estimated Biot number is <0·1 for particles of different sizes used in this work. The Biot number has been estimated from the standard expression

Experimental
Plasma spray deposition
Plasma spray deposition was carried out using a 40 kW atmospheric plasma spray system developed in our laboratory. The torch consists of a water cooled thoriated tungsten rod (10 mm diameter) with a conical tip and water cooled copper anode nozzle (7 mm diameter). The electrodes are isolated by a Teflon insulator. A mixture of argon and nitrogen was used as the plasma gas, which was injected through a side inlet provided in the insulator. Input power to the plasma torch was varied from 16 to 30 kW by controlling the gas flow and arc current. Nitrogen was used as the secondary plasma gas. The primary gas flow was varied from 20 to 30 SLPM. Trial experiments had shown that the nozzle erosion rate was very high for primary (Ar) gas flowrate of 20 SLPM, and therefore, experiments were carried out only at 25 and 30 SLPM of primary gas flowrate. Similarly, the carrier gas flowrate was kept constant at 12 SLPM, and the torch to substrate standoff distance was kept constant at 100 mm based on a large number of trial experiments and operational experience.
Plasma spray grade yttrium oxide powder, synthesised in our laboratory, was used as the feedstock material for plasma spray deposition. Commercially available 99·9% chemically pure yttrium oxide powder was compacted at ∼207 MPa and sintered at 1600°C for 4 h. The sintered mass was crushed into smaller chunks and milled, and the −200 mesh size (−74 μm) powder fraction was used for plasma spray deposition. Details of the process are described by Padmanabhan et al.6 The optical micrograph of the powder is given in Fig. 1. The particle size distribution of the feedstock powder, determined by laser scattering method, is shown in Fig. 2. It is seen from the figure that ∼50% of the particles lie between 20 and 40 μm.
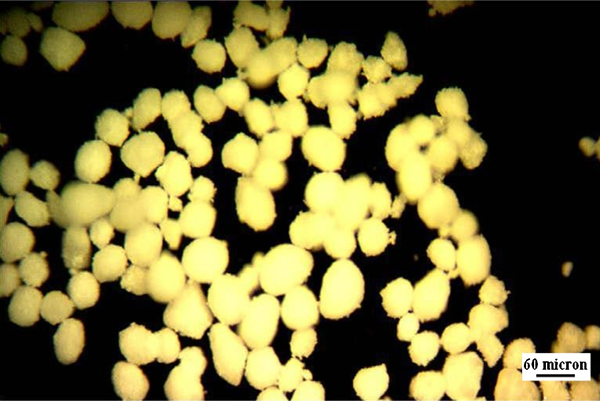
Optical micrograph of yttrium oxide precursor powder
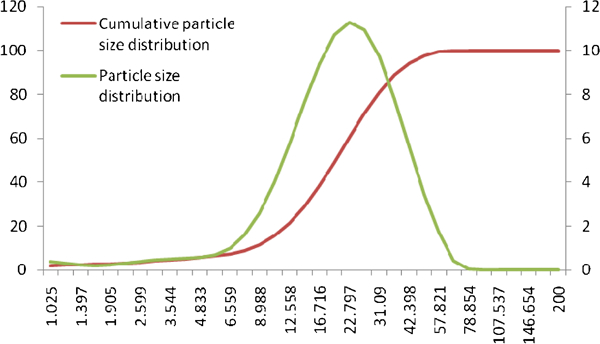
Particle size distribution of yttrium oxide precursor powder
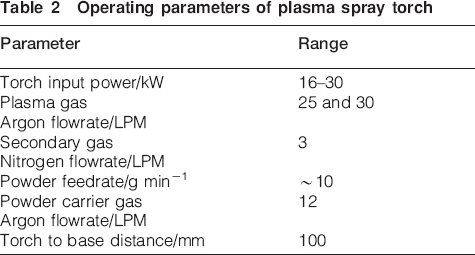
Spray deposition was carried out on graphite and stainless steel substrates. Stainless steel coupons of rectangular geometry (25×20×2 mm) and circular specimens of 15 mm diameter and 2 mm thickness were used. The graphite substrates used were of rectangular geometry (25×20×10 mm). The substrates were prepared by grit blasting before deposition. Grit blasting was carried out using silica grits of size 300–800 μm and subsequently cleaned using acetone in an ultrasonic bath and dried. Yttrium oxide powder was stored in a powder feeder and injected into the plasma jet by means of a carrier gas (Ar) through a side port at the exit of the plasma torch nozzle. The powder was injected into the plasma through an injection port, 2·5 mm in diameter provided on the anode nozzle wall and 3 mm before the nozzle exit. Plasma deposition on graphite substrates was carried out without sand blasting the substrates. The range of operating parameters is given in Table 2. The average coating thickness was ∼200±10 μm. The coating thickness on tensile adhesion test specimens was ∼300±10 μm.
Operating parameters of plasma spray torch
The coatings deposited on stainless steel substrates were used for characterisation studies by X-ray diffraction, Raman spectroscopy, scanning electron microscopy (SEM), thermal shock resistance and tensile adhesion tests. Coatings deposited on graphite substrates were used only for X-ray diffraction and SEM analysis.
Coating characterisation
The coatings were characterised for phase structure by X-ray diffraction. Diffraction patterns were recorded using nickel filtered Cu Kα radiation in theta–two theta geometry. A Carl Zeiss EVO 40 scanning electron microscope was used to acquire the microstructural features of the deposits. Raman spectra of the coatings were recorded on a Bruker RFS 100 system (Ettlingen, Germany) using the 1064 nm line emitted by a CW diode pumped Nd∶YAG laser as the excitation source.
Coating to substrate adhesion was measured by tensile adhesion strength as detailed in ASTM C-633.14 Cylindrical stainless steel substrates of 25 mm diameter and 25 mm length were used for tensile adhesion test measurements. The flat face of the substrates was sand blasted, and yttrium oxide coating was applied on the face of one of the cylindrical specimens. Commercially available epoxy glue, ‘fevikwik’, curable at room temperature was applied on the face of the other cylindrical substrate and bonded with the coated specimen. The glue was allowed to cure at room temperature for 24 h, and tensile adhesion strength was measured using a universal testing machine. The tensile bond strength of the epoxy was determined by a blank run and was found to be 45 MPa. The adhesion strength value reported for each sample is the average of four measurements.
Thermal shock resistance and stability of the coatings were studied up to 1000°C. The stainless steel coated specimens (rectangular coupons of 25×20×2 mm and circular specimens of 15 mm diameter and 2 mm thickness) were heated to 1000°C in air in a tubular furnace at the rate of 6° min−1. The specimens were held at 1000°C for 1 h and quenched in air by rapidly pulling out the sample. The cycle was repeated until the coating developed visible crack or delaminated. The thermal cycling was not continued after 30 cycles.
Results and discussion
Results of simulation studies
Plasma jet velocity and temperature
Temperature and velocity distribution in the plasma region are obtained from the solution of the fluid dynamic equations. Figure 3 shows the temperature and velocity distribution for a total flowrate of 42 SLPM Ar and 3 SLPM of N2 and torch input power of 30 kW. The thermal power transferred to the plasma jet was found to be 18 kW, as the average electrothermal efficiency of the torch over the range of operating parameters used in this study was found to be ∼60%. The steep temperature and velocity gradient along the axis and across the radius are evident from Fig. 3. The temperature at the exit of the plasma torch nozzle is ∼15 000 K and drastically falls along the axis. The radial temperature gradient is still steeper. The general trend of variation of plasma temperature and velocity with radial and axial distance from nozzle exit is similar to the previously published results.15 – 17 In order to validate the present plasma jet model, the plasma jet temperature and velocity fields were simulated for a given input data presented in the literature,17 and the results are compared with previous measurements17 and simulated results.17, 18 The predicted temperature (Fig. 4a) and velocity (Fig. 4b) along the centreline of the plasma jet issuing out of the torch into air atmosphere using the present model are closer to the measured one than that predicted using previous models.
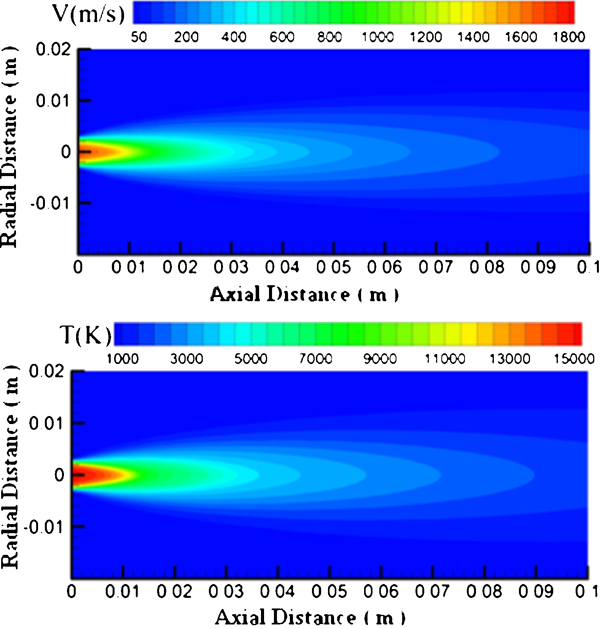
Temperature and velocity distribution obtained for plasma jet modelling for torch input power 30 kW and argon flowrate 42+3 LPM N2
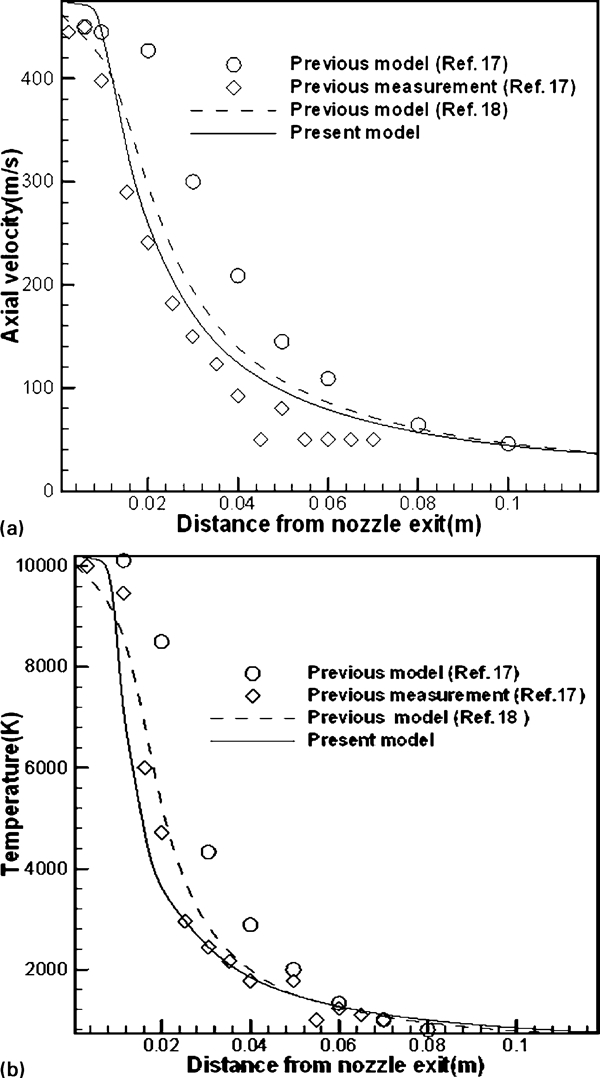
Variation of a plasma jet velocity and b plasma jet temperature along central line of plasma jet: centreline temperature values shown in figure have been computed for operating conditions described in Ref. 17 and not for operating conditions used in this work
Particle melting and evaporation
The temperature and the velocity distribution for the plasma jet obtained for different operating parameters as discussed above were used to analyse the heat transfer and momentum transfer from the plasma to the particle. The calculated temperature and velocity of 30, 40, 60, 80 and 100 μm particles of yttrium oxide for torch input powers of 16, 20, 25 and 30 kW using equations (1) and (2) are shown in Figs. 5 and 6 respectively. The calculations were carried out at total argon flowrate of 37 SLPM (+3 SLPM of N2) and 42 SLPM (+3 SLPM of N2), referred hereafter as lower and higher gas flows respectively. The results showed that the input power, particle size and gas flow significantly affect the particle temperature and velocity.
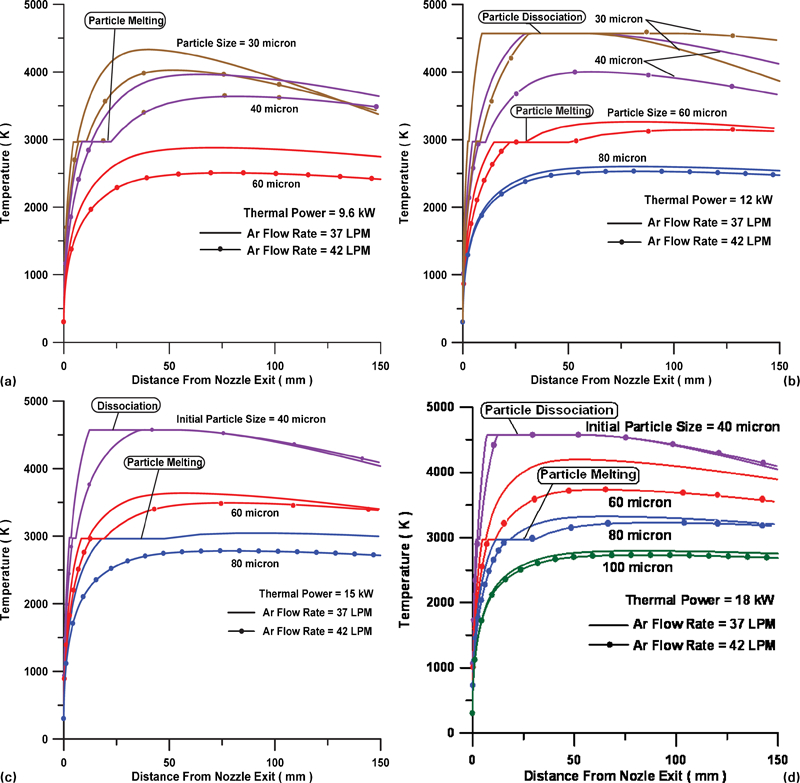
Variation of particle temperature with distance from nozzle exit of plasma spray torch at a 16 kW, b 20 kW and c 25 kW power for 37 and 42 LPM of Ar flowrates and d calculated temperature of different size Y2O3 particles along flow direction for torch thermal power of 18 kW and for Ar flowrates 42 and 37 LPM
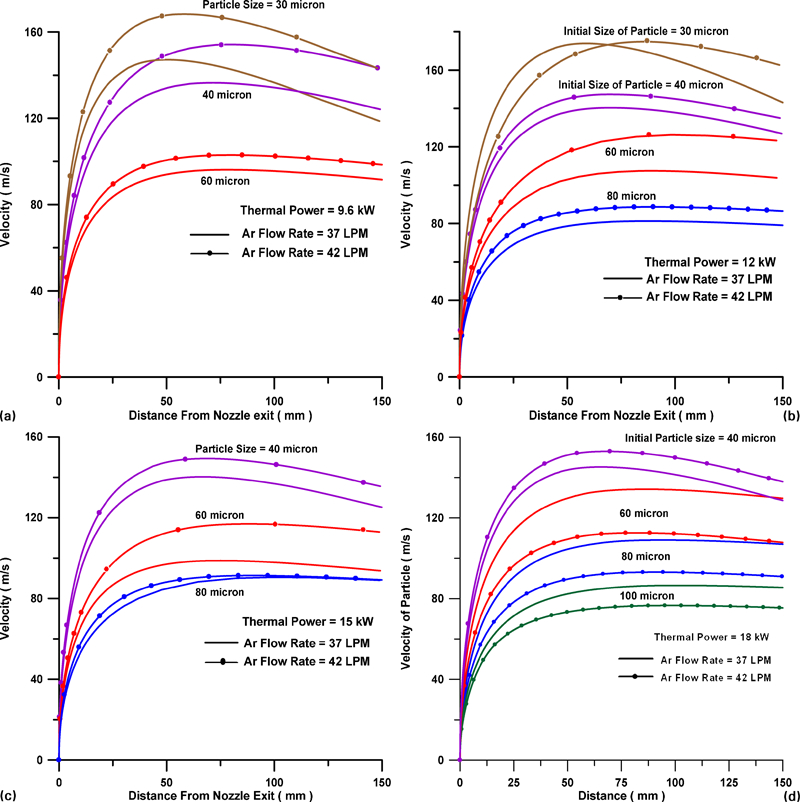
Variation of particle velocity with distance from nozzle exit of plasma spray torch at a 16 kW, b 20 kW, c 25 kW and 30 kW power for 37 and 42 LPM of Ar flowrates
The thermal behaviour of yttrium oxide particles of various sizes at different input powers and gas flowrates is shown in Fig. 5. It is seen from Fig. 5a that at lower and higher gas flowrates, 30 and 40 μm particles reach melting temperature at 16 kW input power. As the particle reaches the melting temperature, the temperature remains constant (as shown by the horizontal line in the figures) until the melting process is complete. However, particles that are 60 μm and above do not reach the melting temperature under the above conditions. At 20 kW power (Fig. 5b), yttrium oxide particles of 30, 40 and 60 μm size reach melting temperature. However, the plasma temperature and enthalpy are not sufficient to melt yttrium oxide particles of 80 μm and above. For an input power of 25 kW and lower gas flowrate, the particle temperature increases and even 80 μm size particles melt (Fig. 5c). However, at 25 kW and higher gas flowrate, yttrium oxide particles 80 μm size and above do not reach the melting temperature. The temperatures of different sized particles at 30 kW (Fig. 5d) are still higher, but the overall trend is similar to that at 25 kW.
The velocity of yttrium oxide particles of different sizes at various power levels is shown in Fig. 6. It is seen from the figures that for a given plasma power and gas flowrate, the momentum transfer from the plasma to the particle is higher for smaller particles. The lower the particle size, the higher their velocities. The particle velocities and thermal histories of particles of various sizes, calculated using the present model, agree fairly well with the results published by Li and Chen,18 Ahmed and Bergman19 and Ramachandran et al.20
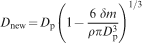
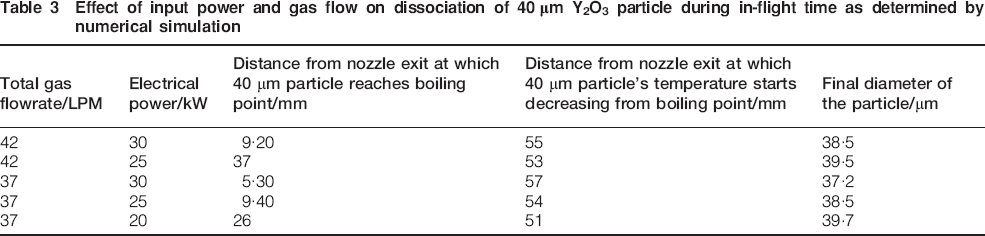
Particle evaporation/dissociation is seen to be significant as the particle size decreases or the power increases. It is seen from Fig. 5b that at 20 kW and 37 SLPM of total argon flow, particles 40 μm size or less reach the dissociation temperature of 4573 K when yttrium oxide particles dissociate into yttrium and oxygen atoms. The effect of input power and gas flow on the dissociation of 40 μm Y2O3 particle is summarised in Table 3. It is seen that 40 μm yttrium oxide particle reaches the dissociation temperature at a distance of 26 mm from nozzle. As the particle temperature reaches 4573 K, the oxide starts dissociating into yttrium and oxygen atoms. The particle temperature is assumed to remain constant during the dissociation (as seen by the horizontal line in Fig. 5c and d), and further heat transfer to the particle from the plasma gas is utilised for the dissociation of Y2O3. This ‘in-flight’ loss of material continues until the particle reaches a distance of 51 mm from the nozzle exit point and then the temperature starts falling. The final diameter attained by the particle is seen to be 39·7 μm. This problem becomes more severe at higher power levels and lower particle sizes. It is observed that at 30 kW input power and total gas flow of 42 SLPM of Ar and 3 SLPM of N2, 40 μm yttrium oxide particle reaches a temperature of 4573 K at a distance of 9·2 mm from the nozzle exit and starts dissociating until it reaches a distance of 55 mm from the nozzle exit point; the temperature then starts falling. Calculations showed that the dissociation/evaporation increased when the gas flowrate was reduced to 37 SLPM of Ar+3 SLPM N2.
Effect of input power and gas flow on dissociation of 40 μm Y2O3 particle during in-flight time as determined by numerical simulation
It is seen that the volume percentage of material loss due to dissociation is quite appreciable, especially at high power and low gas flowrate. This problem becomes all the more severe with smaller particles, as reported by Trapaga et al.,21 who studied theoretically the interaction between plasma and injected alumina particles taking into account temperature gradient within the particle and surface evaporation. They found that vaporisation effects can be significant for small particles (25 μm and below).
Results of simulation studies showed that the input power, particle size and gas flow are the most important parameters that affect the particle temperature and velocity, which in turn affect the spray efficiency and the deposit characteristics. An important observation from simulation studies is that at lower input power, particle melting is not complete, while particle evaporation/dissociation is seen to be significant as the power increases. Material loss due to surface evaporation was found to be significant at power levels >25 kW. In particular, evaporation loss becomes increasingly significant for particle size below 25 μm.
Results of experimental studies
Phase composition, microstructure and thermal shock resistance
The X-ray diffraction pattern of the coated specimen, shown in Fig. 7b, was seen to be similar to that of the starting material (Fig. 7a), consisting of a single homogeneous phase of cubic Y2O3 corresponding to Joint Committee on Powder Diffraction Standards file no. 41-1105. The presence of the metastable monoclinic phase as reported by Gourlaouen et al. 7 7,8 could not be identified. The Raman spectra of the coated samples, depicted in Fig. 8, showed only the cubic phase of yttrium oxide, confirming the above observation.
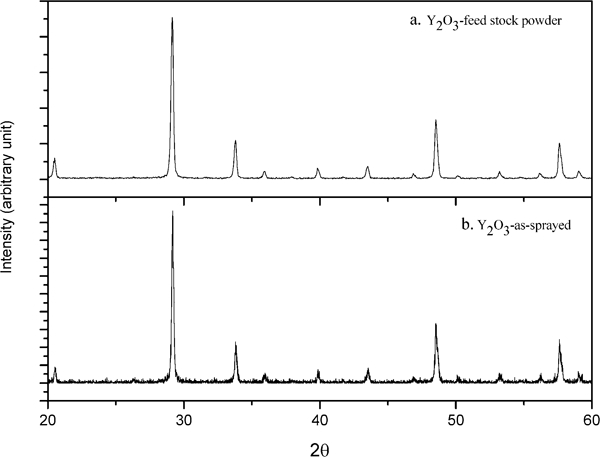
X-ray diffraction patterns of a feedstock powder and b as coated yttrium oxide
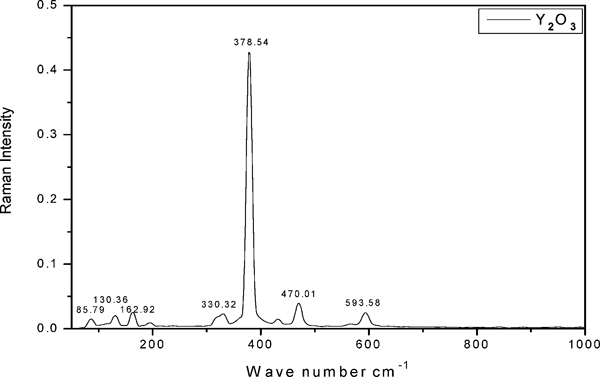
Raman spectra of Y2O3 coating
Figure 9 shows the surface morphologies and the coating/substrate interfaces of coated samples sprayed at 12, 16 and 20 kW. The microstructures are typical of plasma sprayed deposits with molten/partially molten lamellae with scattered porosity. The fraction of unmelted particles and the porosity are seen to be higher in coatings deposited at 12 kW. As the power is increased to 16 and 20 kW, the porosity and the fraction of unmelted particles are reduced. The microstructure also shows molten particles, which did not have sufficient velocity to spread out. On the contrary, the SEM image of plasma deposited yttrium oxide at 25 kW and gas flowrate of 42 SLPM of argon+3 SLPM nitrogen gas (Fig. 10a) shows a morphology of fully molten and flattened lamellae.
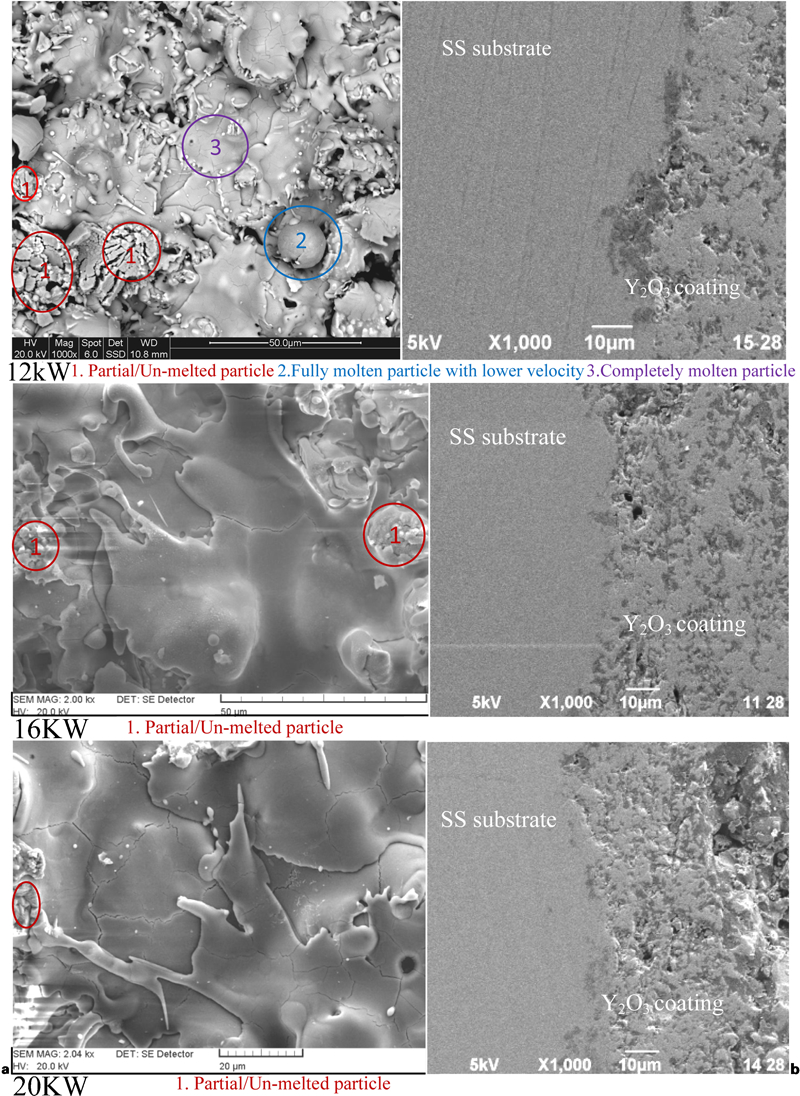
Images (SEM) showing surface a morphology (left) and b substrate/coating interface (right) of yttrium oxide plasma sprayed at different power levels
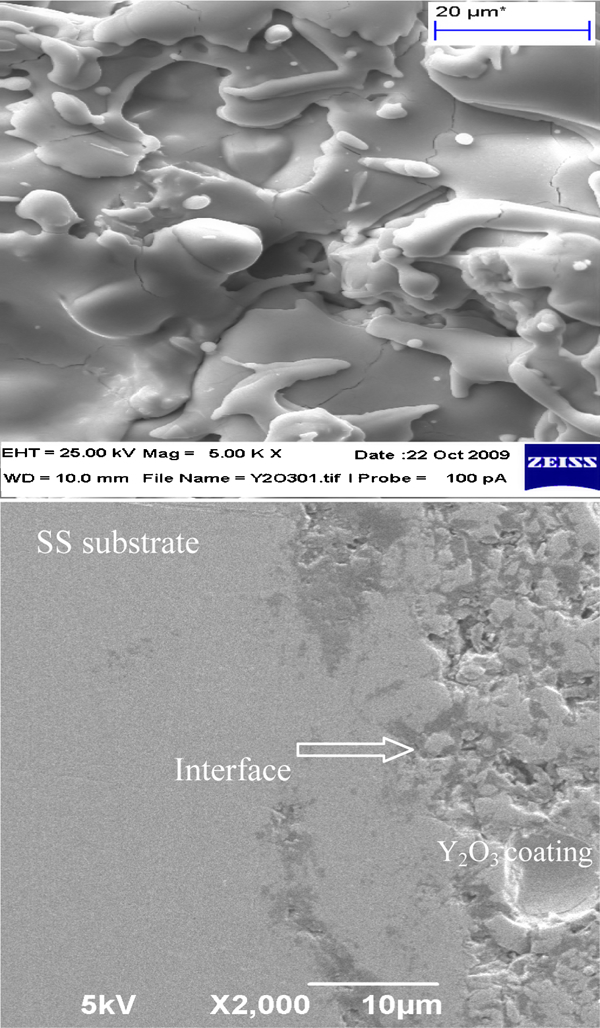
Images (SEM) showing a surface morphology of plasma spray deposit (25 kW, 42 LPM Ar+3 LPM N2) and b interface between stainless steel substrate and yttria coating after 30 thermal cycles
The coating/substrate interface shows no delamination, indicating good adhesion with the substrate surface. However, the increased extent of particle melting leading to better spreading and flow of the molten particles into the irregularities of the substrate surface at higher power is evident in Fig. 9. The coating/substrate interface of the sample deposited at 20 kW clearly indicates better interlocking of the yttria particles with the surface irregularities. The microstructural features of coatings deposited under different power levels are in line with the velocity and thermal history of the particles predicted by the model. Modelling studies indicate that the degree of melting progressively increases with the plasma power.
Results of thermal shock resistance of the coatings deposited on stainless steel substrates gave highly encouraging results. The coating/substrate interface was visually examined after each thermal cycling experiment using a magnifying glass of ×20 magnification. It was observed that the coating/substrate integrity was maintained and that the interface did not develop any visible crack even after 30 thermal cycling experiments. The SEM image of the coating/substrate interface of one of the samples after 30 thermal cycles is shown in Fig. 10b. The interface does not show any delamination, indicating the stability of the coating/substrate system after repeated thermal cycling.
Deposition efficiency
Plasma spray deposition efficiency is an important factor that needs to be maximised from the point of view of process economy.22 Deposition efficiency is the fraction of powder injected into the plasma jet that gets deposited on the substrate. Since in plasma spray process only the fraction of the injected powder that melts deposits and adheres to the surface of the substrate, deposition efficiency is closely linked to the thermal state of the particles in the plasma jet. During plasma spray deposition, molten particles striking the substrate surface get anchored to the surface irregularities, whereas unmolten particles striking the substrate bounce off. The torch to base distance and powder feedrate were kept constant at 100 mm and 10 g min−1 respectively.
Table 4 shows the variation of deposition efficiency of yttrium oxide for various input power levels. The deposition efficiency reported is the average of four readings. The deposition efficiency was found to increase with power. As the power level increases, a larger fraction of the injected powder melts, leading to higher deposition efficiency. The deposition efficiency was found to be low, ∼20%, at 16 kW power and 37 SLPM total argon flowrate and 3 SLPM of N2. The efficiency was found to increase with power, reaching a maximum value at 25 kW and then decreased slightly. The same trend was observed when the total argon flows were 42 and 3 SLPM of N2. The spray efficiency was ∼70% at 25 kW power and a total argon gas flowrate of 42 and 3 SLPM of N2.
Variation of deposition efficiency with spray torch input power
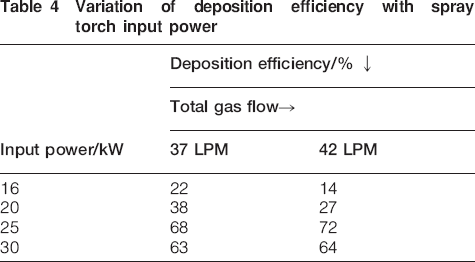
It is evident from the simulation studies (Fig. 5a) that yttrium oxide particles of 40 μm and below reach melting temperature at 16 kW input power. However, larger particles do not reach the melting temperature at 16 kW. Therefore, the spray efficiency is relatively low. When the power is increased to 20 kW (Fig. 5b), the plasma temperature and enthalpy are sufficient to melt even 60 μm particles. For an input power of 25 kW and lower gas flowrate, the particle temperature increases and even 80 μm size particles melt (Fig. 5c). Increasing the input power enables a larger fraction of the powder injected into the plasma to be melted, leading to higher deposition efficiency. Ananthapadmanabhan et al.23 reported similar results on the effect of input power on deposition efficiency during co-spraying of alumina–titania.
However, particle evaporation/dissociation becomes increasingly important as the power increases, and this leads to lowering of deposition efficiency as reflected in the experimental results. Modelling studies predict that particles 40 μm and less dissociate at power level of 20 kW and above; the volume percentage of material loss due to dissociation is quite appreciable, especially at higher power levels. Considering the fact that a large fraction of the precursor powder is below 40 μm, there would be considerable loss of material due to evaporation, and the spray efficiency decreases when spray deposition is carried out at power levels above 25 kW. In order to maximise the deposition efficiency, the process variables should be suitably chosen so as to ensure that all the particles injected into the plasma jet melt and at the same time material loss due to surface evaporation/dissociation is reduced to the minimum.
The modelling studies predict that even at 16 kW power level, a large fraction of the powder particles reach the melting point. The deposition efficiency is, therefore, expected to be reasonably high at 16 kW. However, experimental observation shows very low efficiency. This discrepancy between modelling results and experimental evidence is due to the fact that theoretical modelling gives an overestimate of the particle temperature and velocity. Trapaga et al.21 have compared the theoretically predicted temperature and velocity of alumina particles injected into an Ar–He plasma with the experimentally observed values. It was found that the theoretically predicted value of temperature was 20% higher than the experimentally observed value. In addition, the model assumes all particles of a given diameter to have the same trajectory inside the plasma jet, while in practical conditions, it is possible that some particles do not follow ideal trajectories.
Our results agree with those reported by Kucuk et al.,24 who found that the deposition efficiency of yttria stabilised zirconia was highly influenced by the centreline temperature of the particles. These authors determined the in-flight particle parameters, such as temperature, velocity, number and size, using a commercially available diagnostics system. The effect of arc current and primary gas flowrate on the characteristics of yttria stabilised coatings has also been reported by Prystay et al.25 These authors used an integrated optical monitoring system for monitoring particle temperature and velocity and concluded that the plasma gas flowrate and arc current greatly influenced particle temperature and velocity, which in turn affected the deposit quality.
Coating adhesion
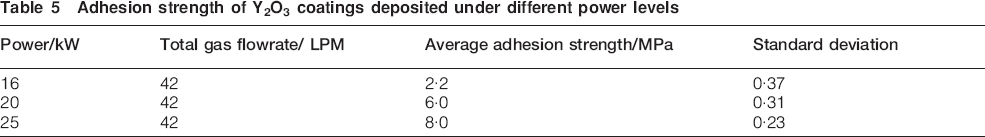
The adhesion strength of the coatings to the substrate was measured by tensile adhesion testing, as detailed in ASTM C-633. It was observed that, in all the experiments, failure occurred at the coating/substrate interface in all cases, indicating coating failure by adhesion mode. The adhesion strength of coatings deposited at 16 kW input power and total gas flow of 42 SLPM argon and 3 SLPM nitrogen was ∼2 MPa. As the plasma power is increased, larger and larger fraction of the injected powder particles melt, the particle velocity is increased and, consequently, the coating adhesion is enhanced. Table 5 shows the adhesion strength of coatings deposited at different power levels. Coatings deposited at 25 kW and total Ar gas flowrate of 42 and 3 SLPM N2 were found to have the maximum adhesion strength (8 MPa).
Adhesion strength of Y2O3 coatings deposited under different power levels
The value of adhesion strength obtained in this study is somewhat lower than that reported for alumina and stabilised zirconia by Hennaut et al.26, 27 The adhesion strength of ceramics is governed by many parameters that include the spraying methods, the material, the relative thermal expansion coefficient of the ceramic and the substrate, the surface conditions of the substrate, etc. This should be kept in mind while comparing the adhesion strength values of different coatings.
However, for a given substrate and material, the adhesion of the coating to the substrate is mainly affected by the particle temperature and velocity. In order to have high adhesion strength, it should be ensured that all particles injected into the plasma jet should be in the molten state at the instant they strike the substrate surface. Unmelted particle inclusions in the coating can impair coating adhesion. Particle velocity at impact is also very important; a higher particle velocity helps to enhance the degree of flattening of the molten droplet and, therefore, increase the adhesion. The adhesion strength of the coating deposited at 16 kW input power and 42 SLPM of Ar+3 SLPM N2 was found to be very low at 2 MPa. The low value of adhesion strength is attributable to the low particle velocity and also unmelted particles in the coating, as confirmed by simulation studies. With the increase in input power, the adhesion strength increases, and the coatings deposited at 25 kW power and 42 SLPM Ar+3 SLPM N2 were found to have adhesion strength of 8 MPa. The increase in adhesion strength is due to the increased plasma temperature, which helps in increasing the fraction of molten particles and also because of increased velocities of the particles. This is also confirmed by microstructures of coatings deposited under different processing conditions, as discussed earlier under the section on ‘Phase composition, microstructure and thermal shock resistance’.
The importance of particle melting for enhancing coating adhesion has been studied by Sadeghi-Fadaki et al.28 The authors observed that the adhesion strength of plasma sprayed coatings of yttria stabilised zirconia could be directly correlated with the extent of particle melting. Similar results were reported by Friis et al.,29 who concluded that the particle velocity and the temperature at impact have a strong influence on the level of flattening and adherence of the particles. This, in turn, is strongly affected by the plasma power and gas flowrate, as corroborated by our studies. Moreover, as these molten particles strike the substrate surface, the high kinetic energy and low viscosity result in large deformations of the particles and lead to better filling of the particles in the surface irregularities of the predeposited layer. The overall effect is stronger bonds between the individual splats and enhanced adhesion to the substrate.
The foregoing discussion underscores the importance of modelling and simulation studies in plasma spray deposition. Simulation studies have helped in better understanding the plasma spray process and also in interpreting the experimental results in a better way. The simulation studies underscored the importance of plasma power, gas flowrate and particle size on the resulting coating properties and provided the basis for process optimisation.
The objective pursued in plasma spraying is to ensure that all the particles injected into the plasma jet have sufficient velocity and remain in the molten state at the time of impact on the substrate. This would lead to deposits without any unmelted inclusion, resulting in highly adherent coatings. However, care should be exercised to avoid particle evaporation, which can lead to lower efficiency. Results of the present study clearly indicate that the plasma spray parameters should be such that the particles are kept in the molten state with minimum surface evaporation/dissociation.
Conclusion
Modelling studies were carried out to get the temperature and velocity profile of yttrium oxide particles in the plasma jet at various operating power levels and gas flowrates. Simulation studies showed that the input power, particle size and gas flow significantly affect the particle temperature and velocity, which in turn affect the spray efficiency and the deposit characteristics. Material loss due to surface evaporation was found to be significant at power levels >25 kW. The modelling studies helped in better understanding of the spray process, interpreting the experimental results and optimising the process. Experimental results on deposition efficiency, adhesion strength and microstructure of coatings could be explained fairly well with the predictions provided by simulation studies. Adherent coatings with very good thermal shock resistance and high deposition efficiency (70%) could be prepared on stainless steel and graphite substrates by carrying out the deposition process at 25 kW.
Footnotes
Acknowledgements
The authors express their gratitude to Dr K. Krishnan, FCD, BARC, Mumbai, for his help in recording the X-ray diffraction patterns.