
Abstract
This paper reports an experimental study of corrosion characteristics of electroless Ni–P–TiO2 nanocomposite coatings. Coating process parameters are optimised for maximum corrosion resistance based on L9 Taguchi orthogonal design with four process parameters, namely, concentration of nickel source solution, concentration of reducing agent, concentration of TiO2 powder and bath temperature. Corrosion behaviour of the electroless Ni–P–TiO2 nanocomposite coatings was evaluated in 3·5 wt-%NaCl aqueous solution using polarisation technique. Scanning electron microscopy and energy dispersive X-ray spectroscopy analysis were used for studying surface morphology and chemical composition of the electroless Ni–P–TiO2 nanocomposite coatings. The results showed that incorporation of TiO2 in coating causes an increase in corrosion resistance and improves surface morphology. Finally, optimum conditions were achieved as follows: concentration of nickel source solution, 50 g L−1; concentration of reducing agent, 10 g L−1; concentration of TiO2 powder, 10 g L−1; and bath temperature, 85°C.
Introduction
Electroless deposition, an autocatalytic reduction of metals and alloys, offers an attractive and alternate method of producing a coating of higher Ni content, and it has been known to form a thin and uniform deposit on substrate when compared with electroplating.1,2 Electroless Ni coatings have gained popularity due to their inherent properties like excellent corrosion, wear and abrasion resistance.3,4 The electroless deposition process is based on a redox reaction in which the reducing agent is oxidised and Ni2+ ions are reduced on the substrate surface.1 – 5 An advance in electroless Ni–P deposition is the codeposition of solid particles into coatings to further improve certain properties.6 – 13 The dispersed second phase particles provide inherent uniformity, harden ability and wear resistance.6 – 9 It is understandable that the type of composite components and the particle size dispersed into the composite matrix determine the mechanical properties of Ni–P composite coatings.11 – 13 The Ni–P composite coatings containing ceramic particles as the reinforcing phase find wide applications, especially as anticorrosion and antiwear materials.8 – 12
Corrosion resistance of an electroless Ni–P coating is a function of its chemical composition and in particular the phosphorous content.11,14 Despite a good number of studies on electroless Ni–P coatings particularly on corrosion resistance properties,3,11,13,15 an extensive review of the literature reveals that no report is available on optimisation of the process parameters of electroless Ni–P–TiO2 coating to have maximum corrosion resistance.
This study deals with the application of the Taguchi method to determine the optimum coating process parameters in order to obtain maximum corrosion resistance. Based on the Taguchi orthogonal, experiments were designed with four design parameters, namely, concentration of nickel source solution, concentration of reducing agent, concentration of TiO2 powder and bath temperature. All of the parameters were selected in three levels as maximum, minimum and middle levels.
Experimental
Coating deposition
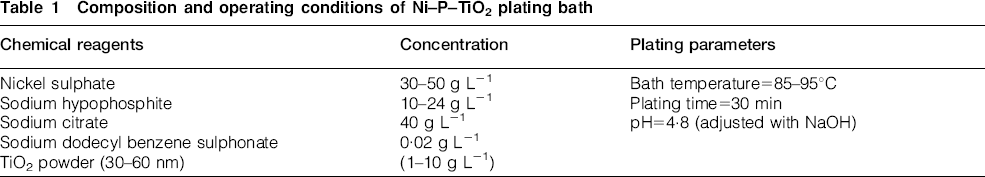
Copper sheets of size 10×10×1 mm were used as the substrate material for the deposition of the electroless Ni–P–TiO2 coating. Before electroless plating, the copper substrates were polished mechanically to mirror finish with 3000 grit SiC paper, degreased in a 30%NaOH solution for 10 min, washed with distilled water and dried in air. All specimens were etched in a 10% sulphuric acid solution for 2 min and then rinsed with deionised water and acetone. The bath composition and operating conditions used for preparing electroless Ni–P–TiO2 coatings were given in Table 1. The TiO2 (Merck, 50 nm) particles were used as the composite particles.
Composition and operating conditions of Ni–P–TiO2 plating bath
All chemicals were of analytical reagent grade (Merck). The surface morphology of the Ni–P–TiO2 coatings was analysed using a Philips XL30 scanning electron microscope. The coating compositions were analysed by an energy dispersive X-ray apparatus attached to the SEM. Each sample was measured at different locations to confirm uniformity.
Electrochemical experiments were carried out using a Princeton Applied Research, EG&G PARSTAT 2263 Advanced Electrochemical system run by PowerSuite software. A standard three electrode cell arrangement was used in all experiments. A platinum sheet of the geometric area of ∼20 cm2 was used as counter electrode, while all potentials were measured with respect to a commercial saturated calomel electrode. After the electrochemical testing system became stable in 3·5%NaCl solution (∼60 min), Tafel polarisation tests were recorded in a potential range of E = corrosion potential (Ecorr)±200 mV with a scan rate of 0·167 mV s−1.
Taguchi design of experiment
Design of orthogonal array and signal to noise analysis
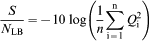
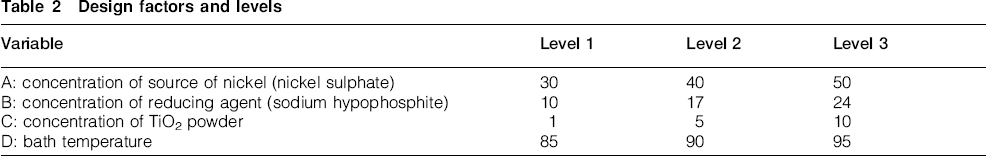
Taguchi technique16,17 is a powerful tool for design of high quality systems based on orthogonal array experiments that provide much reduced variance for the experiments with an optimum setting of process control parameters. This method achieves the integration of design of experiments with the parametric optimisation of the process yielding the desired results.16,17 Four factors (concentration of nickel source solution, concentration of reducing agent, concentration of TiO2 powder and bath temperature) with three levels were selected, as shown in Table 2. The factors and levels were used to design an orthogonal array L9 (34) for experimentation. The nine Taguchi experiments were conducted twice to ensure the reliability of experimental data for a signal to noise (S/N) analysis. The S/N ratio consolidates several repetitions into one value, which reflects the amount of variation present. It is defined as the ratio of the mean (signal) to the standard deviation (noise). The three categories of S/N ratios are used:17 lower is best (LB), higher is best (HB) and nominal is best (NB). In the present study, corrosion current density icorr is treated as a characteristic value. The parameters were optimised with an objective to minimise the icorr. Therefore, the S/N ratio for LB characteristics was selected, which can be calculated as follows
Design factors and levels
Analysis of variance (ANOVA)
Analysis of variance is statistical technique, which can infer some important conclusions based on analysis of the experimental data. The method is very useful for revealing the level of significance of influence of factor(s) or interaction of factors on a particular response.18,19 It separates the total variability of the response into contributions of each of the factors and the error.18 – 20 Analysis of variance table shows the sum of the square (SS), the degree of freedom (D), the variance (V), corrected sum of squares (SS′) and the percentage contribution of each parameter (P).17
Results and discussion
Tafel polarisation studies
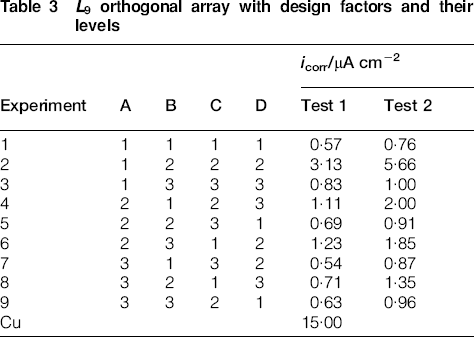
Tafel extrapolation (linear parts of anodic and cathodic branches) of the curves about ±50 mV versus Ecorr was used in PowerSuite software for determination of corrosion current density. The structure of the Taguchi's orthogonal array design and the results of the Tafel polarisation measurements for the different coatings on Cu are given in Table 3, which also includes data for the substrate for the purpose of comparison. All coated samples have a higher corrosion resistance than the Cu substrate.
L9 orthogonal array with design factors and their levels
Determination of optimal levels
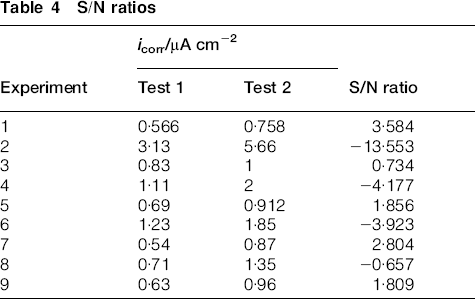
Based on equation (1), two corrosion current density measurements for each experiment were converted into an S/N ratio. Table 4 compares the calculated mean S/N ratios with the corrosion current density data. The mean S/N ratio for each level of the factors A, B, C and D is summarised and called the S/N response table for corrosion current density (Table 5). In addition, the total mean S/N ratio for the nine experiments is also calculated and listed in Table 5. The response table shows the average of the selected characteristic for each level of the factors. The response table includes ranks based on Delta statistics, which compare the relative magnitude of effects. The Delta statistic is the highest average for each factor minus the lowest average for the same. Ranks are assigned based on Delta values; rank 1 is assigned to the highest Delta value, rank 2 to the second highest Delta value, and so on. The corresponding main effect and interaction effect plots between the process parameters are also shown in Figs. 1 and 2 respectively. In the main effect plot, if the line for a particular parameter is near horizontal, then the parameter has no significant effect.16 – 19 It is very much clear from the main effect plot that parameters C (concentration of TiO2 powder) and D (bath temperature) are the most significant parameters, while parameters A (concentration of nickel source solution) and B (concentration of reducing agent) have relatively less significant influence (Fig. 1). If the lines on the interaction plots are non-parallel, interaction occurs, and if the lines cross, strong interaction occurs between parameters.16 – 19 From Fig. 2, it can be seen that there is strong interaction between parameters A and B, while there is moderate interaction between parameters B and D and weak interaction between parameters B and C. Thus, from the present analysis, it is clear that D (bath temperature) and C (concentration of TiO2 powder) are the most influencing parameters for corrosion current density icorr.
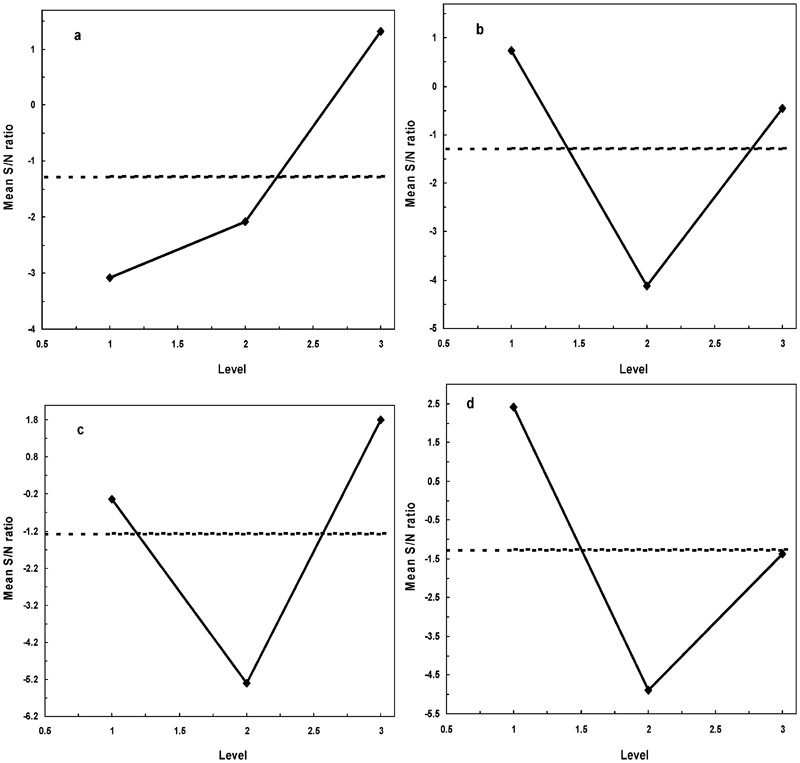
Effect of a concentration of nickel source solution, b concentration of reducing agent, c concentration of TiO2 powder and d bath temperature on mean S/N ratio
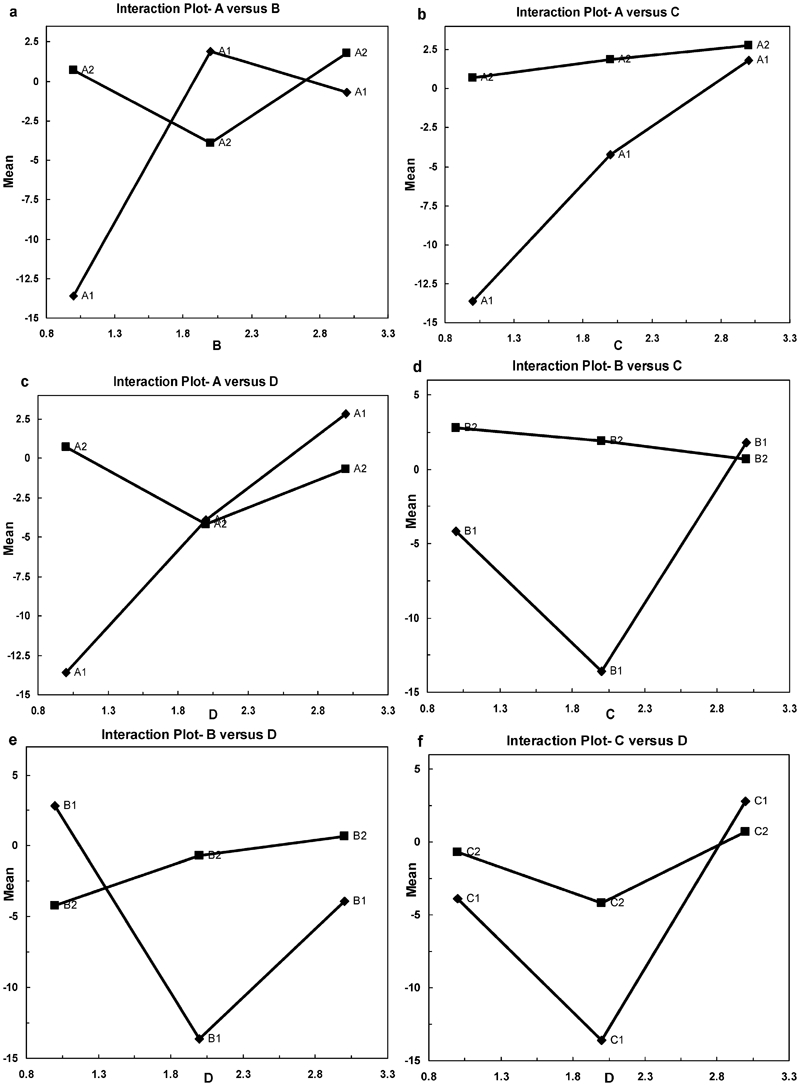
Interaction effect plots for mean corrosion current density
S/N ratios
Response table of mean S/N ratio
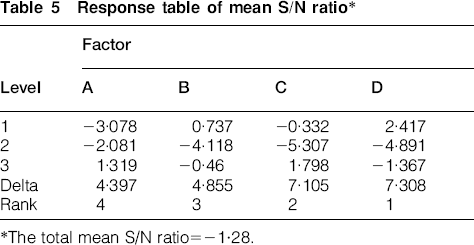
The total mean S/N ratio = −1·28.
The mechanism for the deposition of Ni–P–TiO2 system includes three stages:
the particles are transferred primarily by forced convection
the particles with their adsorbed ionic cloud are adsorbed loosely at the substrate surface
the particles are incorporated irreversibly into the metal matrix by the reduction of some of the adsorbed ions.
Main competitive oxidation–reduction reaction in the acidic hypophosphite plating bath can be expressed as follows21


 and
and
 ) and other adsorbed species (such as organic surfactant) strongly influence the depositing process.22
–
25
) and other adsorbed species (such as organic surfactant) strongly influence the depositing process.22
–
25
The overall reaction of electroless nickel plating in acidic hypophosphite bath can be broadly expressed as follows26

Therefore, the optimal process parameter combination for minimum corrosion current density is obtained as A3B1C3D1 (concentration of nickel source solution = 50 g L−1; concentration of reducing agent = 10 g L−1; concentration of TiO2 powder = 10 g L−1; bath temperature = 85°C).
Factor contributions
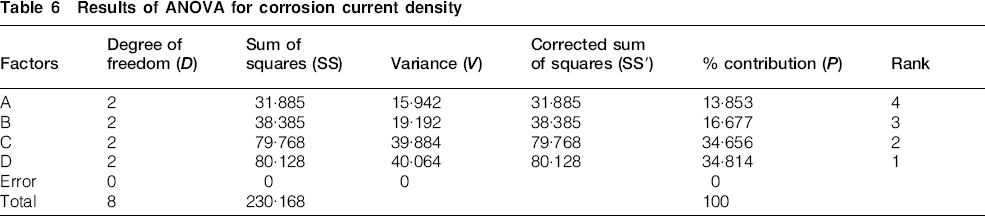
The contribution of each factor to the corrosion current density can be determined by performing ANOVA. The results of ANOVA are summarised in Table 6. The data given in Table 6 show that the contributions of the four factors, i.e. concentration of nickel source solution, concentration of reducing agent, concentration of TiO2 powder and bath temperature are 13·853, 16·677, 34·656 and 34·814% respectively. It is evident that, among the selected factors, concentrations of TiO2 and bath temperature have the major influence on the coating parameters for corrosion resistance.
Results of ANOVA for corrosion current density
Confirmation run
The confirmation experiment was performed by setting the experimental condition of the four factors as follows: 85°C for bath temperature, and 50, 10 and 10 g L−1 for the concentrations of nickel sulphate, sodium hypophosphite and TiO2 powder respectively. Figure 3 shows the Tafel polarisation curves of the coated sample from the confirmation run and from the pure copper substrate. It can be seen from Fig. 3 that the corrosion potential Ecorr of the optimised coating is more positive (−0·26 V) than that of the Cu substrate (−0·324 V), and the corrosion current density of the coating (0·34 μA cm−2) is lower than that of the Cu substrate (15 μA cm−2). Thus, the coating could be corroded only at a relatively higher potential and with a lower corrosion rate than the Cu substrate.
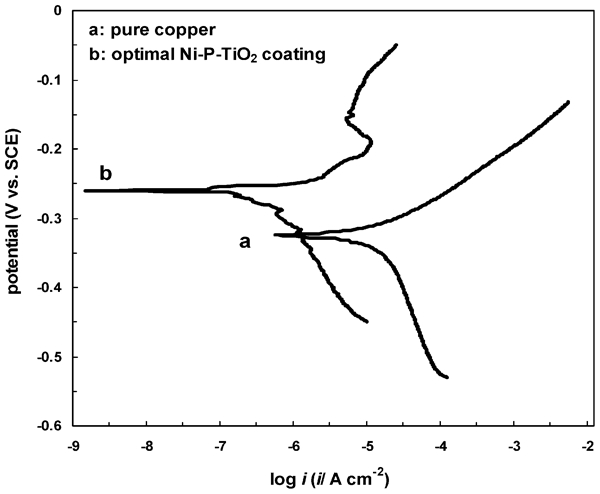
Polarisation curves of pure Cu and optimal Ni–P–TiO2 nanocomposite coating in 3·5%NaCl solution at scan rate of 0·2 mV s−1
Surface morphology and composition
Figure 4 shows the SEM images of the pure copper substrate and the coating surfaces deposited at optimal combination of the parameters A, B, C and D.
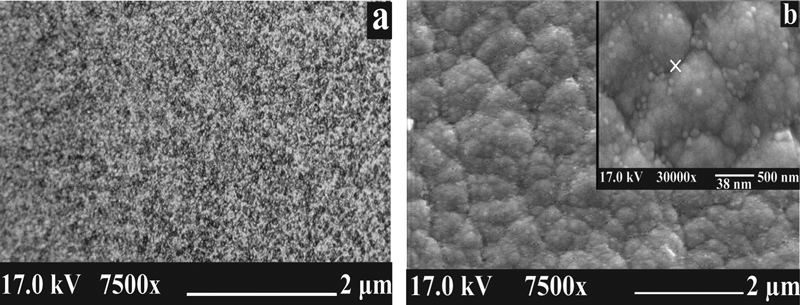
Images (SEM) of a pure Cu and b optimal Ni–P–TiO2 nanocomposite coating
The surface morphology of optimised Ni–P–TiO2 coating is different compared with pure copper.
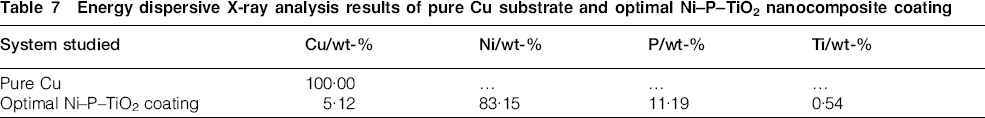
Figure 4a shows the structure of the bare copper surface immediately after polishing with emery paper grade 3000. As seen in this image, the surface is almost smooth and uniform without any holes or cavities. Figure 4b shows the surface of the same electrode after deposition of Ni–P–TiO2 nanocomposite coating from optimised conditions. As seen in this image, the Ni–P–TiO2 nanocomposite coating shows smother surface, more uniform and compact in appearance compared with that of pure Cu. The weight percentages of Cu, Ni, P and Ti are listed in Table 7. They support the idea that the TiO2 nanoparticles (average size of ∼38 nm) have been incorporated into the Ni–P coatings successfully.
Energy dispersive X-ray analysis results of pure Cu substrate and optimal Ni–P–TiO2 nanocomposite coating
Conclusion
Taguchi orthogonal array is employed to optimise the coating process parameters with respect to corrosion behaviour of electroless Ni–P–TiO2 nanocomposite coatings against copper. It is seen that bath temperature and concentration of TiO2 powder have the most significant influence in controlling corrosion characteristics of electroless Ni–P–TiO2 coating. The optimised values for the process parameters for minimum corrosion are obtained as concentration of nickel source solution = 50 g L−1, concentration of reducing agent = 10 g L−1, concentration of TiO2 powder = 10 g L−1, bath temperature = 85°C. The SEM study showed that Ni–P–TiO2 coatings are smooth and composed of discrete TiO2 nanoparticles with a crystallite size of ∼38 nm. The corrosion resistance of the optimised coating is >15 times better than that of the pure copper substrate.
Footnotes
Acknowledgements
This research was supported by the Islamic Azad University, Toyserkan Branch, Toyserkan, Iran. In addition, the authors would like to acknowledge the financial support of the Office in Charge of Research of Iranian Nanotechnology Society and the financial support of the Office of Vice Chancellor in charge of research of University of the Islamic Azad of Toyserkan Branch.