
Abstract
The aim of this work was to study the detailed microstructures, thermostability and microhardness distribution of high velocity oxygen fuel sprayed WC–10Co–4Cr coating using X-ray diffraction, scanning electron microscope, energy dispersive spectroscopy, differential scanning calorimeter and high resolution transmission electron microscope. The coating has a dense structure and is well bonded to the substrate. The coating is mainly composed of WC phase and W2C phase. Owing to the high cooling rates of molten droplets and the multicomponent system of feedstock powder, amorphous phase is obtained in the coating. The crystallisation temperature of the amorphous phase is 651°C. The Weibull analysis of Vickers microhardness of the coating exhibits a bimodal distribution under indentation load of 300 g and a monomodal distribution under indentation load of 100 g. Such distribution is attributed to the presence of the poorly bonded splats and pores within the coating.
Introduction
WC based thermal spray coatings are attractive candidates for use in wear resistance environments because of their hard WC particles and metal binder (Co, Ni or Co–Cr) with novel mechanical properties.1–4 Nevertheless, their mechanical properties are often decreased by decomposition and decarburisation of the WC phase during the spray process in traditional thermal spray technologies. 5 To avoid this problem, the high velocity oxygen fuel (HVOF) spraying technique has been used to deposit the WC based coatings.6–8 It is evident from literature that HVOF sprayed WC based coatings were dense and well bonded to the substrate with high fraction of retained WC. This is because the much higher gas jet velocity shortens the time of powder flame interactions and lower flame temperature reduced efficiently the decomposition of hard phase (WC).9–11
To date, numerous studies have been conducted on microstructure and performance of HVOF sprayed WC based coatings with their increased use in many engineering applications. Asl et al. compared the characteristics and wear properties of HVOF sprayed WC–17Co coatings in the as sprayed and heat treated conditions. They showed that the formation of brittle eta phases at high temperature heat treatments decreased the fracture toughness and wear resistance of the coating. 12 Lee et al. studied the effects of mixing powders with various particle sizes on the fracture toughness and wear resistance of HVOF sprayed WC–10Co–4Cr coatings and concluded that the mixing of a small amount of coarse powders with fine powders resulted in the highest fracture toughness and wear resistance mainly due to the formation of coating having the lowest porosity. 13 The decrease in carbide grain size of the starting WC–12Co powder led to a slightly higher degree of decomposition of WC and a decrease of indentation fracture toughness with improved wear resistance properties of the coatings. 14 Basak et al. demonstrated that the addition of Al into HVOF sprayed nanostructured WC–12Co coatings was effective in improving wear resistance in comparison to nanostructured and micrometre sized WC–Co coatings, while HVOF sprayed nanostructured WC–12Co coatings with or without Al exhibited lower corrosion resistance compared to micrometre sized coating. 4 To our knowledge, the microstructure and chemical composition of HVOF sprayed WC–Co coatings have been investigated in great detail, with TEM analysis and identification of amorphous phases in the matrix. 15 However, the detailed microstructures of HVOF sprayed WC–10Co–4Cr coatings are little understood.
In an earlier study, we have investigated the microstructure and cavitation erosion behaviour of a WC–Co–Cr coating whose starting powder was with a composition of C–40W–36Cr–20Co (wt-%). 11 In the present study, a detailed characterisation on the microstructures and thermostability of HVOF sprayed WC–10Co–4Cr coating, which has great influence on the properties, was undertaken using X-ray diffraction (XRD), differential scanning calorimeter (DSC), scanning electron microscope (SEM), energy dispersive spectroscopy (EDS) and high resolution transmission electron microscope (HRTEM). The porosity and microhardness distribution of the coating were also examined.
Experimental
A commercial agglomerated and sintered WC–10 wt-%Co–4 wt-%Cr powder (Large Solar Thermal Spraying Material Co. Ltd, Chengdu, China) was used in this study. Figure 1 shows the SEM morphology of this feedstock powder at a low magnification of ×500 (Fig. 1a) and a high magnification of ×2000 (Fig. 1b) respectively. It can be seen that the feedstock powder exhibits nearly spherical particle shape and has particle size distribution between 15 and 45 μm.
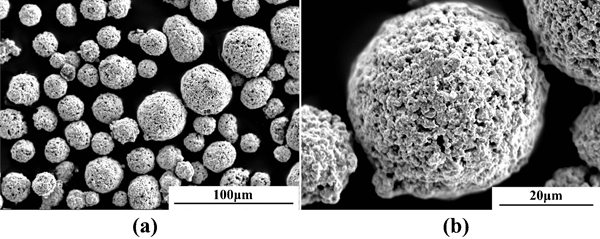
Images (SEM) of powder morphology at magnification of a ×500 and b ×2000
The feedstock powder was coated on the AISI 1045 steel substrate by HVOF spray system (Praxair Tafa-JP8000, USA). Before spraying process, the substrate samples (50×25×3 mm) were precleaned in acetone, dried by hot air and then grit blasted with 30 meshes Al2O3. The optimum spray parameters used in the present study were conducted at a spray distance of 300 mm, an oxygen flowrate of 897 L min−1, a kerosene flowrate of 0·38 L min−1, an argon carrier gas flowrate of 10·86 L min−1, a powder feedrate of 5 rev min−1 and a spray gun speed of 280 mm s−1.
Phase structures of the powder and coating were determined by XRD (Bruker D8-Advanced, Germany) in 2θ ranging from 20 to 90° using Cu Kα radiation and step 0·02°. Thermostability of the as sprayed coatings was investigated by DSC (Netzsch Sta-449PC, Germany) in a flow of nitrogen atmosphere with a heating rate of 10 K min−1 from room temperature to 900°C. The coating was first removed from the substrate, lightly ground on SiC abrasive paper and then pounded into powders (∼10 mg) by a mortar for DSC analysis. The microstructure of the feedstock powder and as deposited coating was examined by an SEM (Hitachi S-3400N, Japan). Selected area electron diffraction (SAED) pattern and finer scale microstructural characterisation of the coating were performed using an HRTEM (JEOL JEM-2100F, Japan) operated at 200 kV. For HRTEM foil preparation, the coating was first separated from the substrate by wire cutting, then ground to 60 μm thick using SiC abrasive paper and finally ion milled using a precision ion polishing system to the HRTEM requirement. The HRTEM observation carried out on plan views of the coatings. Porosity measurements were determined using an optical microscopy (Olympus BX51M, Japan) fitted with an image analyser on polished cross-sections of the coating at a magnification of ×500.
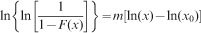
Microhardness measurements were carried out on the transverse section of the coating under loads of 100 and 300 g for 15 s using a Vickers microhardness tester (HXD-1000TC), and 50 readings were carried out for each sample. To analyse the microhardness readings of coating, Weibull distribution was used to determine the presence of a multimodal distribution of hardness values in the coating.16,17 Equations (1) and (2) were used to generate the Weibull plots for analysis

Results and discussion
Phase and microstructures of coating
Figure 2 presents the XRD patterns for the feedstock powder and as sprayed coating. It is seen that a main WC [Joint Committee on Powder Diffraction Standards (JCPDS) no. 89-2727] and minor Co (JCPDS no. 89-4307) phases were detected in the powder. However, after HVOF spraying, a new phase of W2C (JCPDS no. 35-776) is detected. The decarburisation is verified by the TEM images as shown in Fig. 6. The slight shift between the observed peak of W2C and the nominal position (based on JCPDS no. 35-776) may be explained either by a slight doping with Cr, which causes a change in lattice parameters, 18 or by a rigid displacement of the diffraction pattern towards larger 2 theta values, maybe due to sample positioning and/or diffractometer alignment (for instance, all peaks of WC in the XRD pattern of the coating are shifted to larger 2 theta angles compared to those in the pattern of the feedstock powder). Figure 2 also shows that the WC peaks of the coating are broader than those of the powder, suggesting that there is an amorphisation of the WC phase during the spraying process.
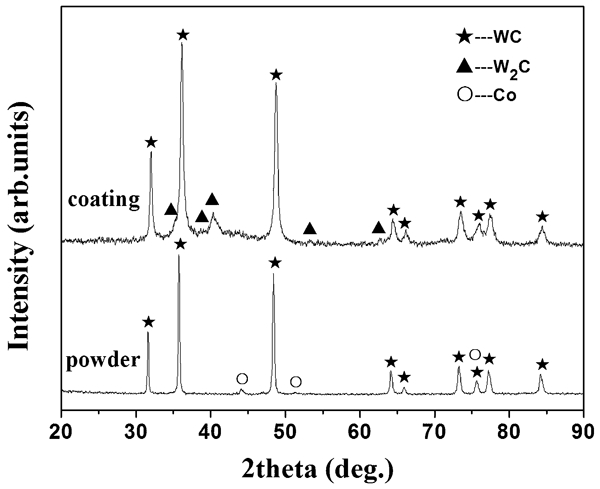
X-ray diffraction patterns of feedstock powder and as sprayed coating
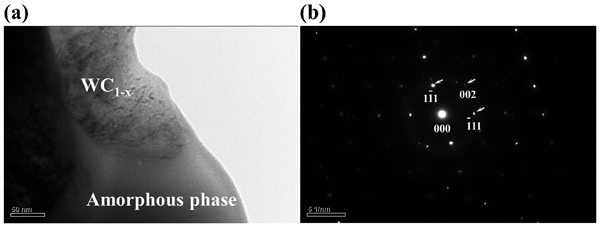
Images (TEM) of microstructure of coating: a region of WC1-x and amorphous phase; b SAED pattern of WC1-x phase
Figure 3 shows the polished cross-sectional microstructure of the as sprayed coating. Overall view of the coating, shown in Fig. 3a, reveals that the coating is dense and well bonded to the substrate with a thickness of ∼400 μm. The average porosity value of the coating is <1% from Fig. 3b, which is in agreement with the results that have been observed in our previous investigations of other HVOF sprayed coatings.11,19–21 Figure 3c shows that fine tungsten carbides are distributed uniformly in the coating. In addition, some limited pores and microcracks are observed from the microstructure. Under a magnified view as shown in Fig. 3d, the EDS analysis is undertaken at both A and B points. The quantitative analysis (wt-%) of these points is given in Fig. 3e and f respectively. The EDS spectrum of point A reveals that the light grey particle with polygonal morphology contains primarily W and C, indicating the presence of tungsten carbide phase. The matrix in dark grey colour (point B) mainly contains W along with significant presence of C and Co, and the presence of other elements like Cr and O in small amounts is also observed. This indicates that a small amount of oxide appears in the matrix. However, no oxide formation has been detected in the coating by the XRD analysis due to the very low oxide content.
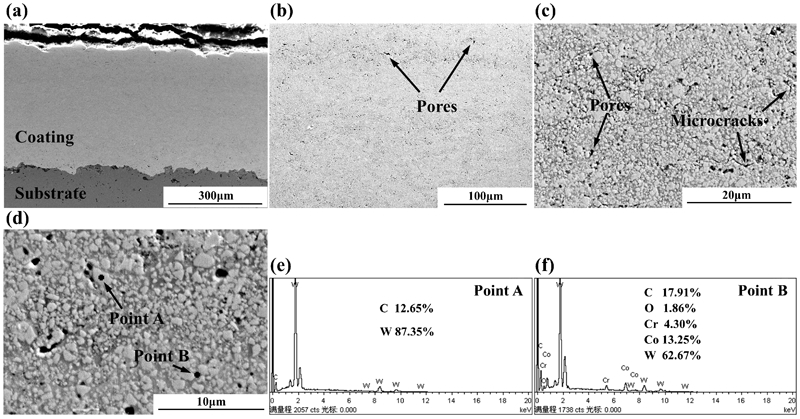
Images (SEM) of transverse section of as sprayed coating: a lamellar morphology; b pores; c pores and microcracks; d carbide grains and binder phases; e EDS result of point A; f EDS result of point B
The TEM and HRTEM were used to obtain more detailed microstructural information at a finer scale of the WC–Co–Cr coating in the present study. Figure 4a and b shows a bright field TEM image of the coating and the corresponding SAED pattern respectively. It is evident from the diffused halo ring in the SAED pattern that the coating has an amorphous structure. It is known that the glass formation is closely related to the atomic radius and mixing enthalpy. 23 In the WC–Co–Cr system, the effective addition of W, Co, Cr and C causes the sequential change in the atomic size in the order of W (1·41 Å)>Cr (1·27 Å)>Co (1·26 Å)>C (0·86 Å), 23 leading to the formation of the packed local structure with low atomic diffusivity in the super cooled liquid. 24 The mixing enthalpy values for Co–W, Cr–Co, C–Co, C–W and C–Cr atomic pairs are −1, −4, −42, −60 and −61 kJ mol−1 respectively. 23 The topological structure and chemical short range order result from the large negative mixing heats among the constituent elements. 25 Therefore, the Co–Cr–W–C system satisfies the three empirical rules proposed by Inoue et al., i.e. multicomponent, significant atomic size mismatches and suitable negative heats of mixing among the constituent elements. 22 Furthermore, the individual splat is estimated to cool at a rate in excess of 106 K s−1 during HVOF thermal spraying process, which is suitable for forming an amorphous phase. 26
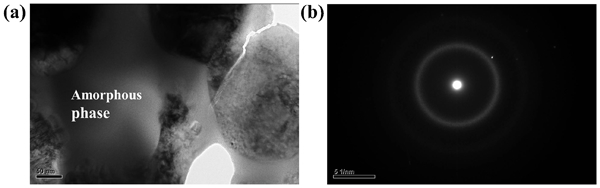
Images (TEM) of microstructure of coating: a region of amorphous phase; b SAED pattern of amorphous phase
Figure 5a illustrates a bright field TEM image of the coating, which contains two different regions (i.e. regions A and B). Corresponding SAED patterns and HRTEM image of region A (indicated by circle) are shown in Fig. 5b and c respectively. It is revealed that region A is identified as the WC phase with the incident beam parallel to the zone axis of [210]. Figure 5d is HRTEM image of region B (indicated by ellipse). It is evident from the image that there is a transition region with thickness of ∼4 nm between the WC grain and the amorphous phase, indicating that there may be some interaction between WC particles and the molten matrix phase during the spraying process. The formation of the transition region could result from different specific heat and heat capacity of WC and Co based metal alloys, which have a great influence on the ability of the various phases to retain heat. A similar morphology has been observed by other researchers. 27
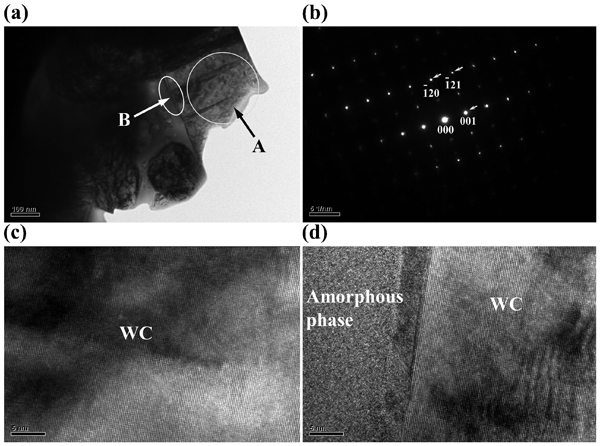
Images (TEM) of microstructure of coating: a region of WC and amorphous phase; b SAED pattern of WC phase; c HRTEM image of region A; d HRTEM image of region B
Figure 6a and b shows a bright field TEM image of the WC1−x phase and the corresponding SAED pattern respectively. The diffraction pattern indicates that the WC1−x phase is along the zone axis of [110], although the WC1−x phase has not been observed in the coating by the XRD analysis. The result indicates that the decomposition of hard phase (WC) (decarburisation) is unavoidable during the spraying process, which is due to the complete combustion of the kerosene producing the highest flame temperature.
Differential scanning calorimetry was undertaken to investigate the thermostability of the WC–Co–Cr coating and the crystallisation temperature of the amorphous phase. An exothermic peak is observed in Fig. 7, which indicates a solid state transformation. The onset temperature of crystallisation Tx is 636°C, and the peak temperature is 651°C. The presence of amorphous phase has been confirmed by preceding TEM images, although the glass transition temperature Tg was not observed for the coating. This phenomenon was similar to the results in our previous investigation. 21
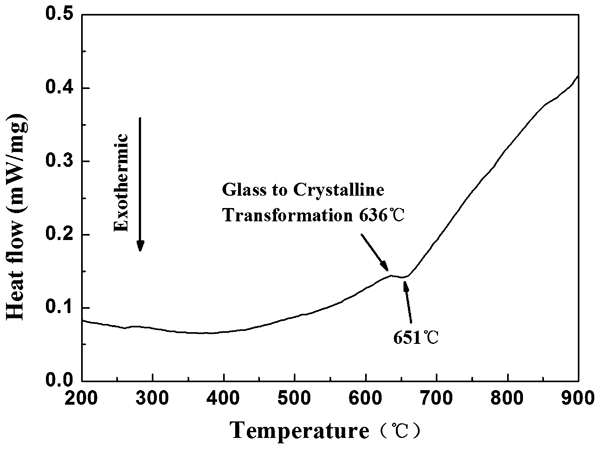
Typical DSC trace of as sprayed coating
Weibull analysis of Vickers microhardness of HVOF sprayed WC–Co–Cr coating
Figure 8 reveals the probability function of Weibull plots of Vickers hardness of the WC–Co–Cr coating under loads of 100 and 300 g. The coefficient of determination R2 was calculated for the goodness of fit. If R2≥0·95, the corresponding fit is good for the Weibull plot.29 The smallest R2 between the measured points and fitted curves is 0·952, as seen in Fig. 8, which indicates a high degree of fitting. Moreover, it can be seen from Fig. 8 that the coating presents a monomodal distribution in the Weibull plot with respect to the Vickers hardness under load of 100 g. When the indentation load increases to 300 g, a bimodal distribution is observed. The points with low hardness may correspond to poorly bonded splats within the coating or to indentations performed on or close to defects (pores, etc.).
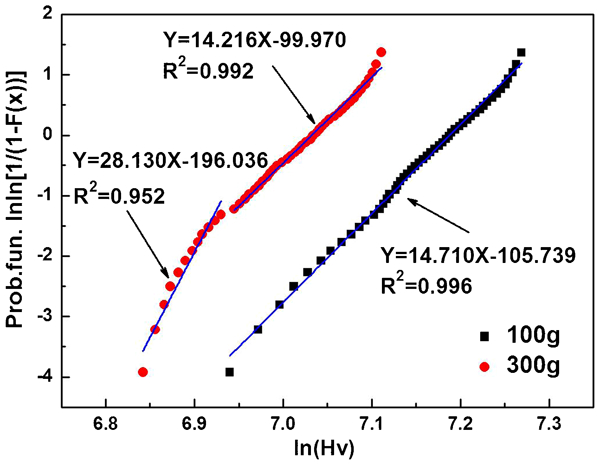
Weibull analysis of Vickers microhardness distribution for as sprayed coating
The results obtained from Fig. 8 are summarised in Table 1. Lower average hardness value and relatively narrower hardness ranges are observed for the coating measured under higher indentation load. The reason is that the presence of pores and microcracks with various orientations affects the measured values significantly under lower indentation load, whereas the pores and microcracks coupled with carbides could be analysed under a higher indentation load.
Summary of results obtained from Weibull distribution plots*
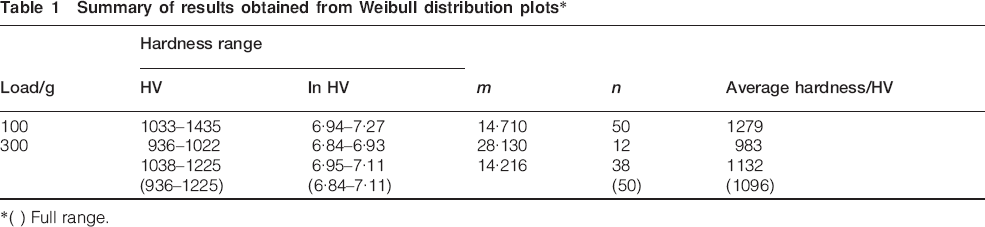
( ) Full range.
Conclusion
This investigation studied the detailed microstructures, thermostability and microhardness distribution of HVOF sprayed WC–10Co–4Cr coating. The main conclusions are as follows.
The feedstock powder was mainly composed of WC phase and Co phase. Amorphous phase was obtained in the corresponding coating, and the major crystalline phases were WC and W2C.
The formation of amorphous phase was due to both the high cooling rates of molten droplets and the multicomponent system of feedstock powder. The decomposition and crystallisation of amorphous phase occurred at 651°C.
A bimodal distribution was observed by Weibull plot analysis of Vickers microhardness measurements under indentation load of 300 g. The coating exhibited lower average hardness value and relatively narrower hardness ranges under indentation load of 300 g than those under indentation load of 100 g.
Footnotes
Acknowledgement
The research was supported by the Marine Renewable Energy Fund Project of the State Oceanic Administration (grant no. GHME2011CX02) and the Research and Innovation Project for College Graduates of Jiangsu Province (grant no. CXLX12_0244).