
Abstract
Nanostructured scaffolds were synthesized on the surface of equiatomic NiTi alloy (Nitinol) via hydrothermal treatment at 120 ± 1°C and 250 kPa using alkali (NaOH) solution of different strength. The scaffolds were found to be composed of intermingled nanopetals with varying morphology and phase content depending on the treatment time and alkali concentration. Single or mixed Ni3Ti3O, NiTiO3, H2Ti3O7 and TiO2 (anatase and rutile) phases were observed in the scaffold by X-ray diffraction study. Standard hemolysis testing showed significant biocompatibility improvement of the scaffolds grown in low strength alkali. Measurement of Ni release in the simulated body fluid (SBF) revealed that Ni release can be decreased from ∼60 μg L− 1 for the mechanically polished bare NiTi surface to ∼2·7 μg L− 1 for the scaffolded surface (scaffolds grown in low strength alkali).
Keywords
Introduction
Nitinol is a group of nearly equiatomic Ni–Ti alloys with variable transformation temperatures and related properties depending on the alloy compositions. Among those alloys, equiatomic (50:50) nickel–titanium alloy can be considered as one of the most important and promising materials in the biomedical implantation fields because it has excellent shape memory property (with large recoverable strain)1–5 and high specific strength. 6 However, deposition of surface coating is necessary to improve biocompatibility. Formation of an ideal coating on Nitinol surface is based on two considerations: (i) the coating should provide enough mechanical strength without affecting the shape memory properties of the implant, and (ii) the coating should enhance biocompatibility and antibacterial properties in bodily environment, which can promote adhesion and growth of the accommodated tissues/cells successfully,7–9 and at the same time, it should be free from nickel release and related toxic/allergic effects.10–12 Hemolysis is one of the important techniques generally used to measure biocompatibility of the materials.13–15
Most of the techniques related to surface treatments of NiTi alloys have some disadvantages associated with their advantages. Enhanced corrosion and excess nickel release in blasting (sand) technique,16,17 high nickel concentration on NiTi surface and related toxic effect in the wet chemical oxidation process, 18 formation of thick hard ceramic phase layer on the surface and the subsequent crack formation and corrosion under dynamic loading in plasma phase oxidation technique, 19 and low breakdown potential of the surface and related surface damage in oxygen PIII samples are a few examples.20,21
Cheng et al. and Shi et al. reported on a corrosion study of the oxide coatings deposited on the NiTi surface by hydrothermal treatments.22–24 Here, for the first time, we report a study about fabrication of nanopetal scaffold on Nitinol alloy through an inexpensive one-step hydrothermal treatment. The effects of hydrothermal parameters like alkali strength and reaction/treatment time on growth morphology and phase content of the scaffold were examined. The effect of hydrothermal reaction parameters on hemolysis tests as well as on Ni release tests was found to be encouraging, and therefore, this technology could be of industrial interest in future.
Experimental
Synthesis of oxide scaffold
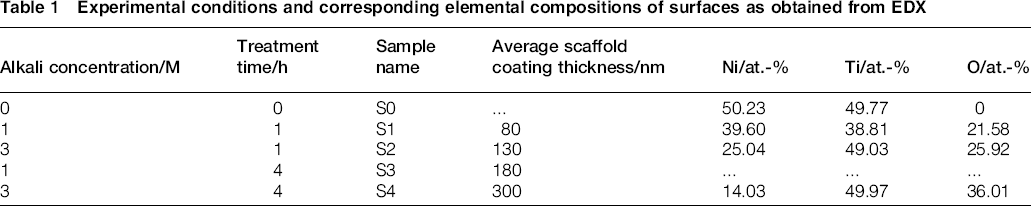
Commercially available ultrapure grade Nitinol sheets (∼0·125 mm thick; Johnson Mathews, USA) were cut into 10 × 10 mm2 pieces. Subsequently, the cut pieces were cleaned ultrasonically with acetone (Bengal Chemicals, India) and were rinsed with deionised (DI) water. These clean pieces were transferred into autocleavable polypropylene bottles (Tarsons), each bottle containing 20 mL freshly prepared NaOH solution (strength varies from ∼1M to 3M). The NaOH solutions were prepared using NaOH pellets (S D Fine-Chem Ltd). The bottles were then loosely closed and subjected to hydrothermal treatment in an autoclave (at 120 ± 1°C, 250 kPa) for different time intervals varying from 1 to 4 h. The treated samples were washed with DI water, cleaned with acetone, followed by drying in air, and finally kept in desiccators to avoid any contamination before further experiment and examination. Table 1 shows the sample designations according to the treatment time and NaOH concentration.
Experimental conditions and corresponding elemental compositions of surfaces as obtained from EDX
Characterisation
The morphology, growth and composition of the coating were studied using a field emission scanning electron microscope (FESEM; Zeiss Supra 40) with EDX (energy dispersive X-ray spectroscopy) attachment. A grazing incident X-ray diffractometer (GI-XRD; Philips X'Pert Pro MRD, Cu target) with a glancing angle of ∼0·5° was used to analyse the phase content of the surface scaffold. The GI-XRD patterns obtained from the diffractometer were analysed using the PCPDFWIN software.
Biocompatibility tests
Hemolysis test
Blood compatibility of the samples was measured by hemolytic activity measurement (hemolysis test) to evaluate the relative lysis of red blood cells when it comes into contact with the coating. Fresh human blood (10 mL) donated by a healthy, non-smoker, non-drinker was collected in heparinised tube and centrifuged at 3000 rev min− 1 for 4 min at 4°C. The isolated erythrocytes were washed with an Alsever solution (Biochrom; 
Ni release test
The Ni release test was conducted in simulated body fluid (SBF) with ion concentrations nearly equal to those of human blood plasma. The SBF was freshly prepared in a properly cleaned glass bottle by dissolving a series of chemicals in 1 L DI water at 36·5°C. 26 The chemicals were added with a sequence of 7·996 g NaCl, 0·350 g NaHCO3, 0·224 g KCl, 0·228 g K2HPO4.3H2O, 0·305 g MgCl2.6H2O, 40 cm3 1M HCl, 0·278 g CaCl2, 0·071 g Na2SO4 and 6·057 g (CH2OH)3CNH2. Finally, the pH was adjusted to 7·4 by adding an appropriate amount of 1M HCl. The NiTi samples were immersed in polypropylene test tube each containing 25 mL of SBF solution. The polypropylene test tubes were tightly closed and incubated in an incubator shaker chamber at 37 ± 1°C for 1 and 4 weeks. All the bottles were shaken for 2 h day− 1. After incubation, the SBFs were analysed by ICPMS (Varian 820-MS) attached with the ICPMS Expert software, version V2·1 b105, to determine the amount of Ni leached from the specimens.
Results and discussion
Phase analyses
Figure 1a–d depicts the GI-XRD patterns obtained from the surface of the Nitinol samples treated in NaOH with concentrations of 1 and 3 mol L− 1 for 1 and 4 h respectively. The peaks at 2θ = 42·5, 61·6, and 77·7°, observed for all coatings, correspond to NiTi B2 (austenite) phase (pdf #01-078-4616), originated from the substrate. For the S1 sample, the intensity of these substrate peaks was observed to be the maximum. With the increase in treatment time and/or alkali concentration, as expected, substrate peaks diminished for other samples. For S1, a weak shoulder of 100% peak (110) of the NiTi was observed at ∼42°, which could be indexed as 100% peak (511) of Ni3Ti3O phase (pdf #01-075-0399). Additionally, the 31, 29 and 11% peaks at 39·5° (422), 45·9° (440) and 48·8° (442) respectively, corresponding to the Ni3Ti3O phase, were observed for S2, S3 and S4 samples. The peaks at 33·1 and 35·7°, corresponding to 100% (104) and 70% (110) peaks of NiTiO3 (pdf #00-033-0960) phase respectively, were detected to be present in S2, S3 and S4 samples. For the S3, besides NiTiO3 and Ni3Ti3O, TiO2 anatase and titanate (H2Ti3O7) phases were also observed at 25·3 and 29·8° respectively. For the S4 sample, rutile TiO2 peaks at 27·5, 36·2 and 54·3° were observed. No peak indicating the presence of elemental Ni or NiO could be detected in any of these spectra. It is a well known fact that generally oxidation of NiTi creates Ti rich oxide coating on the surface by suppressing Ni underneath gradually, which is quite consistent with our results.16,18,20 In some cases, hydrothermal treatments of NiTi surface were reported to synthesise coatings of somewhat different phase compositions.27,23,24 Chrzanowski et al. treated NiTi at a much higher alkali concentration (10 mol L− 1) and for longer treatment time (24 h) at 80°C, which increases surface Ni and decreases Ti tremendously. 27 Shi et al. treated NiTi sheet in a NaOH–NaNO3–H2O (20, 15 and 65 wt-% respectively) solution at 200°C for 20 h, and only Ni(OH)2 phase was observed on the surface. 24 Cheng et al. reported the formation of anatase TiO2 coating by hydrothermal treatment of NiTi in an ammoniacal solution of H2O2 and Ti4+ ions. 23 These may indicate the importance of treatment environment and conditions on the phase formation. The detailed study based on the effect of hydrothermal media will be published in the second part of this paper.
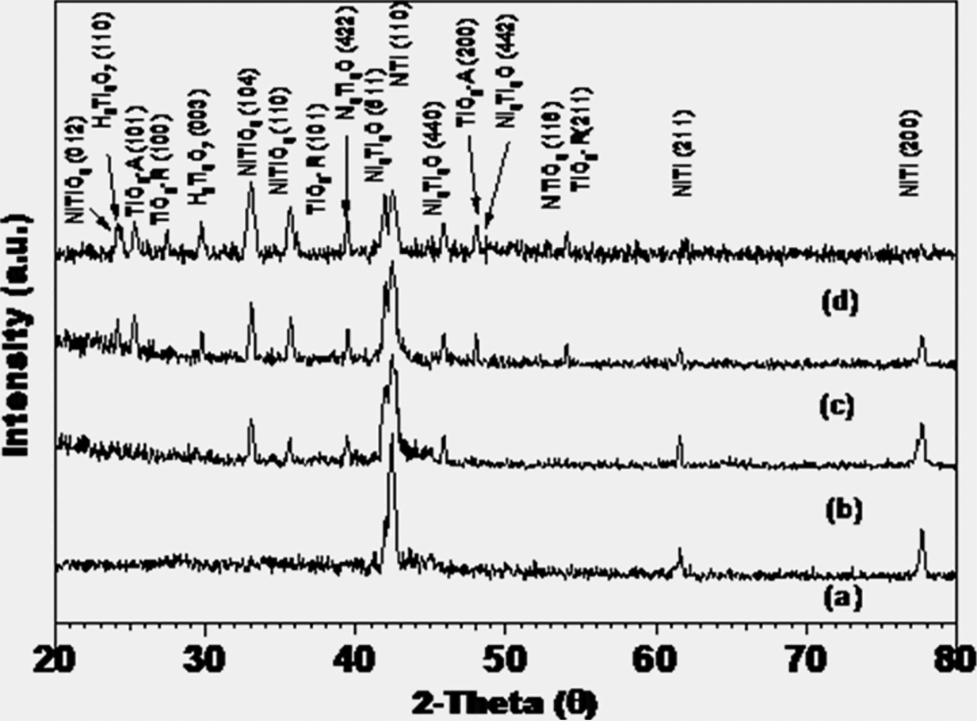
GI-XRD spectrum of coatings grown on NiTi surface at different alkali concentrations and treatment times: a S1—1 mol L− 1, 1 h; b S2—3 mol L− 1, 1 h; c S3—1 mol L− 1, 4 h; d S4—3 mol L− 1, 4 h; evolution of Ti and O rich phase with increasing treatment time and/or alkali concentration is clear
Microstructure
Figure 2 reveals the morphology and microstructure of the mixed phase coatings grown on NiTi surfaces at different alkali concentrations and different treatment times. For the lowest alkali concentration and treatment time (S1), the coating microstructure has been observed as a combination of two kinds of morphology: (i) a few numbers of larger nanopetals having dimension of ∼40–60 nm width, 50–100 nm length and ∼10 nm thickness erected here and there on the NiTi surface, and (ii) a large number of smaller nanopetals covered the NiTi surface/matrix, which occurred as a result of high nucleation and low growth rate. For the S2 sample, the higher alkali concentration (3 mol L− 1) led to higher nucleation rate, which subsequently provided more agglomerated larger nanopetals. In sample S3, where treatment time is 4 h, the smaller petals in the matrix also grow in size, and therefore, overall morphology did not change much. A uniform growth of the nanopetals was observed throughout the matrix. In the case of S4 sample (with maximum alkali concentration and treatment time), the three-dimensional scaffold grew like bundle petals of a flower, meshed with each other and rooted into the substrate. The cross-sectional FESEM image (Fig. 2e) shows that the thickness of the scaffold coating achieved for S4 sample is ∼300 nm, and the petals are made of smaller grains of size ∼25–30 nm. The minimum scaffold coating thickness obtained was ∼80 nm in the case of S1 sample treated with lowest alkali concentration (1 mol L− 1) and with minimum treatment time (1 h). The scaffold coating thicknesses of all the four samples are mentioned in Table 1. Graph (f) shows the variation in average petal dimensions (length, width and thickness) for the four samples. To increase in alkali concentration or reaction time, length, width and thickness of the nanopetals were found to be increased. Inset EDX images show that Ni decreases and Ti and O increase with increasing treatment time and/or alkali concentration. This could be explained by the fact that the enthalpy of formation of TiO2 ( − 956 kJ mol− 1) is much less than that of NiO ( − 241 kJ mol− 1). 28 Therefore, Ti and O rich phases preferentially formed on the top surface with nickel rich layers beneath. The sequence of formation of the oxides—Ni3Ti3O first, then NiTiO3 followed by TiO2 and/or titanate (H2Ti3O7)—indicated that the O2 − diffused into the substrate instead of the alloy diffused out, and oxidation happened from the surface to the interior.

Morphology and microstructure of mixed phase coating grown on NiTi surface at different alkali concentrations and treatment times: a S1—1 mol L− 1, 1 h; b S2—3 mol L− 1, 1 h; c S3—1 mol L− 1, 4 h; d S4—3 mol L− 1, 4 h; e shows the thickness of the scaffold coating for S4; dotted outline shows shape of nanopetal formed; f variation of petal dimensions; inset EDX spectra show changes of coating elemental composition; Ni decreases and Ti and O increase with increasing treatment time and/or alkali concentration
Biocompatibility
Figure 3 shows the hemolytic activity of the coatings grown on the NiTi surface at different alkali concentrations and treatment times. The untreated sample (S0) can be considered as more toxic (HR>5%) in nature compared to the other samples, while the S2 and S3 can be considered as non-hemolytic, which showed hemolytic activity of < 2%. 12 Figure 4 shows the Ni release for the NiTi samples after 1 and 4 week treatment in SBF. The maximum Ni release occurred for the mechanically polished bare surfaced NiTi (S0). These values agree well with the results reported earlier for the untreated NiTi samples and explain the high HR value for the S0. 20 Hydrothermal treatment significantly reduces the Ni release from the NiTi samples. Sample S3 showed the best result: Ni release of ∼2·7 μg L− 1, within the accepted limit of Ni in human blood serum, 1–6 μg L− 1. 29
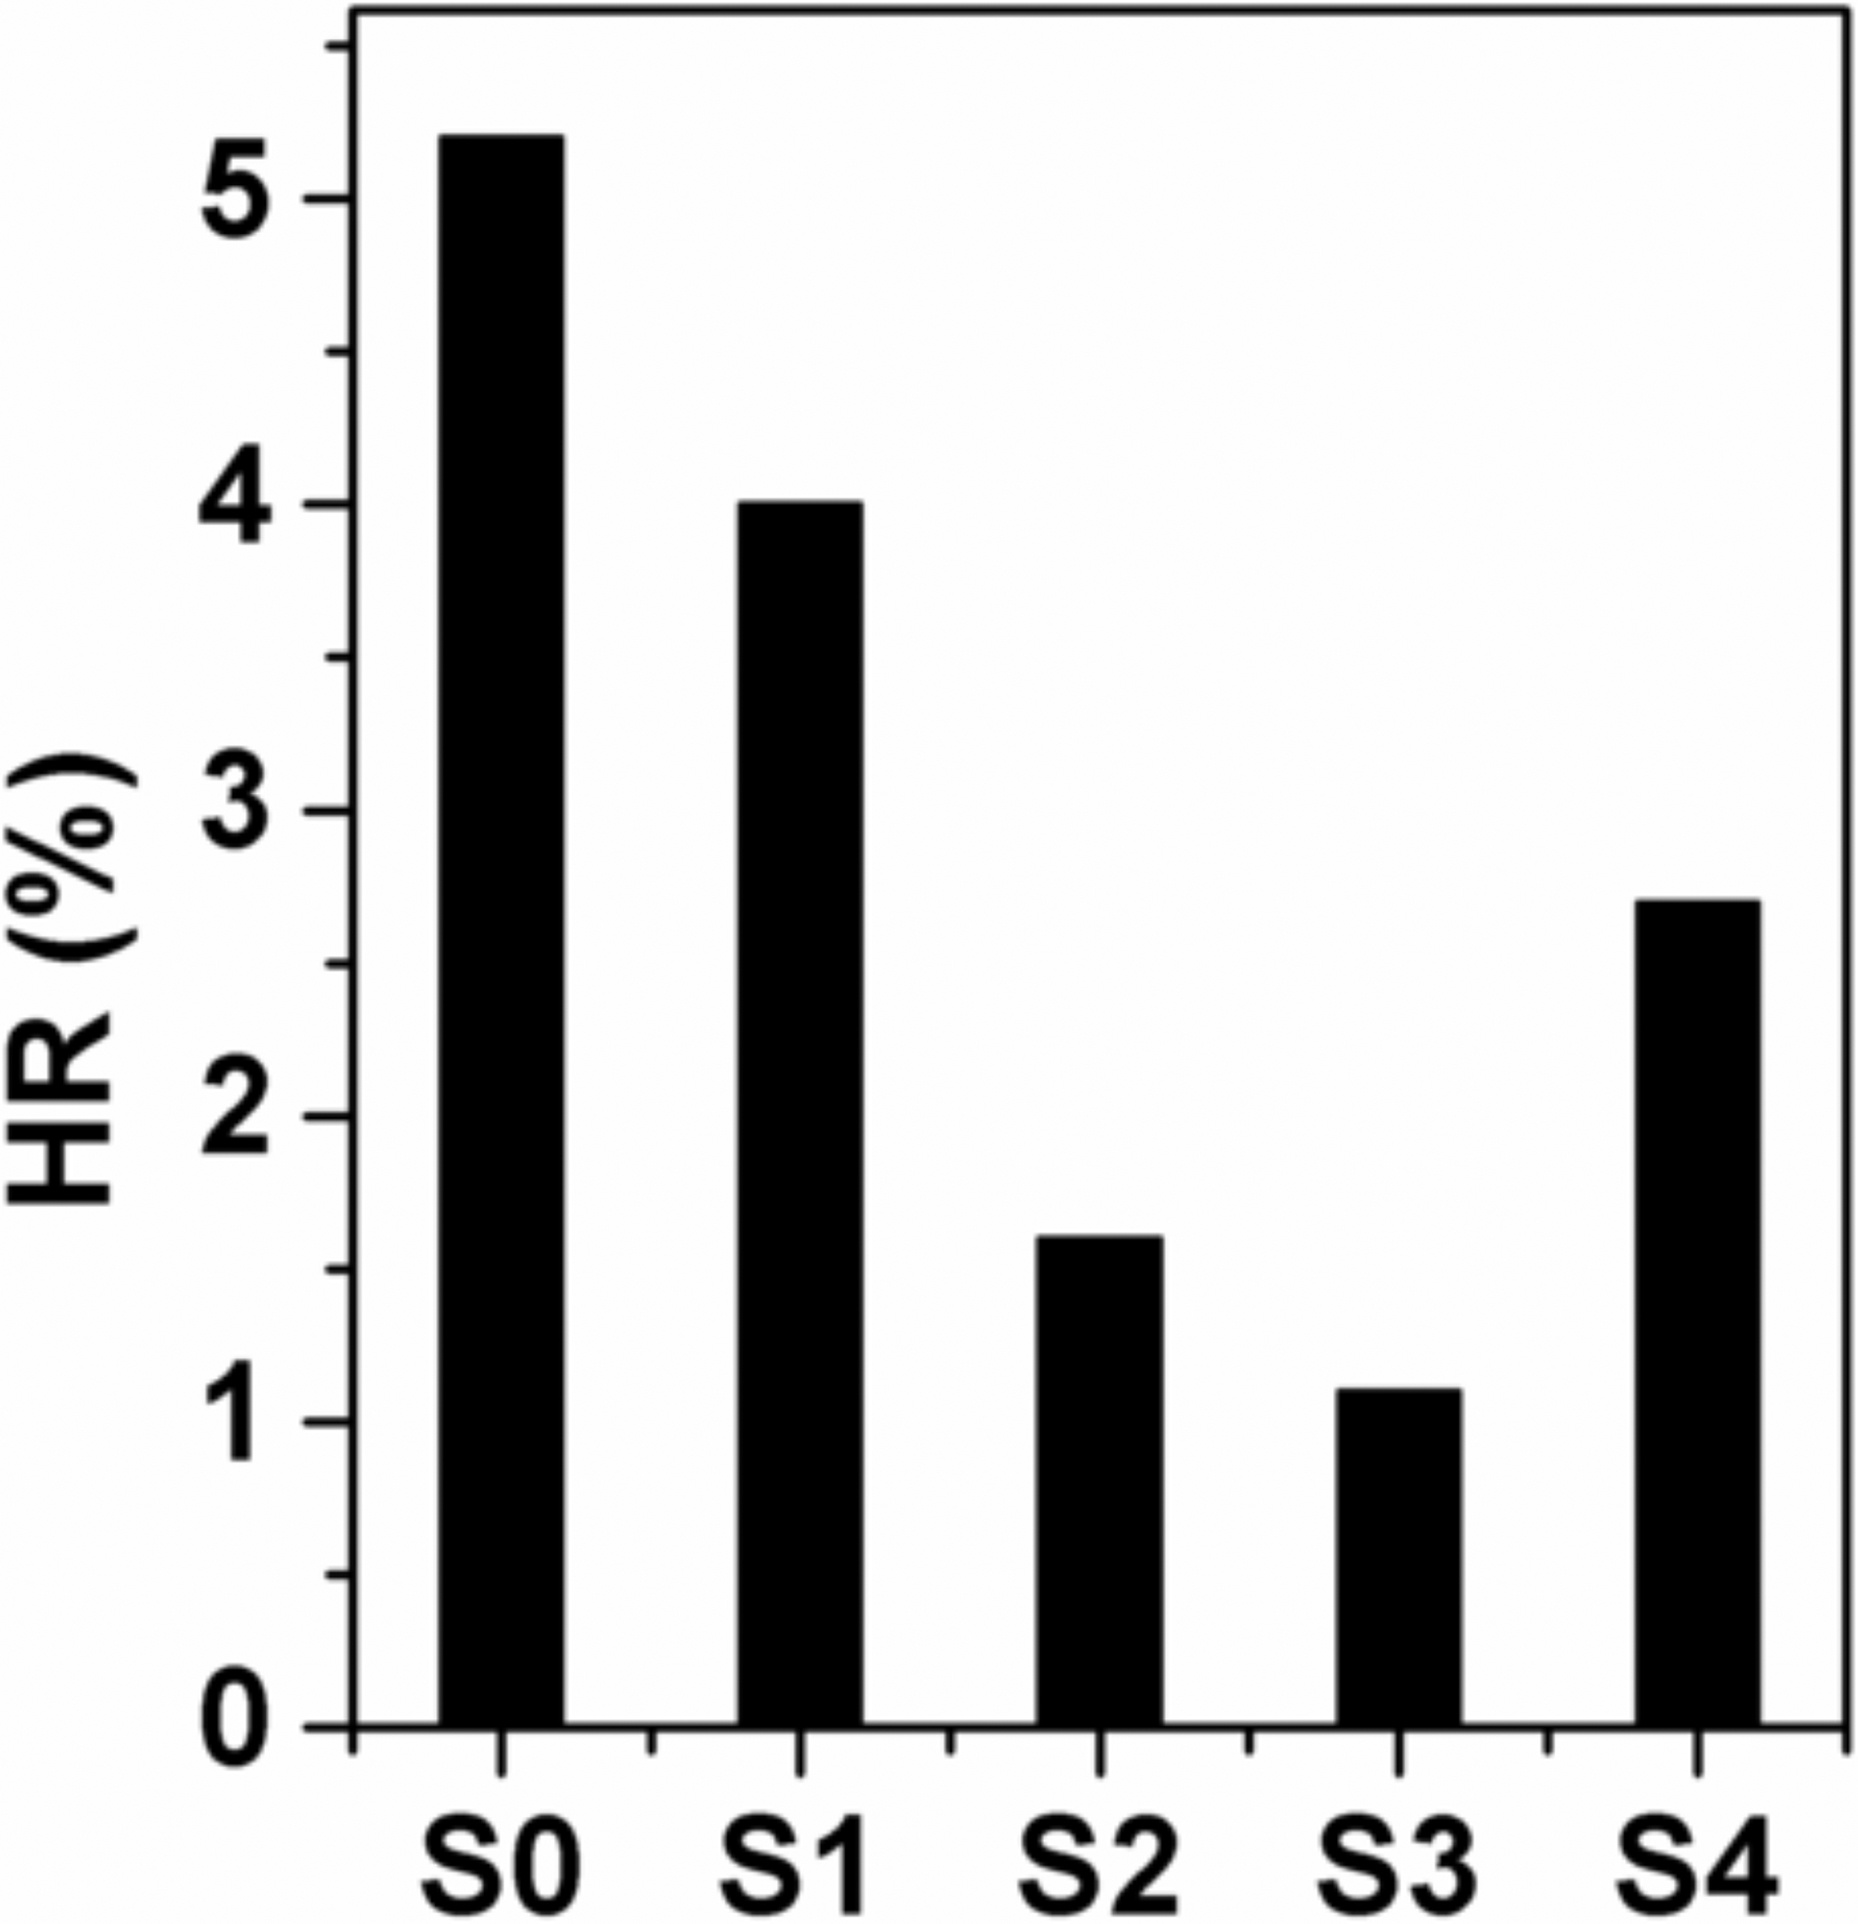
Hemolytic activity of coatings grown on NiTi surface at different alkali concentrations and treatment times
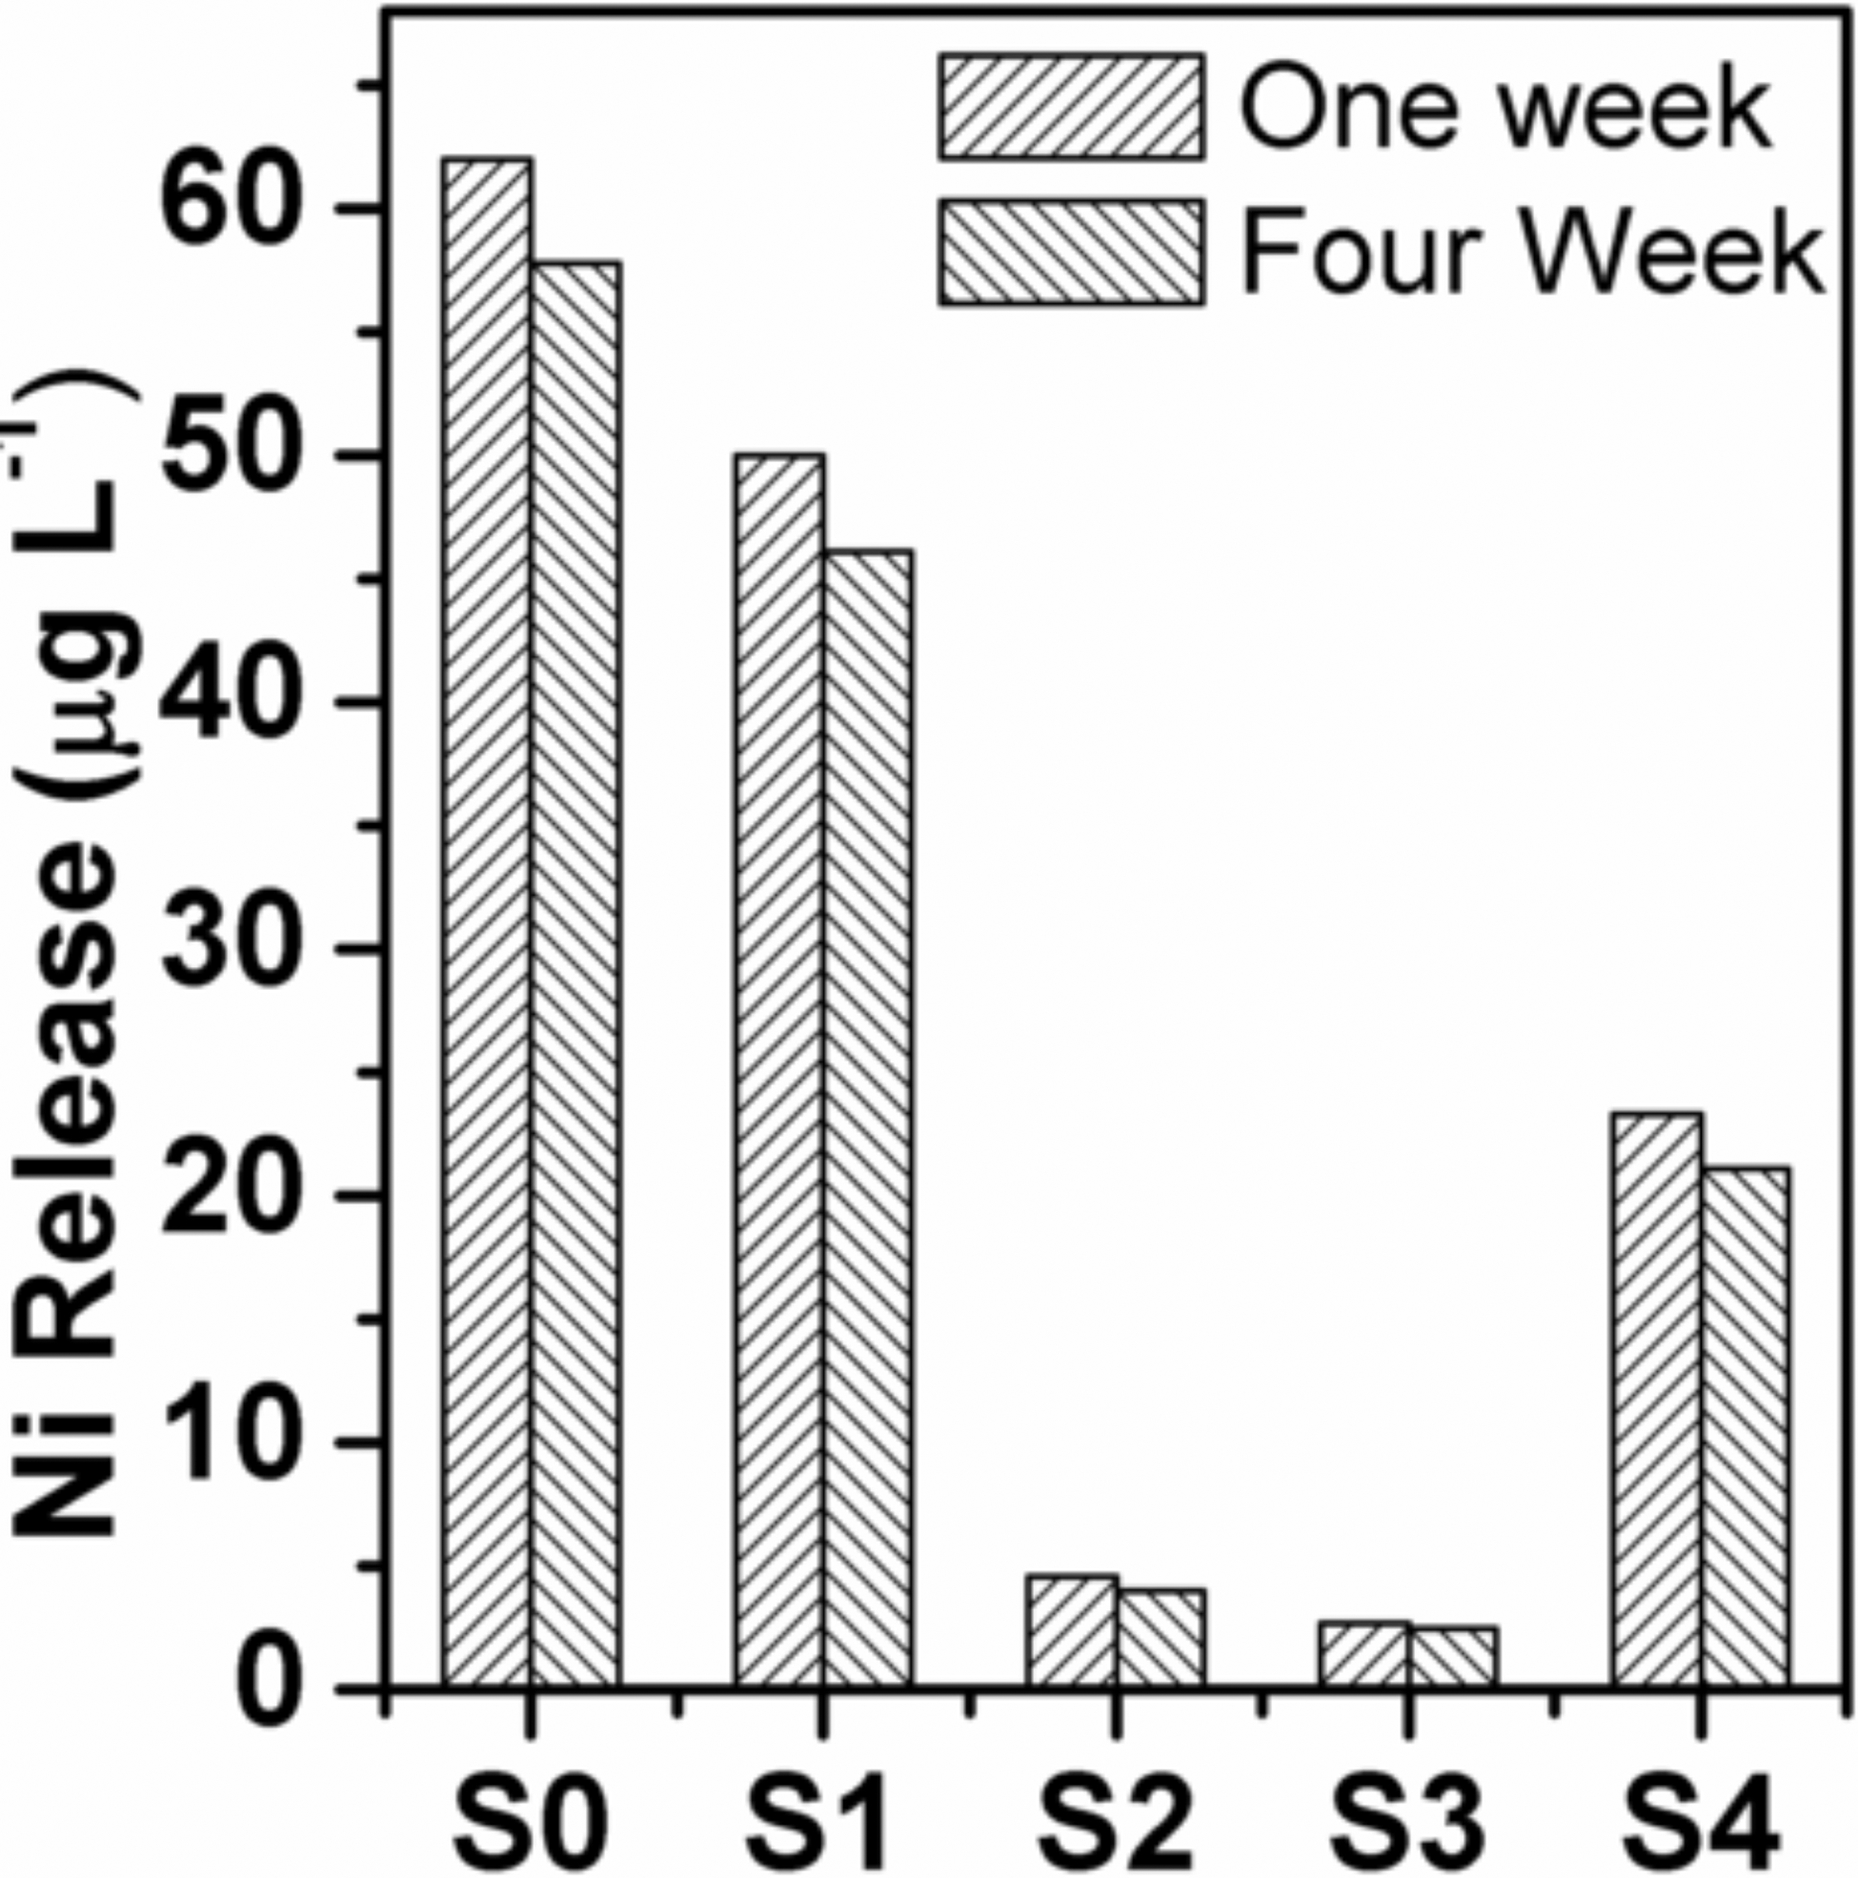
Ni release in SBF for scaffolds grown on NiTi surface at different alkali concentrations and treatment times
Although the higher alkali concentration and longer time treatment help increase the oxide coating thickness, the high HR% and Ni release of the S4 sample correlate well with the possibility of porosity and/or crack formation on the NiTi surface after strong alkali treatment for a long time. In addition, it can be seen that samples that were hydrothermally treated with a low strength NaOH solution for longer time are more effective in reducing nickel release than those that are treated in less time in higher concentrated solution. Longer immersion time, 1–4 weeks, in SBF decreased the Ni release, which could be a result of Ni–OH formation on the surface at high pH. 30
Conclusion
Nanostructured Ti rich oxide scaffold was developed hydrothermally in this work, which could be used for improving biocompatibility of NiTi implants. The phase content, size, shape and morphology of the scaffold could be controlled by controlling either alkali strength or reaction time or both. However, increasing reaction time, rather than the alkali concentration, was found to be more effective in reducing hemolysis and Ni release.
Acknowledgements
This work was financially supported by the Indian Institute of Technology (IIT), Kharagpur, India.