
Abstract
In order to optimise the activation process, the effect of three activation processes on the direct electroless nickel–phosphorous plating on AZ91D was studied. The properties of the activation coating and Ni–P coating were characterised with electrochemical tests, SEM and EDX. The results showed that an optimum activation coating for nickel deposition was developed via twice activations of K4P2O7 and NH4HF2 respectively. The first activation in the K4P2O7 solution could clean the surface and remove Mg3(PO4)2 dust produced by pickling. The coating with proper 1·12–1·49 F/O ratio (at-%) composed of MgF2 and MgO or Mg(OH)2 was produced via second activation in NH4HF2 solution. Excess hydrogen produced by Mg with H+ in the plating bath could lead to high porosity and low adhesion of Ni–P coating. A compact Ni–P coating with better adhesion and corrosion resistance was explored in this research.
Introduction
Magnesium alloys have been applied in many fields and predicted to be the ‘green engineering material’ in the twenty-first century because of their excellent features.1,2 However, the poor corrosion resistance and wear resistance are challenges to the successful use of magnesium alloys.3,4 Compared with other protective measurements, researchers paid more attention to the electroless nickel–phosphorous (ENP) plating technology because the Ni–P coatings exhibit excellent corrosion resistance, wear resistance, conductibility and electromagnetic shielding.5–7
There are currently two different methods for ENP plating on magnesium alloys, including zinc immersion and direct ENP plating. 8 Nevertheless, the application of zinc immersion is limited as the process is complicated, there is low adhesion coating and the cyanide is harmful to health. 9 On the contrary, the direct ENP plating procedure has the advantages of simplicity and suitability for magnesium alloys with high aluminium content. 8 Acid picking and activation are the key factors in the pretreatment process.10,11 Traditionally, chromates or fluorides are typically used in the pretreatment process. Owing to the highly toxic of chromate and the strongly volatile of corrosive hydrofluoric acid, it is of great importance to develop an environment friendly pretreatment. 12 Our group has proposed a chrome free and low fluoride pretreatment process recently. Namely, it was the procedure of acid picking with phosphoric acid plus a little nitric acid and twice activation with K4P2O7 solution and NH4HF2 solution. This pretreatment process, which can effectively control the quality of coating and improve the efficiency of production, has been successfully applied to the direct ENP plating on Mg alloy AZ91D. 13
Activation, which is a critical step to ENP plating, attracts many domestic and foreign researchers to study the effect on Ni–P coating.14–17 Ambat and Zhou 14 have indicated a strong influence of activation coating microstructure on the performance of Ni–P coating. Liu et al. 15 have proposed the protection mechanism of fluoride by studying the behaviour of activation coating in the ENP bath. Guo et al. 16 have indicated that excessive activation led to the porosity of Ni–P coating. However, the reaction mechanism was not discussed. Xiang et al. 17 have pointed out that the deposition rate of Ni–P coating decreased with the increase in fluoride content on the activation coating. Nevertheless, the fluoride content greatly influenced the initial Ni deposition rate. 18
The object of this research was to investigate the effect of different activations on the initial Ni deposition rate and the performance of Ni–P coating. Based on the process parameters obtained from experiments, the optimum activation process could be determined to effectively control the composition of activation coating. Ultimately, the compact Ni–P coating with high adhesion and good corrosion resistance could be produced.
Experimental
Materials
The specimens are made of die cast AZ91D magnesium alloy and nickel pieces (99·96 wt-%), and the chemical compositions of magnesium alloy are listed in Table 1. The testing specimens were cut into rectangular pieces with the size of 30 × 20 × 3 mm.
Chemical compositions of die cast AZ91D magnesium alloy/wt-%

Electroless nickel–phosphorous plating procedure
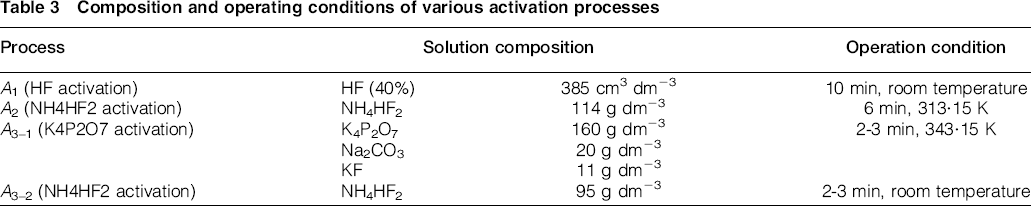
The direct ENP process was operated according to the following flow: mechanically grinding → ultrasonic acetone degreasing → alkaline cleaning → acid pickling → activation → ENP plating (loading, 10 cm3/1 cm2 plating area) and water washing each step. The compositions of the various solutions and operations conditions are shown in Tables 2 and 3.
Compositions of solutions and operating conditions of ENP processes
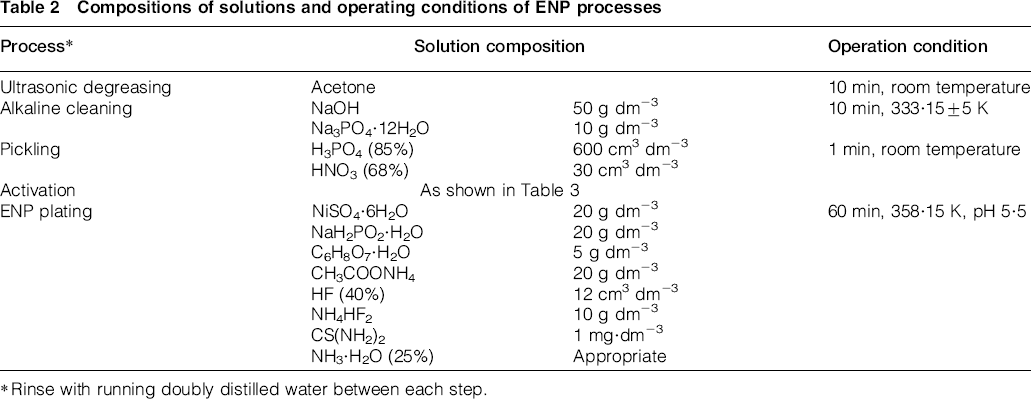
Rinse with running doubly distilled water between each step.
Composition and operating conditions of various activation processes
Testing methods of performance
Initial deposition rate
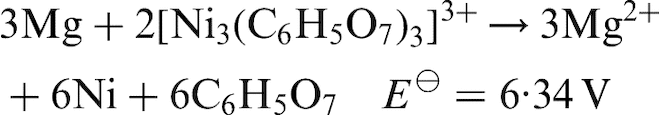
Ren et al. 19 have reported that the growth of Ni–P coating mainly included three stages: I, single Mg–Ni displacement reaction; II, coexistence of Mg–Ni displacement reaction and Ni–P self-catalytic reaction; and III, single Ni–P self-catalytic reaction.
Displacement reaction
20
Self-catalytic reaction
21
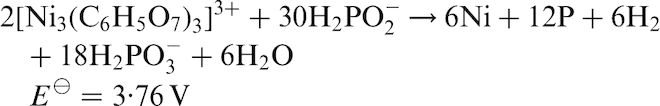
Reaction (1) occupied the dominant location in stage II as a big difference in the standard electromotive force E⊖ between reaction (1) and (2). Thus, the growth of Ni–P coating experienced Mg–Ni displacement reaction and Ni–P self-catalytic reaction two separate reaction stages.
The total plating rate vtotal (μm·h− 1) was calculated from the weight gain Δm1 (g) of the specimen before and after the ENP plating based on equation (3).
22
The self-catalytic deposition rate vself (μm·h− 1) was simulated from mass gain Δm2 (g) of pure nickel specimen deposited in the same plating condition as Mg substrates, calculating according to equation (4)


 (g·cm− 3) is the average mass density of Ni–P coating, using a density of 7·9 g cm− 3 in our calculation; SMg and SNi (cm2) are the specimen area of Mg substrates and nickel substrates respectively; and ttotal (h) and tself (h) are the total plating duration and the self-catalytic reaction duration respectively.
The initial Ni deposition rate vdisp (μm h− 1) was calculated as follows

Coating porosity
The porosity of coating was evaluated with the corrodkote filter paper method. The coated samples could release magnesium ions from the opening holes after immersing in corrodkote solution for 5 min. Then, the samples were immersed in eriothrome black T solution (0·5 g dm− 3) for 3 min. A colour reaction occurred between magnesium ions and eriothrome black T indicator.
23
The samples were immediately posted on a piece of filter paper after finishing immersion. The coating porosity (cm− 2) was characterised by the coloured spots on the filter paper and was quantified according to the following equation
Coating adhesion
Scribe grid testing was adopted to evaluate the adhesion of the coating on the basis of the standard GB/T5270-85. A rigid steel blade in acute angle of 30° was used to score square grids with the length of 1 mm on the coatings, and then the cut squares were torn by adhesive tape (30183, Deli group, China).10,24 The adhesion of the coatings is classified into three grades. ‘ × ’ stands for very poor adhesion and the coatings slough off continuously; ‘Δ’ indicates that a small blister occurs sometimes, but there is no peeling off; and ‘O’ represents good quality plating without blister or peeling off.
Electrochemical tests
Electrochemical tests were carried out using a traditional three-electrode cell consists of a platinum sheet (4 cm2) as counter electrode, a saturated calomel electrode (SCE) as reference electrode and the samples with an exposed area of 1 cm2 as working electrode.
25
The open circuit potential (OCP) of activation coating in the plating bath at the given temperature and the potentiodynamic polarisation curve of Mg substrates with or without coating in 3·5 wt-%NaCl solutions at the room temperature were measured using a workstation (Interface 1000, Gamry Instruments, USA) at a scanning rate of 1 mV s1, and the potential range in potentiodynamic polarisation measurement was − 0·5 to +0·5 V(OCP). The characteristic data of different Ni–P coatings and bare Mg alloy in 3·5 wt-%NaCl solution from the polarisation curves. The Ecorr [V(SCE)], icorr (A cm− 2), ba (mV/dec) and bc (mV/dec) can be obtained from the fitting straight line of the polarisation curves. According to the principle of electrochemical, vcorr (g m− 2 h1) and Rp (Ω cm− 2) can be expressed as follows
Hydrogen evolution method
To evaluate the effect of the Ni–P coatings on the corrosion resistance, a hydrogen evolution method was used to determine corrosion rates of the Mg substrates with or without coating in 3·5 wt-%NaCl solutions. The schematic diagram of the set-up was similar to that of Huo et al.20,26
Surface morphology
Surface morphologies and compositions of the coating formed on Mg substrates were characterised by scanning electron microscopy [SEM, a JSM-5610 matched with an energy dispersive X-ray (EDX) microanalysis system].
Results and discussion
Acid picking and activation
The surface morphologies and compositions of Mg substrates obtained via the pretreatment could significantly influence the quality of Ni–P coating.14–17 Fig. 1 shows the surface morphologies of Mg substrates after different treatments. The acid picking solution is H3PO4 plus a little HNO3. The activations were conducted after the same acid pickling as the above mentioned. Three kinds of activation technology included the following:
A1, activated by HF at room temperature for 10 min A2, activated by NH4HF2 at 313·15 K for 6 min A3, activated by K4P2O7 at 343·15 K for 2-3 min, and then twice activated by NH4HF2 at room temperature for 2-3 min. Surface morphologies of Mg substrates via different treatments
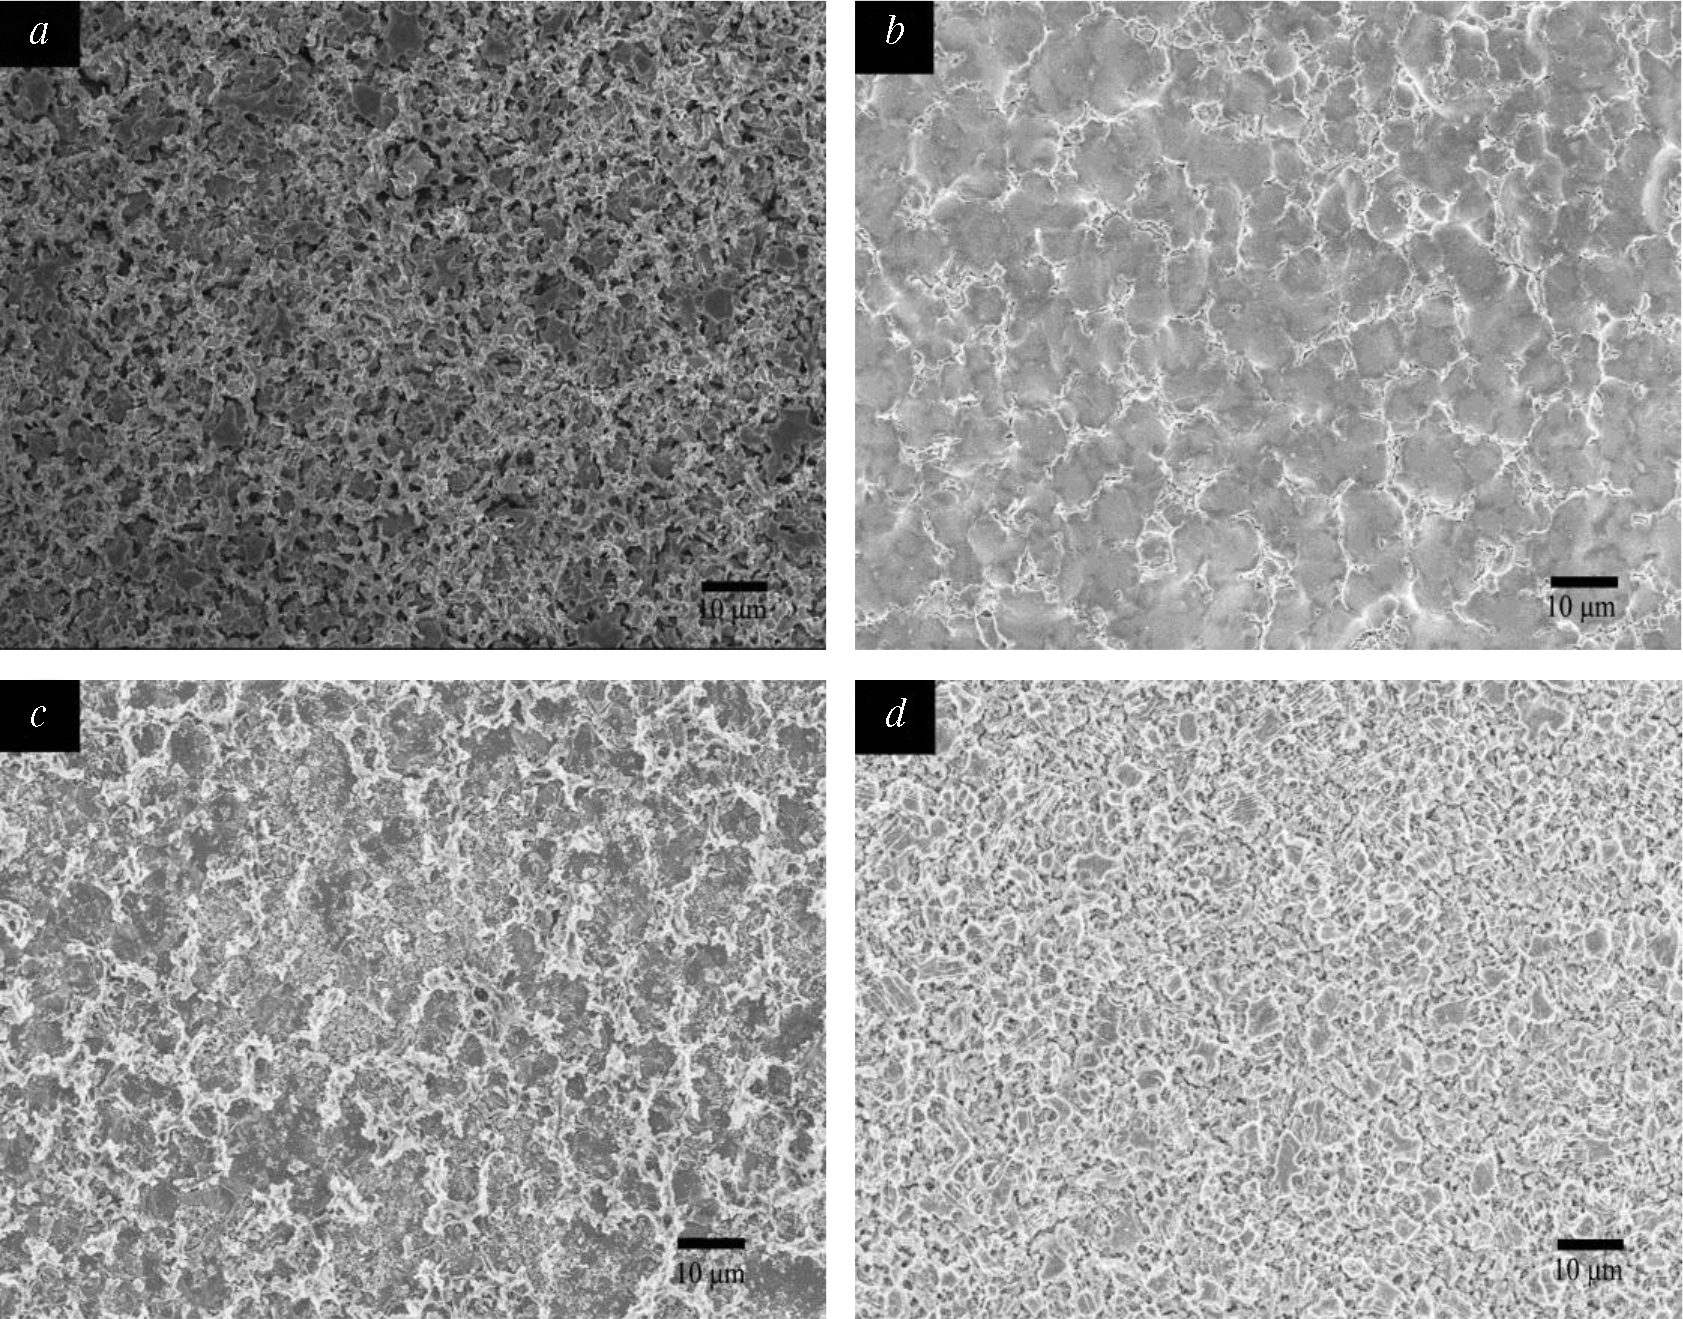
It is clear that the rust scales on Mg substrates not only was fully removed but also had certain microroughness after acid picking treatment in Fig. 1a. The morphology of the sample activated by A1 process in Fig. 1b was tight and smooth, but not uniform. Figure 1c shows that the surface morphology of the sample activated by A2 process was loose and not uniform. However, the surface morphology of the sample activated by A3 process kept microroughness with many deeper cavities and grooves, as shown in Fig. 1d. The coarse substrates would result in better mechanical occlusal force between the Ni–P coating and the Mg substrates.
Table 4 shows the compositions of Mg substrates through three pretreatment processes. It clearly shows that fluoride exists in the films with some oxides on the surface of Mg substrates. Shao et al. 8 proposed that fluoride could prevent Mg substrates from further corrosion, and the oxides acted as active sites in the acidic plating bath. The activation coating with high F/O ratio (at-%) on Mg substrates through A1 activation prevented the substrate effectively from corrosion in the plating bath. The activation coating with low F/O ratio in the film on Mg substrates through A2 activation provided more active sites for nickel deposition. However, the loose Ni–P coating was formed as a rapid reaction between Mg and Ni and the evolution of H2 in the plating bath. Mg substrates through A3 activation produced an activation coating with an optimum F/O ratio. The activation coating with a ratio of 1·12 F/O was obtained through 2 min activating, and with 1·49 F/O ratios after 3 min. This suitable activation coating not only effectively prevented the Mg substrates corrosion but also ensured initial deposition reactivity in plating bath to obtain excellent Ni–P coating.
Elemental composition of activation membrane formed via different activation processes/at-%
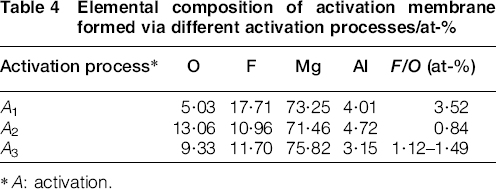
A: activation.
Electroless deposition
The dependence of the OCP of Mg substrates after different pretreatments on time in the plating bath is shown in Fig. 2. It reflected the transition from the aged film dissolution to the fresh film formation on the substrate, as well as the rule of initial nickel deposition.
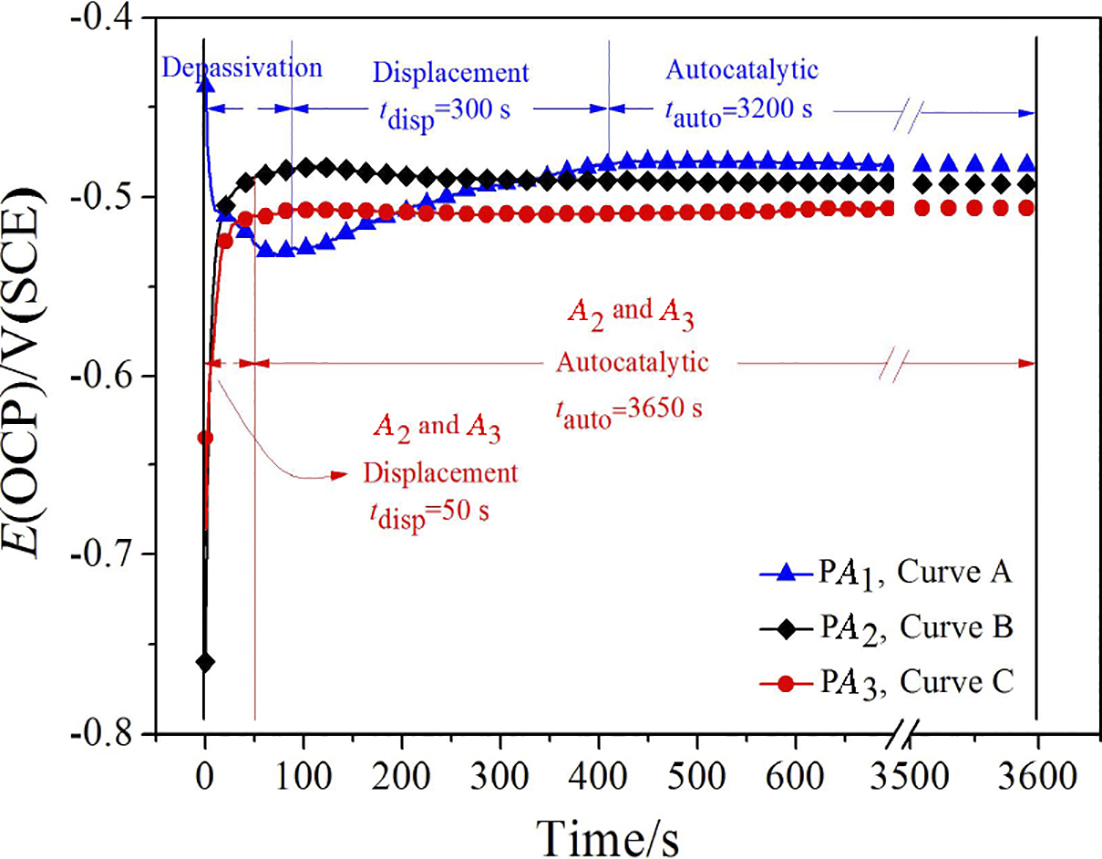
Dependence of OCP of Mg substrates via various pretreatments with time in plating bath
The OCP of Mg substrates through A1 activation decreased first, then increased, finally stabilised at a constant value (see curve A as shown in Fig. 2). This phenomenon could be explained as follows: the reaction of MgO+2H+ → Mg2+ + H2O or Mg(OH)2+2H+ → Mg2++2H2O took place, which undermined the integrity of activation coating and exposed partial Mg substrates. Thus, the OCP decreased from − 0·44 V(SCE) to − 0·53 V(SCE) in 75 s. The typical microstructure of AZ91D magnesium alloys consists of primary α phase [Mg, − 1·82 V(SCE)] and β [Mg17Al12, − 1·23 V(SCE)], as shown in Fig. 3a. Mg released electrons on anode zones and Ni2+ obtained electrons to deposit on cathode zones. Thus, the OCP went up with the increasing nickel deposits. Finally, the OCP was stabilised at − 0·47 V(SCE) when Mg substrate surface was basically covered by nickel, as shown in Fig. 3b.
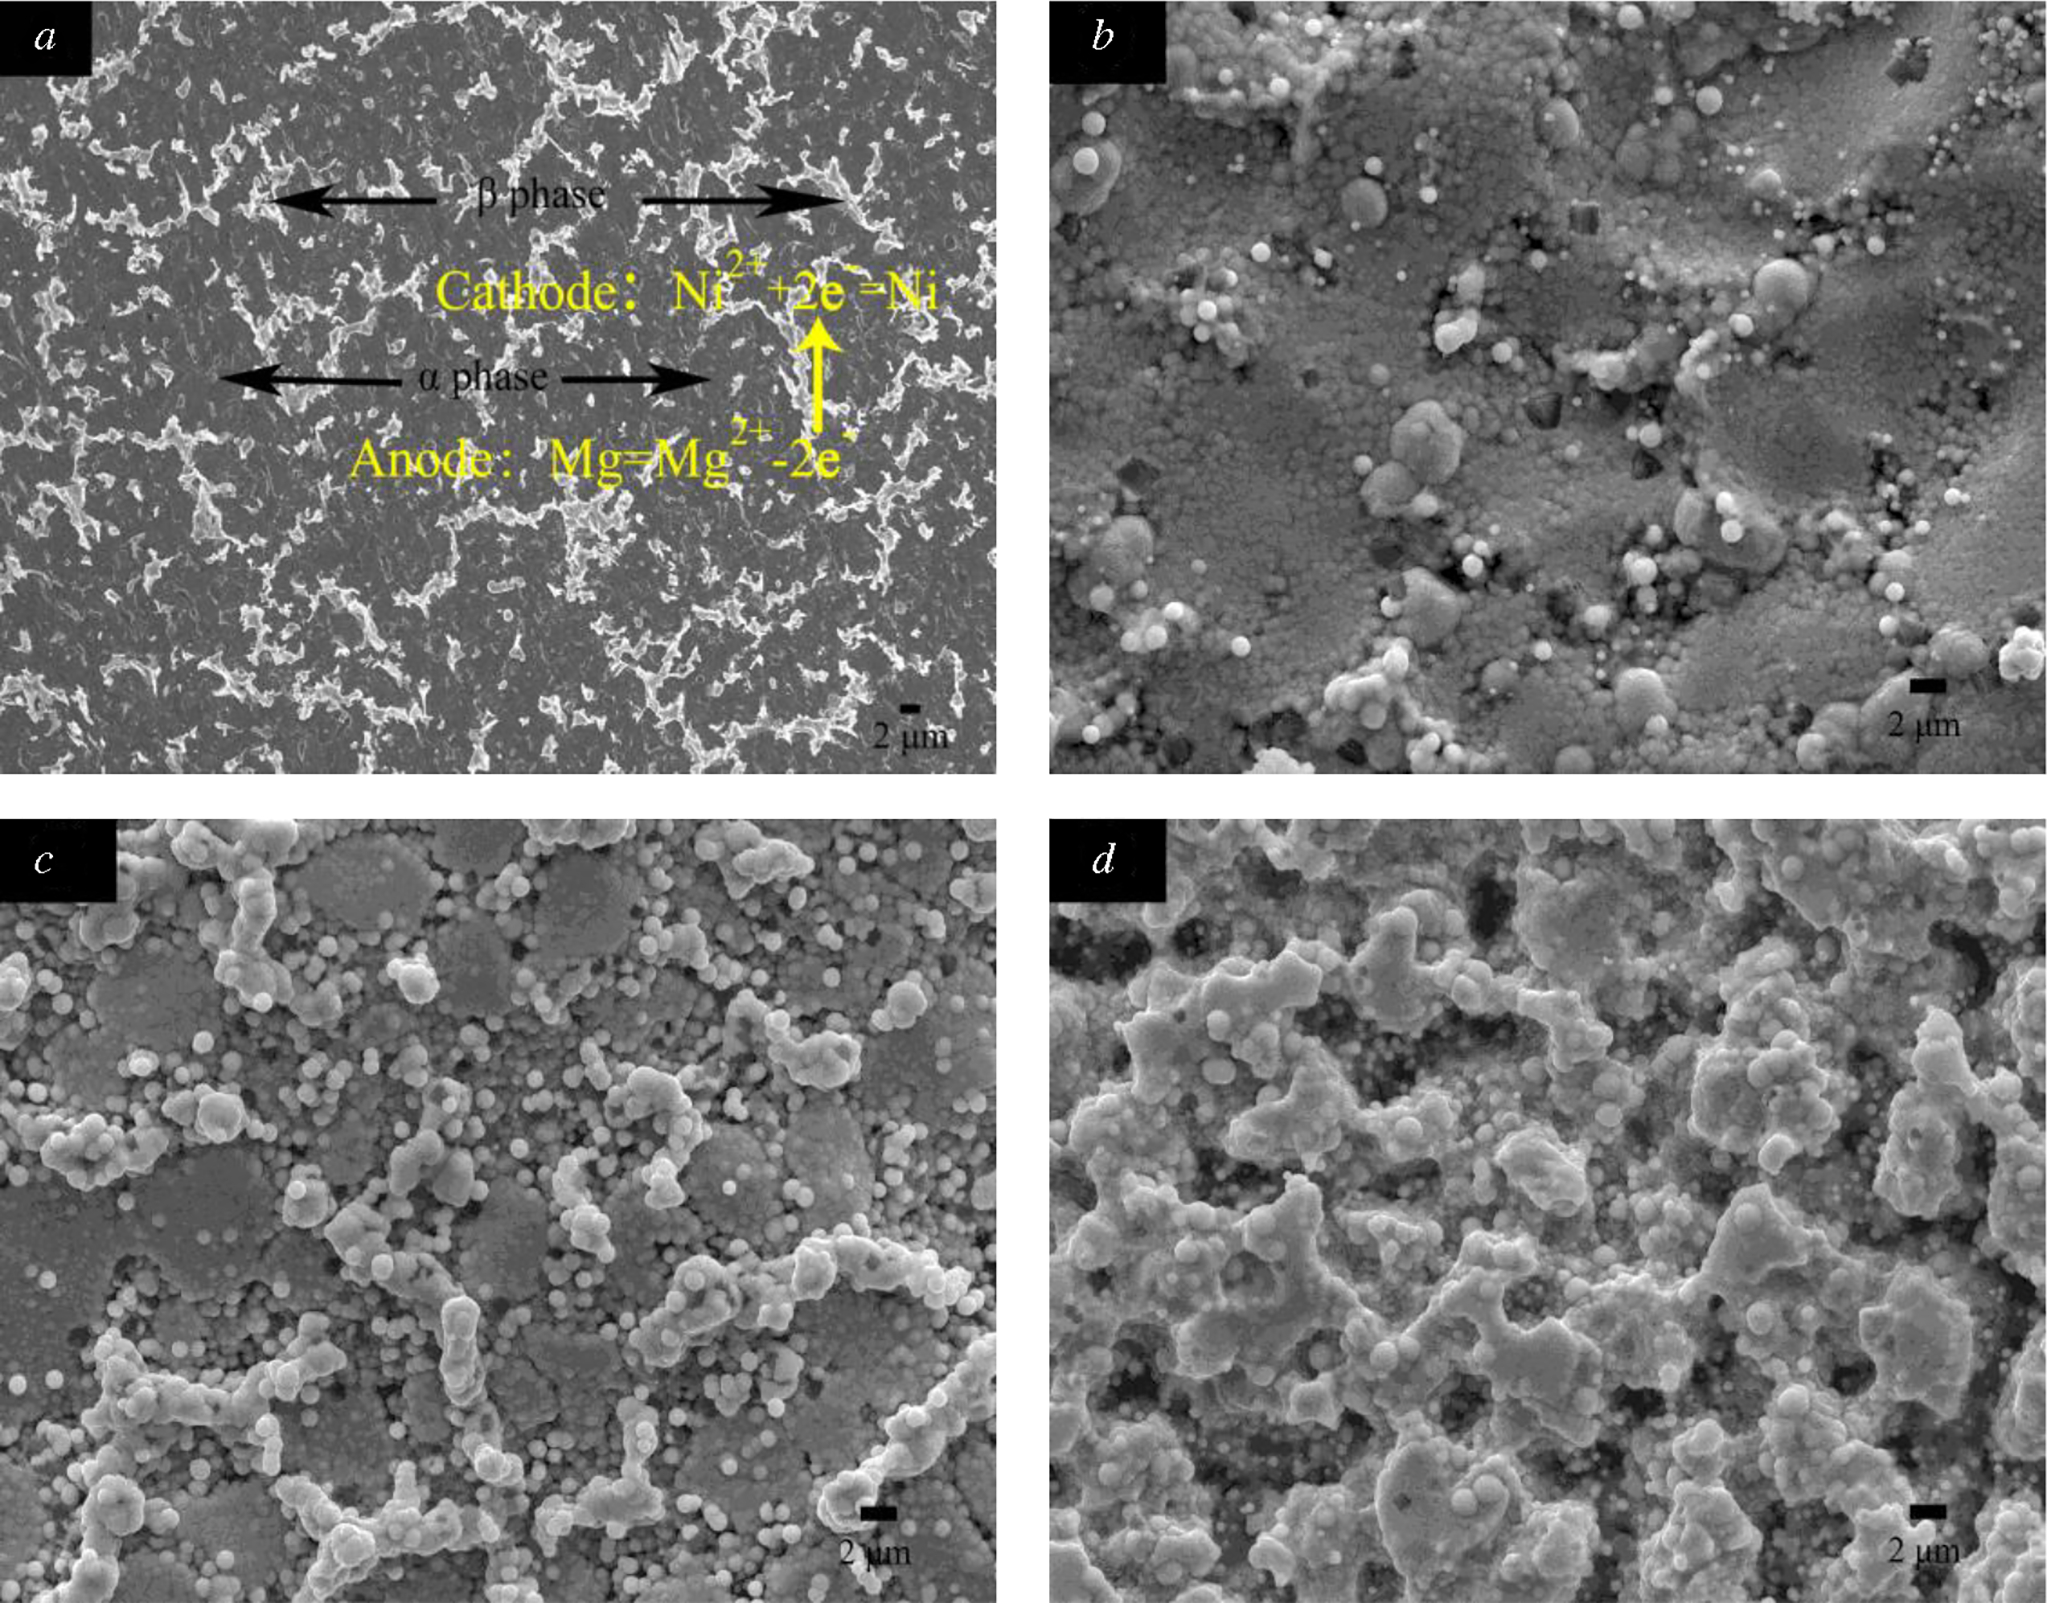
Images (SEM) of various substrates
The OCPs of Mg substrates through A2 and A3 activation are shown in curves B and C of Fig. 2. The OCPs of curves B and C of Fig. 2 first rose rapidly from − 0·76 and − 0·68 V(SCE) since there were more active sites on the substrate surface, then reached steady values of − 0·49 and − 0·51 V(SCE) after 50 s plating due to the fact that Mg substrate surface was basically covered with nickel. The surface morphology of Mg substrate covered with nickel is shown in Fig. 3c and d respectively. In the OCP curves of Fig. 2, the time to reach steady state in curves B and C was much shorter than that in curve A owing to a faster initial Ni deposition rate. The initial Ni deposition rates were 5·151 μm h− 1 by A1 activation for 10 min, 150·897 μm h− 1 by A2 activation for 6 min and 64·589 μm h− 1 by A3 activation for 2·5 min respectively. The difference between OCP values at steady state via various activation processes was still unclear.
The reaction activity for ENP are mainly from the dissolution of MgO or Mg(OH)2 to expose Mg substrates, and Mg was directly displaced with Ni2+ in plating bath. The initial Ni deposition rate depended on the rate of Mg–Ni displacement reaction. The activation coatings produced by A2 and A3 activations with lower ratio of F/O could provide more active sites for nickel initial deposition. Thus, it took a shorter time for the OCP to reach a steady value (see curves B and C of Fig. 2). However, for curve A in Fig. 2, it took a longer time to reach a steady potential value as the activation coating with high F/O ratio was produced by A1 activation.
Performance of Ni–P coatings
Adhesion
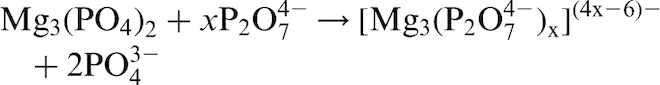
Images (SEM) and EDX compositions of the cross-section of Ni–P coatings obtained via various pretreatments are shown in Fig. 4. The adhesion and porosity of Ni–P coatings obtained by various pretreatments are listed in Table 5. Coatings A–C were Ni–P coating obtained through A1, A2 and A3 activation respectively and then plating. In the growth process of ENP plating, Ni nuclei were first produced and regarded as the active centre of Ni–P deposition, and then the plating process was completed step by step. As Ni–P coating grew in three dimensions, some insoluble matter was probably sandwiched between the Ni–P coating and substrate. The sandwich had a negative impact on the adhesion. The Ni–P coating and substrate combined with osteoporosis as shown in Fig. 4a and c, and the higher phosphorus existed in the sandwich as the red rectangle shown in Fig. 4b and d. Residual phosphorus was from the sealing smut (some pickling products of phosphate). No sandwich coating was produced by A3 activation in Fig. 4e because the K4P2O7 activation in A3 activation could completely remove the phosphate precipitation produced during pickling according to equation (9)
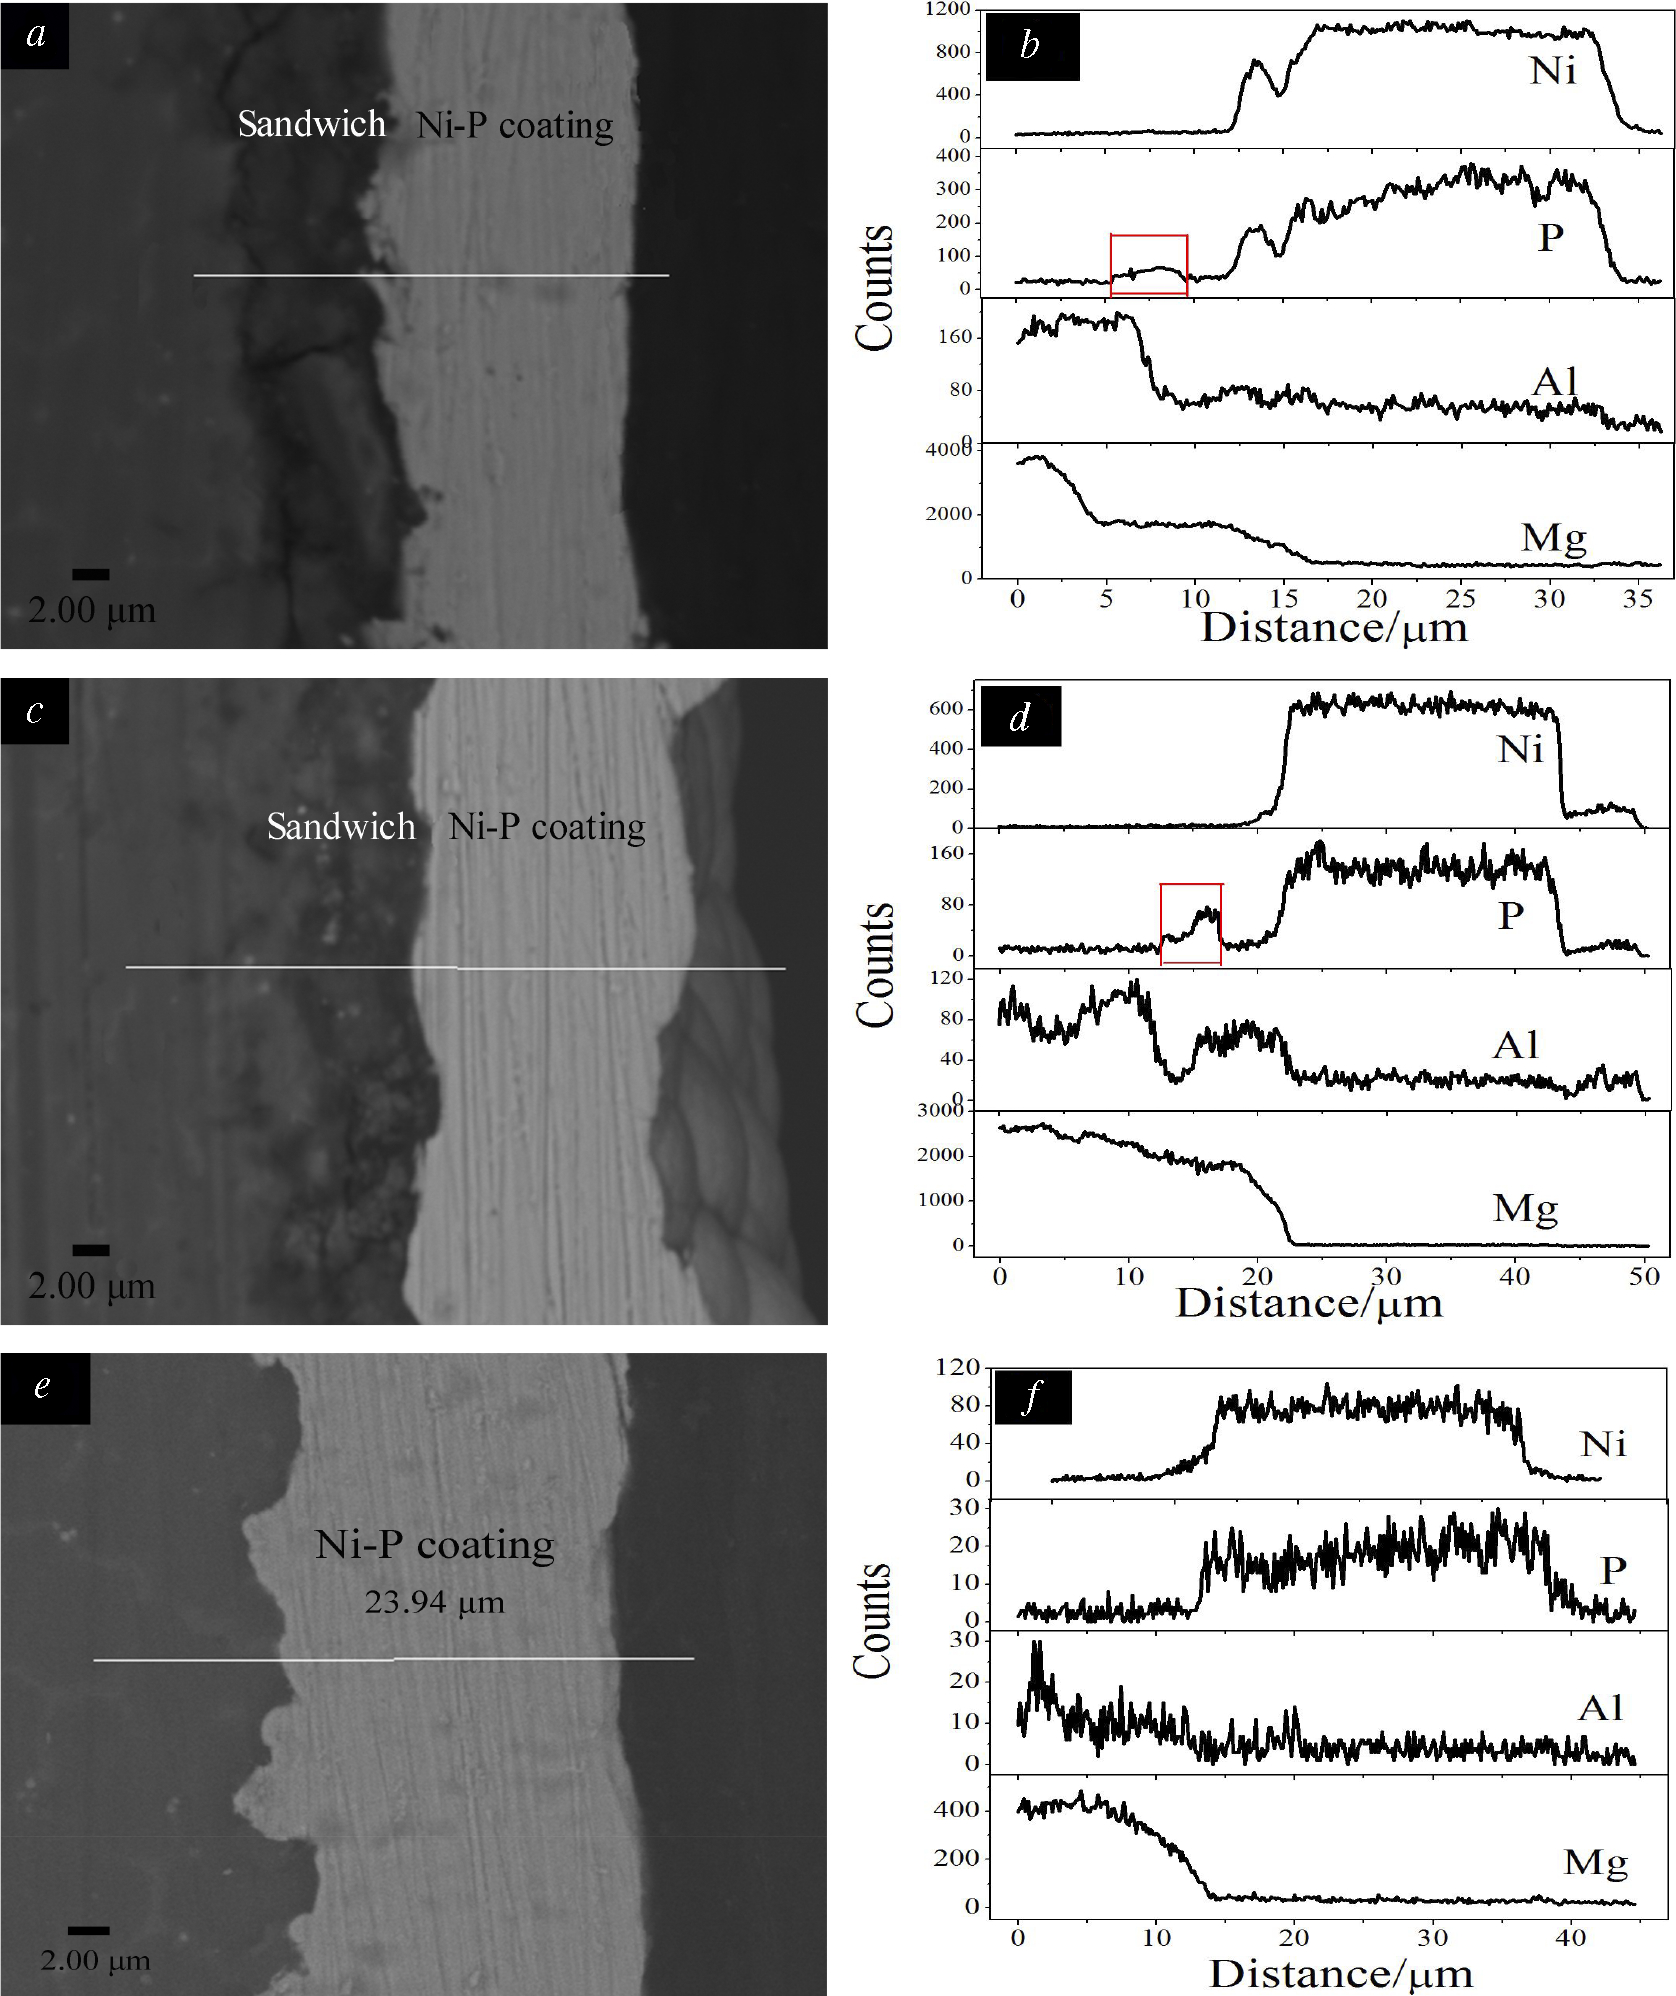
Images (SEM) and EDX compositions of cross-section of Ni–P coatings produced by various processes
Adhesion and porosity of Ni–P coatings obtained by various activation processes
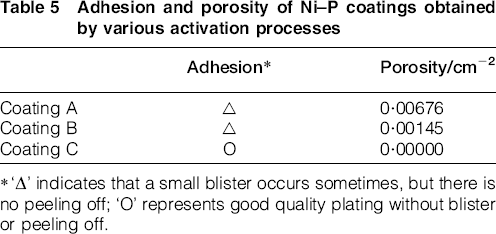
‘Δ’ indicates that a small blister occurs sometimes, but there is no peeling off; ‘O’ represents good quality plating without blister or peeling off.
Fig. 5 shows the schematic of hydrogen bubble behaviour during initial ENP plating. 23 Fig. 5a represents the hydrogen evolution reaction; Fig. 5b and c indicates the effect of hydrogen bubbles on the adhesion and porosity respectively. The surface of Mg substrates treated by A2 activation with low F/O ratio exhibits loose structure and many hydrogen bubbles escaping from the substrates, which impede the deposition of Ni to Mg substrate as shown in Fig. 5b. The adhesion of coating B was slightly lower than the adhesion of coating A.
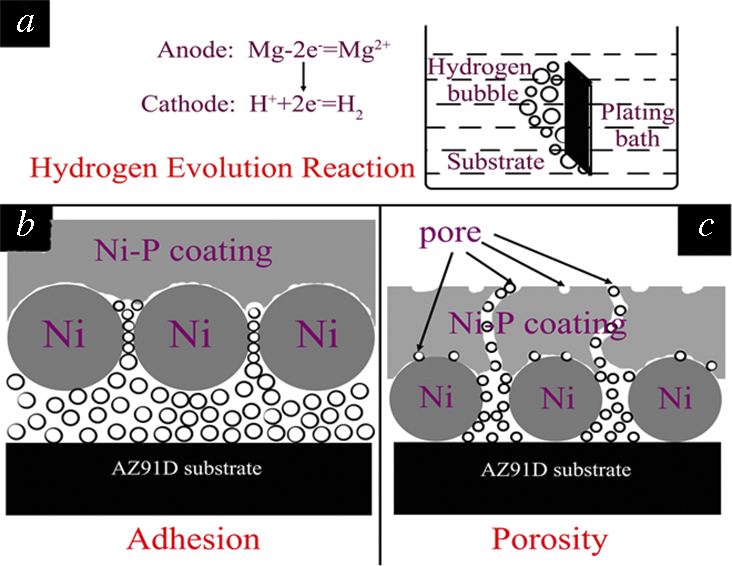
Schematic of hydrogen bubbles behaviour during initial ENP plating
Porosity
The schematic of the three-dimensional growth of Ni nuclei after various pretreatments is shown in Fig. 6. The Ni nuclei with catalytic activity acted as the active centre of Ni–P deposition. The longer spacing of adjacent Ni nuclei dNi was apt to produce porosity of coating. With the increase in F/O ratio in activation coating, the Ni nuclei quantity decreased so that the spacing between adjacent Ni nuclei enlarged. Pinholes were formed on the coating since the growth of Ni–P alloy could not surpass the spacing of adjacent Ni nuclei. 16 From the spacing of adjacent Ni nuclei speaking, the probability of porosity produced on coating A should be biggest and smallest on coating B. The explanation agreed with the results in Table 5. However, a large amount of hydrogen gas would be produced and then converged to airstream on the substrates owing to the high content of MgO or Mg(OH)2 on the surface of Mg substrate via A2 activation. Compared with coating C, more pinholes on coating B were produced due to a large amount of airstream escaping, as shown in Fig. 5c. Therefore, the porosity of coating B was bigger than that of coating C.
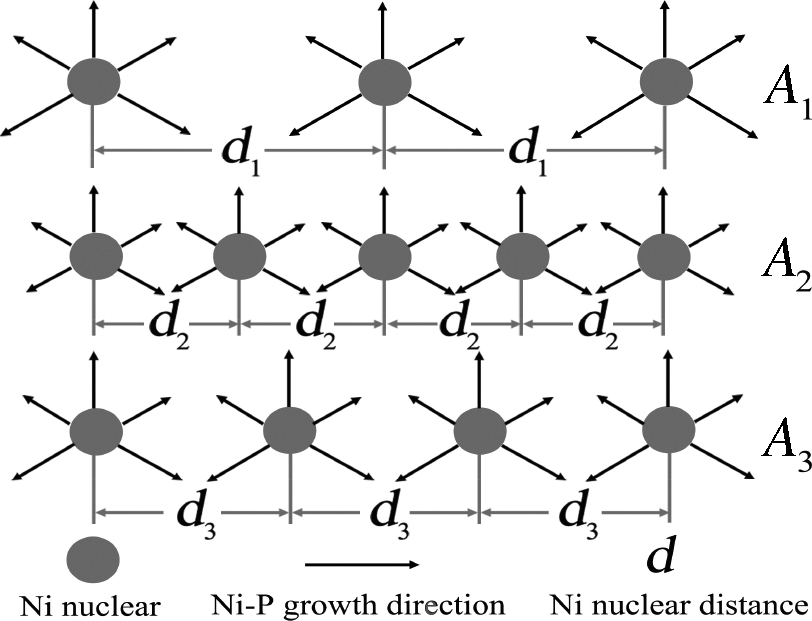
Schematic of cross-section of three-dimensional distribution of Ni nuclei via various activations
Corrosion resistance
Corrosion protection is one of the most important concerns for an electroless Ni–P coating on Mg alloys. In this study, potentiodynamic polarisation and hydrogen evolution method were employed to evaluate the corrosion protection performance of the deposited Ni–P coating following the procedure described in Tables 2 and 3.
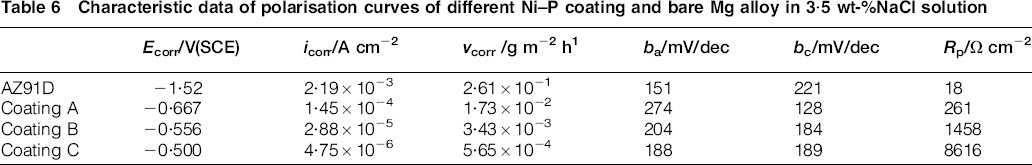
Figures 7 and 8 show the polarisation curves and hydrogen evolution rate of bare Mg alloy with and without different Ni–P coatings in 3·5 wt-% NaCl solution respectively. The values of electrochemical corrosion parameters are shown in Table 6. In contrast with the bare Mg alloy, the maximum value of corrosion potentials Ecorr of Ni–P coating increased by 1·02 V(SCE), and the corrosion current density icorr was decreased by three orders of magnitude (Table 6). The corrosion rate vcorr of coating C was 5·65 × 10− 4 g m− 2 h− 1, which was lower than that of coating A, coating B and bare Mg alloy. As a general rule, a lower corrosion current density corresponds to a lower corrosion rate and a better corrosion resistance. 27 Thus, the compact coating C provides a better protection against corrosion than coatings A and B.
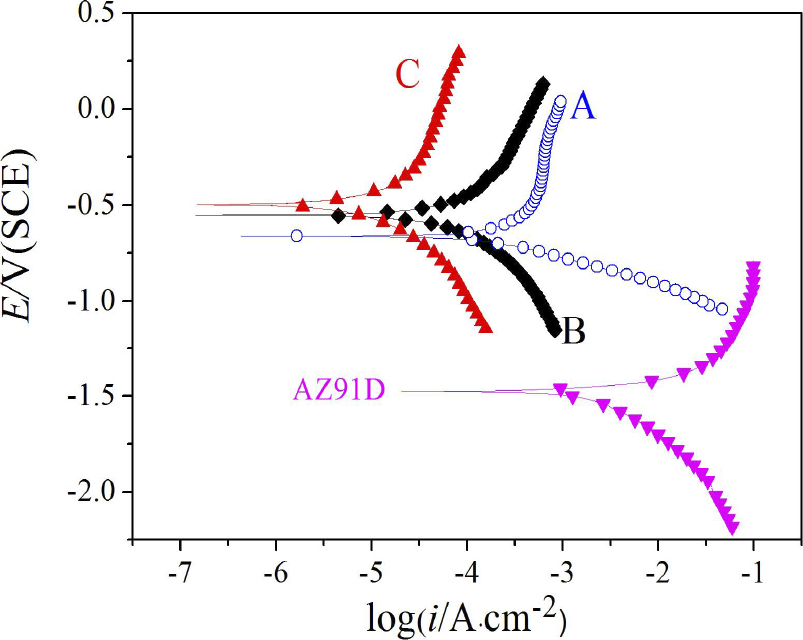
Polarisation curves of bare Mg alloy and Ni–P coatings obtained via various activation treatment in 3·5 wt-%NaCl solution
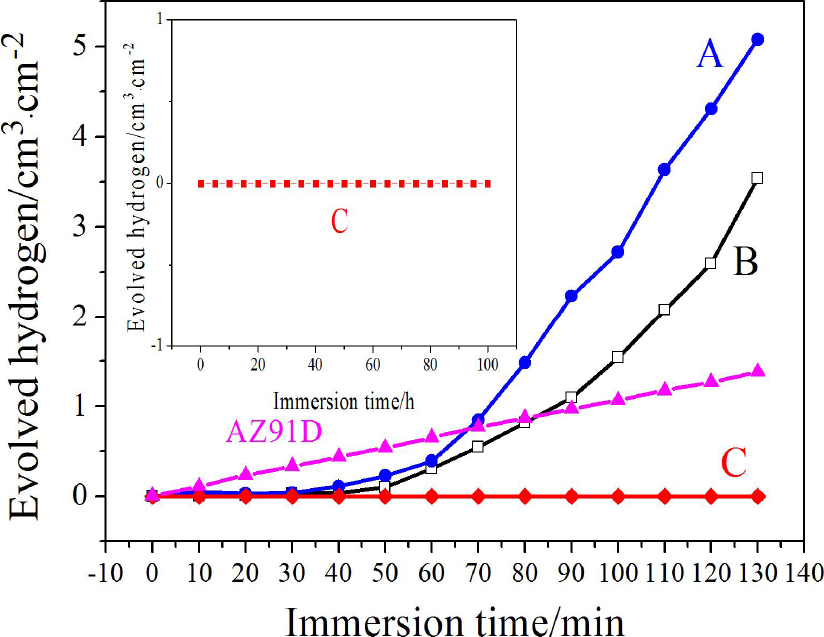
Hydrogen evolution rates of bare Mg alloy and Ni–P coatings obtained via various activation treatment in 3·5 wt-%NaCl solution
Characteristic data of polarisation curves of different Ni–P coating and bare Mg alloy in 3·5 wt-%NaCl solution
In 3·5 wt-%NaCl solution, the violent reaction of hydrogen evolution corrosion took place on the porous coatings and bare Mg substrates. The following reaction equation occurred

According to reaction (10), the amount of substance of the corroded Mg was equal to the amount of substance of the evolved hydrogen gas. Therefore, the corrosion rate of Mg alloy with and without the Ni–P coating could be evaluated with the hydrogen volume per unit time.
The volume of hydrogen evolution for the bare Mg substrates linearly rose with immersion time. The corrosion extent of the bare Mg substrates increased. However, for coatings A and B, there was less hydrogen evolved at the initial stage of immersion, but the volume quickly increased with immersion time. Once the corrosion holes penetrated the coatings and were enlarged, significant galvanic corrosion took place and accelerated the corrosion of Mg substrates. Therefore, the hydrogen volume of coatings A and B exceeded the bare Mg substrates after 70 and 80 min immersion respectively. Nevertheless, hydrogen evolution was not significantly detected on coating C after 100 h of immersion. It was concluded that the coating C was compact with a higher corrosion resistance and could protect the Mg alloy substrate from corrosion in a long run.
Conclusion
A suitable activation process optimised for Mg alloy ENP plating was developed, which was processed with double activations of K4P2O7 and NH4HF2. A compact Ni–P coating with better corrosion resistance and higher adhesion was produced in the ENP plating through double activations. The first activation of K4P2O7 could clean the surface and remove the dust sticking on the Mg substrate after pickling. The adhesion strength between Ni–P coating and Mg substrate was greatly improved without sandwich. The optimum 1·12–1·49 F/O ratio of the activation coating was obtained after second activation with NH4HF2. This activation coating not only prevented Mg substrate from the further corrosion in plating bath but also maintained a suitable initial Ni deposition rate. In initial nickel deposition phase during ENP plating, the hydrogen produced due to the reaction between Mg and H+ increased the porosity of Ni–P coating and reduced the adhesion of the coating.
Acknowledgements
This study is jointly funded by the National Natural Science Foundation (grant no. 21176061) and by the Key Natural Science Foundation (grant no. 12JJ2006) and the Construct Program of Key Disciplines in Hunan Province.