
Abstract
In the present work, AISI 304L steel was used to investigate the effect of surface mechanical attrition treatment (SMAT) parameters on the hardness and microstructure. The surface modified by SMAT was examined using an optical microscope, SEM, electron backscattered diffraction, X-ray diffraction and microhardness measurements. The surface hardness of specimens was more than two times the hardness of non-treated core for all SMAT parameters. High density of shear bands (which formed nanosize rhombic blocks) was observed near the treated specimen surface. Density of shear bands was reliant on the size and number of balls. Deformation induced martensite (α′) was formed in surface mechanical attrition treated region. Volume per cent of α′ was enhanced with an increase in SMAT duration and number of balls. However, it was reduced with an increase in gap between vibrating plate and specimen surface. Microstructure evolution at various SMAT parameters was effectively explained using newly introduced terminology called ‘peening intensity’.
Introduction
Surface mechanical attrition treatment (SMAT) is a type of process in which the surface of the metals is subjected to severe plastic deformation using the impacts of randomly moving balls inside the cabin that causes enhancement in surface properties due to grain refinement.1–5
In austenitic stainless steels, grain refinement up to nanolevel, with or without formation of deformation induced martensite (α′) phase, is observed on the surface due to SMAT.4–10 Chen et al. 5 found 100% martensite in the surface of AISI 304 steel surface mechanical attrition treated for 40 min using 8 mm diameter balls at 50 Hz vibrations. However, 22% martensite was formed in the specimen surface of the same steel, which was surface mechanical attrition treated for 15 min using 3 mm diameter balls at 20 kHz vibrations. 5 A study conducted by Balusamy et al. 8 found ∼60% martensite in the surface of AISI 304 steel specimens surface mechanical attrition treated for 60 min using 2 or 8 mm diameter balls at 50 Hz vibrations. However, the recent work of Chemkhi et al. 9 have reported the grain refinement up to 40–50 nm without any martensite transformation on the surface of AISI 316L steel specimens surface mechanical attrition treated for 30 min using 3 mm diameter balls at 20 kHz vibrations.
Growth of martensite phase and density of deformation twins in the austenitic stainless steel are dependent on the amount of the induced strain and strain rate.5,11 Likewise, the accumulative strain and strain rate decides the resultant microstructure for any particular SMAT duration. In SMAT, the accumulative strain and the induced strain rate are controlled by the various operating parameters, like ball size, number of the balls, gap between vibrating plate and specimen surface, size and shape of vibrating cabin, frequency and amplitude of vibration and SMAT duration. As per our literature review, the role of the interlinking nature of the SMAT parameters on the accumulative strain, microstructure evolution and properties has not been reported previously. In this regard, the main objective of the current study is to provide complete understanding of the role of SMAT duration, ball size, number of balls and the gap between the vibrating plate and specimen surface on a deformation induced microstructure evolution in AISI 304L steel surface. To express the accumulative strain developed in the specimen surface due to the collective action of various SMAT parameters, a new terminology called ‘peening intensity (PI)’ has been introduced in this paper. Peening intensity can be a very useful factor to make sure the uniform peening of sheet metals because it assures supply of uniform strain over the treated surface. Surface mechanical attrition treated surfaces with nanotwinned microstructure can be used for ballistic applications. Surface mechanical attrition treated AISI 304 steel has exhibited 40% smaller deformation along the impact direction as compared to its coarse grained counterpart. 3 Moreover, by properly choosing the PI factor, phase proportion of deformation induced martensite in surface mechanical attrition treated AISI 304 steel surface can be controlled, and such martensite phase can improve the nitriding kinetics. 2
Experimental
Surface mechanical attrition treatment was performed on the AISI 304L steel. The chemical composition (wt-%) of the steel was Fe–0·024C–1·09Mn–18·55Cr–8Ni–0·41Si–0·008S–0·023P. Specimens with dimensions of 15 mm (width) × 70 mm (length) were prepared from 5 mm thick sheet. They were solution annealed at 1050°C for 2 h. These specimens were grinded using silicon carbide papers (up to 1200 grade) and then polished using 1 μm alumina slurry to get mirror polished surface. Specimens were surface mechanical attrition treated at room temperature using in-house fabricated SMAT set-up. Surface mechanical attrition treatment was carried out using hard (65 HRC) bearing steel balls at 100 Hz frequency of vibrating plate. Surface mechanical attrition treatment set-up consisted of cylindrical cabin that was mounted on the vibrating mild steel plate. 4 Specimen was fixed at the top of the cabin with a certain gap from the vibrating plate.
Cross-section of the surface mechanical attrition treated specimens were prepared by grinding, polishing and etching (25 mL HCl+25 mL H2O+4 g CuSO4 for 30 s). Micrographs of such prepared specimens were obtained using optical microscopy and scanning electron microscopy (SEM). Electron backscattered diffraction (EBSD) technique was used to obtain band contrast, phase and inverse pole figure (IPF) maps of the cross-section of surface mechanical attrition treated specimens. Electron backscattered diffraction maps were obtained at 20 kV with 0·3 μm step size. A cross-section of the surface mechanical attrition treated specimens was electropolished using the solution of 20% perchloric acid+80% ethanol with the flow rate of 60 mL min− 1 for 120 s and at the voltage of 11–14 V. Microhardness was measured using 100 g load and dwell time of 10 s. X-ray diffraction (XRD) analysis of the surface mechanical attrition treated specimens was carried out using Cu Kα radiation with a step size 0·033° and 2θ ranges from 30 to 100°. Phase proportions (volume per cent) were calculated using integrated peak intensity and 2θ of XRD pattern.12,13 The deviation/error in the volume per cent of the phases calculated using XRD is believed to be < 3%. 14 The velocity of a single ball of 3 and 8 mm diameter was measured using a high speed camera.
In the current study, frequency of plate vibration (100 Hz), cabin size and cabin shape (cylindrical with the vibrating plate of 80 mm diameter) were kept constant throughout the experiments. However, the number and size of the balls and gap between vibrating plate and specimen surface were used as the variables. The gap was varied by vertical movement of the specimen.
Specimens were surface mechanical attrition treated using various numbers of balls of 3 and 8 mm diameter (Table 1). To make the term ‘number of balls’ most relevant with respect to the size of the cabin, an additional term called ‘percentage of balls’ (i.e. surface area of vibrating plate that was covered by the balls) was used. The number of balls and percentage of balls are linearly related to each other. Nevertheless, for a particular percentage of balls, the number of balls decreased with an increase in the diameter of the balls. Various SMAT parameters under study are summarised in Table 2.
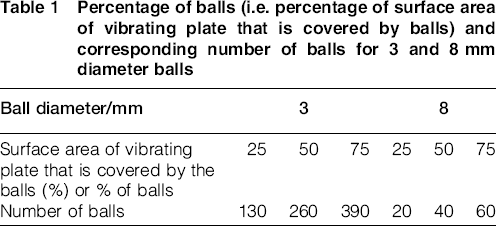
Percentage of balls (i.e. percentage of surface area of vibrating plate that is covered by balls) and corresponding number of balls for 3 and 8 mm diameter balls
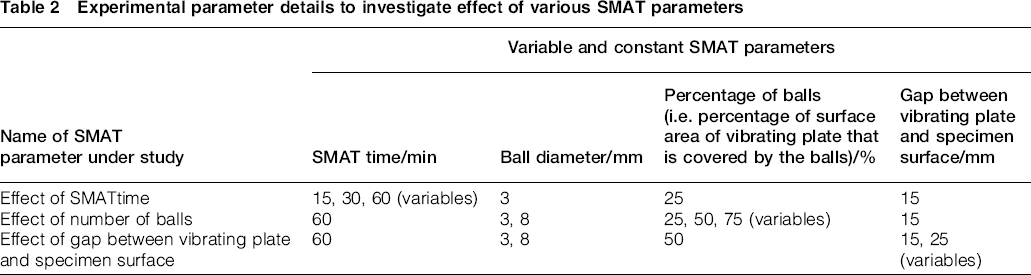
Experimental parameter details to investigate effect of various SMAT parameters
Results
Effect of SMAT duration
Figure 1a shows the microhardness–depth profiles across the cross-section of specimens surface mechanical attrition treated for different durations (Table 2). Hardness profile gradually decreases with depth, and it reaches the non-surface mechanical attrition treated core at 250 μm depth for 15–30 min SMAT duration and 330 μm depth for 60 min SMAT duration. Surface hardness of the surface mechanical attrition treated specimens is more than two times the hardness of non-treated specimen.
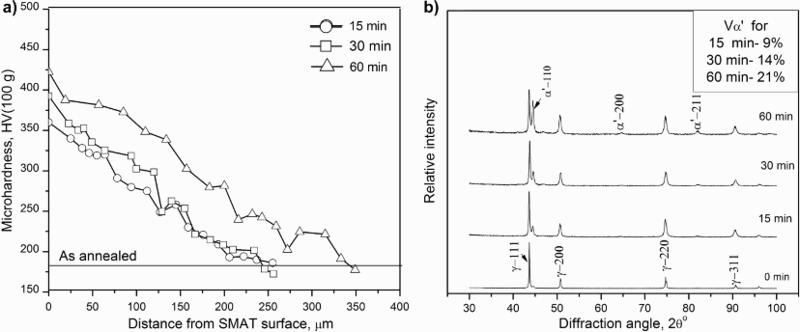
a Microhardness–depth profiles, b X-ray diffraction (XRD) patterns recorded from surface of AISI 304L steel specimens surface mechanical attrition treated for various durations (15, 30 and 60 min) using 25% balls of 3 mm diameter and 15 mm gap; volume per cent of deformation induced martensite (α′) phase formed at specimen surface is also mentioned on XRD patterns
X-ray diffraction pattern of non-treated specimen shows only austenite (γ) peaks (Fig. 1b). However, deformation induced martensite (α′) phase appears distinctively, along with the γ peaks, for all surface mechanical attrition treated specimens. The γ peaks are broader for the surface mechanical attrition treated specimens than for the non-treated specimen, which is attributed to the grain refinement in the specimen surface. The size of the refined grains is quantified using the modified Scherrer formula. 15 The crystallite sizes are 48, 41 and 36 nm for 15, 30 and 60 min of SMAT durations respectively. The proportion of α′ phase has grown from 9 to 21% as the SMAT duration is raised from 15 to 60 min.
Dense shear bands are observed near the specimen surface (Fig. 2). These shear bands are formed on the surface layer to accommodate the plastic deformation induced by the SMAT. 7 The shear bands are present throughout the grains. It appears that an increase in SMAT duration increases the density and intersections of shear bands (which indicates an increase in the extent of accumulative strain in the treated surface/subsurface). Rhombic blocks of nanosize are formed due to the intersection of shear bands (Fig. 2d). These rhombic blocks are equivalent to the nanograins. 16
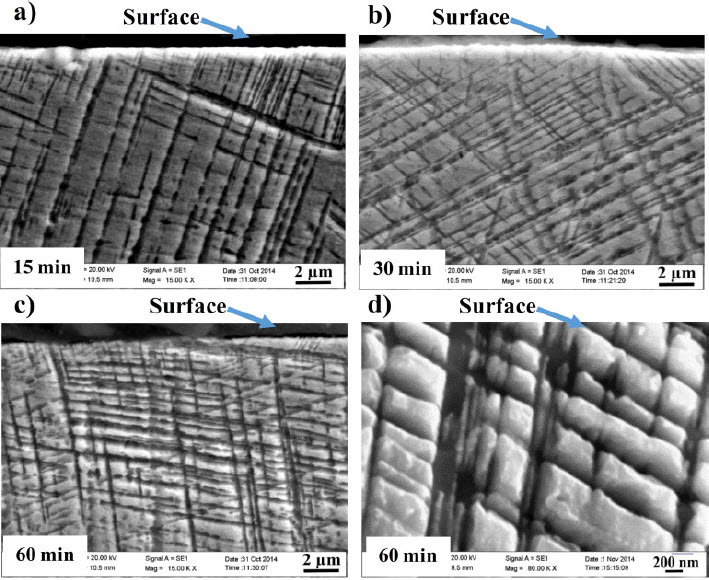
Scanning electron micrographs (SEM) of cross-section of AISI 304L steel specimens surface mechanical attrition treated for various durations using 25% balls of 3 mm diameter and 15 mm gap; SMAT duration is process variable: a 15 min, b 30 min and c 60 min and d SEM image of cross-section (at depth of 5 μm below surface) at high magnification for specimen surface mechanical attrition treated for 60 min using 25% balls of 3 mm diameter and 15 mm gap
Effect of ball size, number of balls (or percentage of balls) and gap between vibrating plate and specimen surface
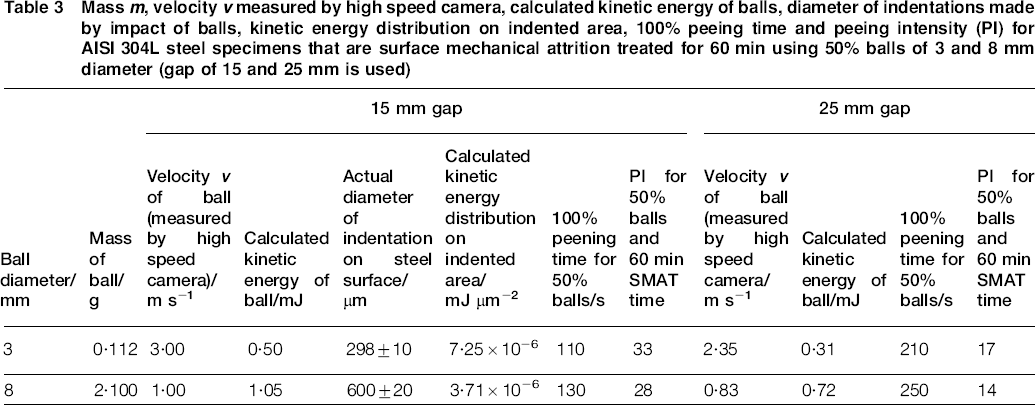
The size of the ball used for SMAT has considerable influence on its velocity, kinetic energy, indentation size (on the specimen surface) and kinetic energy distribution on the indented area (Table 3). Table 3 shows that the velocity of 3 mm diameter ball is three times that of 8 mm diameter ball. However, the kinetic energy of 8 mm diameter ball is about two times that of 3 mm diameter ball. Kinetic energy distribution per unit area of the indentation is ∼50% higher for the 3 mm diameter ball than that for the 8 mm diameter ball. Therefore, it seems that the impact of the 3 mm diameter balls leads to the larger induced strain in the surface mechanical attrition treated surface than that of the 8 mm diameter balls. This is confirmed by the higher shear band density and hardness near the surface of specimen surface mechanical attrition treated with 3 mm diameter balls (see Figs 3 and 4). However, the deeper hardness–depth profile for 8 mm diameter balls is possibly due to their higher kinetic energy.
Mass m, velocity v measured by high speed camera, calculated kinetic energy of balls, diameter of indentations made by impact of balls, kinetic energy distribution on indented area, 100% peeing time and peeing intensity (PI) for AISI 304L steel specimens that are surface mechanical attrition treated for 60 min using 50% balls of 3 and 8 mm diameter (gap of 15 and 25 mm is used)
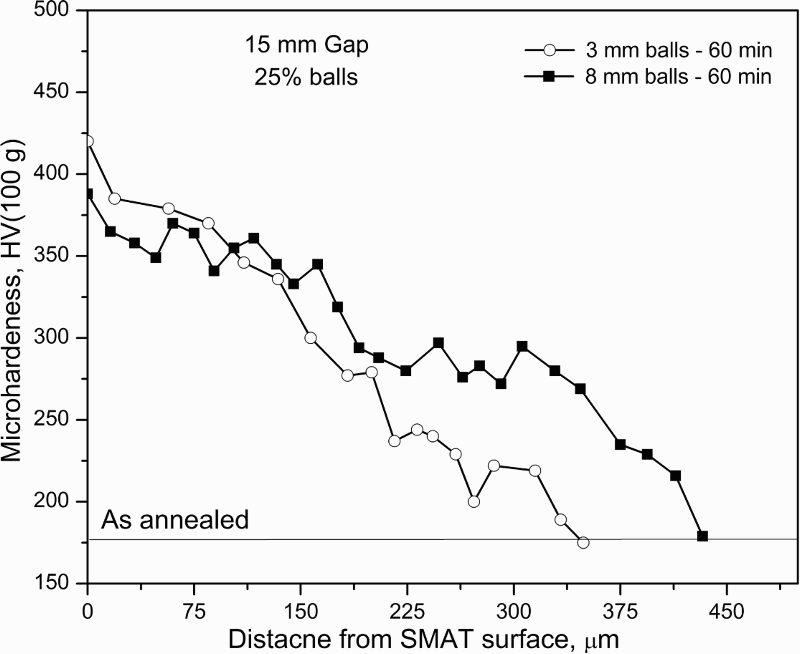
Microhardness–depth profiles along cross-section of AISI 304L steel specimens surface mechanical attrition treated using 3 and 8 mm diameter balls; both specimens are surface mechanical attrition treated for 60 min using 25% balls and 15 mm gap
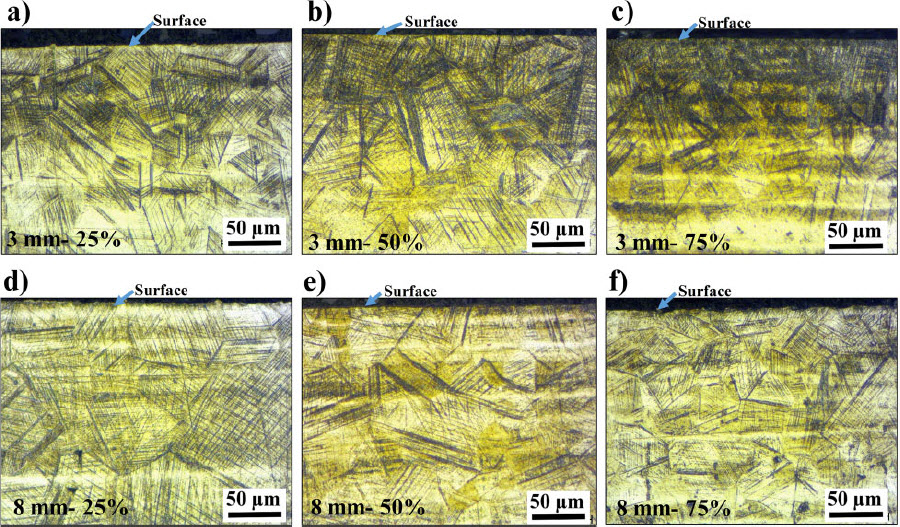
Optical micrographs of cross-section of AISI 304L steel specimens that are surface mechanical attrition treated for 60 min using various percentages of balls of a–c 3 mm and d–f 8 mm diameter balls; percentages of balls are used as process variables: a, d 25%, b, e 50% and c, f 75%; constant gap of 15 mm is used
Optical micrographs of the cross-section of specimens surface mechanical attrition treated using various numbers of balls are shown in Fig. 4. Surface microhardness for 25, 50 and 75% of 3 mm diameter balls are 421, 430 and 441 HV(100 g) respectively. Similarly, surface microhardness for 25, 50 and 75% of 8 mm diameter balls are 400, 420 and 437 HV(100 g) respectively. As shown in Fig. 4, the density of shear bands near the surface mechanical attrition treated surface is increased with increase in the number of balls. This causes increase in the etching darkness (under identical etching conditions) within the surface mechanical attrition treated region with an increase in the number of balls.
Figure 5 shows the EBSD band contrast, phase and IPF maps of the cross-section of specimens surface mechanical attrition treated for 60 min using various percentages (25, 50 and 75%) of 3 mm diameter balls. Shear bands are observed in the near surface region of the specimens. The distribution and locations of α′ phase [which is indexed as the body centered cubic (bcc) iron with a lattice parameter of 2·866 Å] is observed in the phase maps (Fig. 5b, e and h). They indicate that the most of α′ phase is formed inside the grains at the intersection of shear bands and along the shear bands. In addition to this, α′ phase is also observed at the grain boundaries. Substantial change in the density of colours in the grains (in IPF maps) indicates the change in orientation. This change in orientation is possibly to accommodate the applied strain in surface mechanical attrition treated surface. Moreover, IPF map for 75% balls shows higher misorientation within the grains than for 25 and 50% balls. This indicates the heavy deformation of treated surface. Moreover, heavy deformation is evident from the fact that the major portion of phase and IPF maps near the surface mechanical attrition treated surface of the specimens is remained unindexed (which appears as the white coloured spots). 10 Additionally, the step size (0·3 μm) of the EBSD scan could not be small enough to index the fine martensite in microstructure. 17
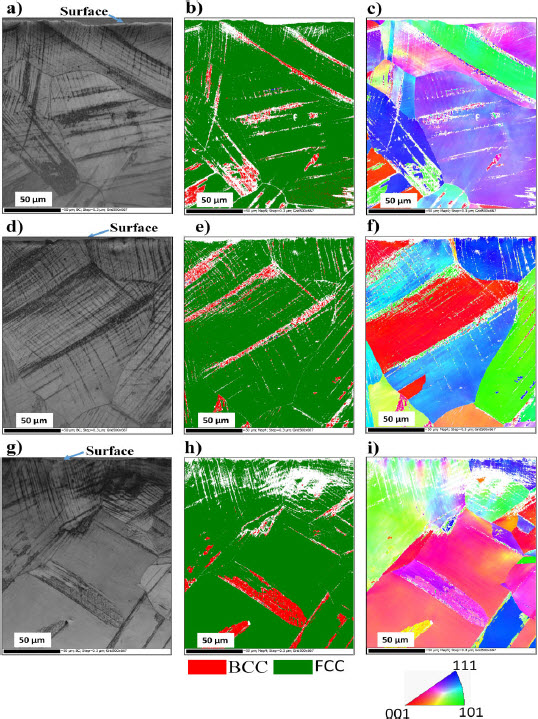
a, d, g electron backscattered diffraction (EBSD) band contrast maps, b, e, h phase maps and c, f, i inverse pole figure (IPF) maps of cross-section of AISI 304L steel specimens surface mechanical attrition treated for 60 min using 3 mm diameter balls, 15 mm gap; here, percentage of balls is process parameter: a–c 25%, d–f 50% and g–i 75%
In Fig. 6a and b, XRD patterns show significant increase in the volume per cent of α′ phase with an increase in the percentage of balls (Fig. 6c).
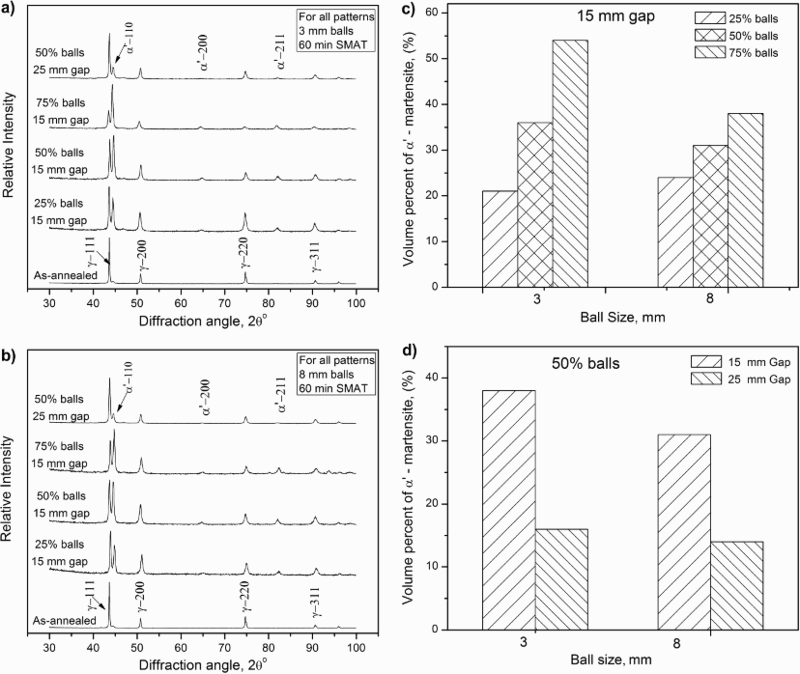
a, b X-ray diffraction (XRD) patterns recorded from surface of AISI 304L steel specimens surface mechanical attrition treated for 60 min using various percentages of balls of 3 and 8 mm diameter respectively and c, d volume per cent of deformation induced martensite (α′) phase for various SMAT parameters; gaps of 15 and 25 mm are used
It is observed that the variation in gap affects the velocity, kinetic energy and PI (PI is discussed in the subsequent section) of the balls (Table 3). The velocity and kinetic energy of the ball are decreased with an increase in the gap. When the gap is increased from 15 to 25 mm, the volume per cent of α′ is reduced from 38 to 16% and 31 to 14% for 3 and 8 mm diameter balls respectively (Fig. 6d).
Peening intensity
‘Coverage’ is the established terminology in shot peening. However, SMAT process is fundamentally different from the shot peening.1,18 Therefore, it is essential to redefine the concept of ‘coverage’ to make it applicable for the SMAT process. As per our knowledge, the current work redefines the ‘coverage’ for the first time for SMAT. In the SMAT process, we called it as PI. Peening intensity quantifies the number of times the projected surface is peened entirely by the attrition balls during the SMAT duration. Peening intensity is a very important terminology (apart from the velocity and kinetic energy of the balls) to compare the amount of strain accumulated at the specimen surface for any SMAT parameters. It is important to note that the term ‘PI’ is not only dependent on the ‘peeing duration or SMAT duration’ but also on the time required for 100% coverage of the specimen surface by indentations (which we called as ‘100% peening time’ in the subsequent text). The 100% peening time (and therefore, PI) is dependent on the ball size, percentage of the balls in SMAT cabin and the gap between vibrating plate and specimen surface. The PI is calculated using the following equation

Figure 7 shows the appearance of peened surface of the specimens at different intervals of the SMAT duration. It is observed that, for 3 mm diameter balls, 100% peening time is 180 s (Fig. 7c), and then, PI is calculated using equation (1). Similar approach is adopted to calculate the PI for other SMAT parameters. Effect of the ball diameter, percentage of balls and SMAT duration on PI are shown in Fig. 8a. It is observed that the PI increases linearly with the SMAT duration for any combination of ball diameter and percentage of balls. Moreover, at the constant SMAT duration and the percentage of balls, the PI decreases with an increase in ball diameter. However, at constant SMAT duration and ball diameter, the PI increases with increase in the percentage of balls. An increase in the gap between the vibrating plate and specimen surface resulted in ∼20% loss in the ball velocity, 32% loss in the kinetic energy of the single ball and, consequently, ∼48% loss in the PI (Table 3).
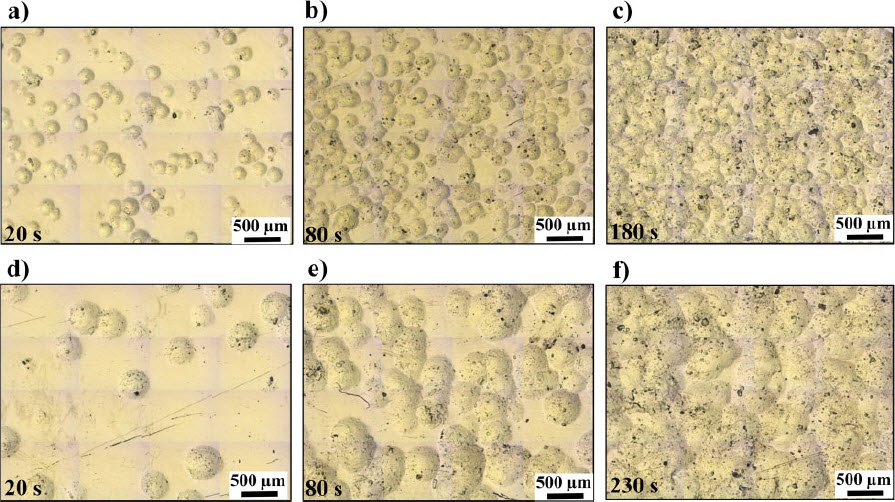
Optical micrographs (without metallographic surface preparation) of surface of AISI 304L steel specimens surface mechanical attrition treated for various durations using 3 and 8 mm diameter balls; micrographs show indentation marks formed by 25% balls of a–c 3 mm and d–f 8 mm diameter; SMAT duration is used as process variable: a, d 20 s, b, e 80 s, c 180 s and f 230 s
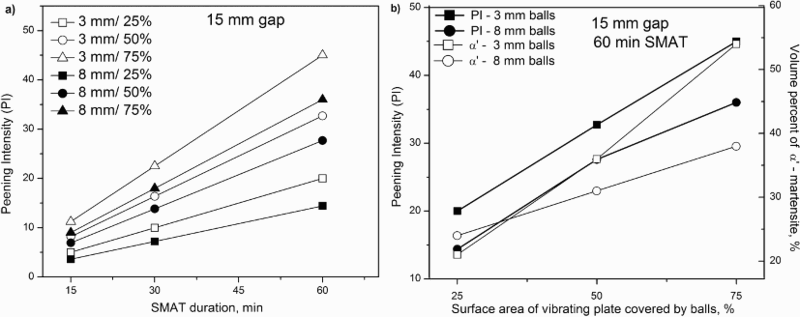
a peening intensity (PI), which is calculated using equation (1), for specimens surface mechanical attrition treated for various durations using various percentages of balls of 3 and 8 mm diameter size and b peening intensity (PI) and volume per cent of α′ phase at surface of AISI 304L steel specimens surface mechanical attrition treated for 60 min using various percentages of balls of 3 and 8 mm diameter; constant gap of 15 mm is used
Discussion
Surface mechanical attrition treatment duration, ball size, number of balls, percentage of balls and gap between vibrating plate and specimen surface
Surface mechanical attrition treatment causes the formation of mechanical twins near the specimen surface.5,7 The formation of mechanical twins is associated with the change in orientation of crystal without changing its original phase. This is confirmed in IPF maps in Fig. 5, and therefore, the deformation/shear bands near the specimen surface are the mechanical twins.
Volume per cent of α′ phase in austenitic stainless steel increases with an increase in the applied strain and decrease in the strain–rate. 19 With increase in the SMAT duration, PI is increased from 5 to 20 (Fig. 8a), which suggests the considerable increase in the accumulative strain to the treated surface. Increase in the density and the intersection of the mechanical twins (Fig. 2a–c) with SMAT duration facilitates the nucleation and growth of α′. Therefore, longer SMAT duration enhances the formation of α′.
The size of a ball influences its impact velocity and kinetic energy. Table 3 shows that 8 mm diameter ball has lower velocity, but higher kinetic energy, than 3 mm diameter ball. As per Ref. 5, during SMAT, 3 and 8 mm diameter balls generate the strain rate of about 103–105 s− 1 and 103–104 s− 1 respectively in the top layer of the austenitic stainless steel. These strain–rates are considerably high. Apart from the ball size, the stain rate is also affected by the number of balls and their percentage. If the diameter of a certain percentage of balls is reduced, the number of balls increases (Table 1). Another possibility is that, for a particular diameter of the ball, the number of balls increases if the percentage of balls is increased (Table 1). In any case, collision between the balls increases as the number of balls increases. This collision could be more pronounced for a higher percentage of balls as compared to the lower percentage of balls (say, 25% in the current work) because the vacant space available in the SMAT cabin is reduced with increase in the percentage of balls. Collision between the balls can reduce the average velocity of the balls present in the SMAT cabin, and therefore, the induced strain rate at the specimen surface is reduced.
For a particular percentage of balls, PI increases with decrease in the ball diameter (Fig. 8a). Similarly, PI increases with an increase in the percentage of balls. In these both situations, increase in PI is directly linked with the increase in the number of balls. In case of the smaller diameter balls (3 versus 8 mm), apart from the rise in the number of balls, considerably higher velocity of the balls (3 m s− 1 for 3 mm versus 1 m s− 1 for 8 mm diameter balls: see Table 3) is the additional factor for higher PI (for example, with 25% balls, 3 mm diameter balls causes 28% more peening of the specimen surface than the 8 mm diameter balls in 60 min). Increase in PI is associated with the increase in the accumulative strain, which is confirmed by the increase in the density of shear bands near the specimen surface with an increase in the number of balls (Figs 4 and 5). Increase in the volume per cent of α′ phase with an increase in the percentage of balls and decrease in the diameter of balls (Fig. 6c) is due to the higher accumulative strain at the specimen surface.
Gap between the vibrating plate and specimen surface has a substantial effect on PI and, subsequently, on the volume percent of α′ phase (Fig. 6d). The probable reason for the decrease in the PI with increment in the gap is the increase in collision between the balls (the rise in gap gives ample space for the balls in the SMAT cabin to travel in the random directions) and, therefore, lesser number of balls could reach and impact the specimen surface for a particular SMAT duration. Decrease in the PI (i.e. decrease in the induced strain) due to increase in the gap is responsible for the decrease in the quantity of α′ phase.
Mechanism of α′ transformation in SMAT process
Deformation induced martensite (α′) formation in austenitic stainless steel is dependent on the strain and strain rate. In SMAT, these two are affected by the interlinked SMAT parameters. Increase in the density and intersection of the mechanical twins is associated with an increase in accumulative strain in the specimen surface during SMAT. Such twins facilitate the nucleation and growth of α′. The amount of accumulative strain in the specimen surface during SMAT is strongly related to the PI. Figure 8b shows that, except for 25% balls, increase in the volume per cent of α′ phase for both the sizes of balls (3 and 8 mm diameters) is closely linked with the increase in PI. More collision between the balls with an increase in the number of balls (especially, for the higher percentage of balls, where the availability of vacant space in the SMAT cabin is limited) can reduce the velocity of balls and, hence, the strain rate. Therefore, reduction in the strain rate can also contribute (apart from the rise in PI) towards the growth of volume per cent of α′ phase with an increase in the number of balls. However, at the low number of balls, strain rate is the dominating factor (rather than the strain). At the lower percentage of balls (say, 25% in the present work), the volume per cent of α′ phase is somewhat lower (even though PI is higher) for 3 mm diameter balls (21% α′) than for 8 mm diameter balls (24% α′) even though PI is higher for 3 mm diameter balls. When the number of balls is less, collision between the balls is lesser (more vacant space is available in the SMAT cabin), and therefore, strain rate is higher for smaller diameter balls. An adiabatic heating associated with the high strain rate deformation can suppress the formation of α′ phase. 19
Conclusion
For all SMAT conditions, the surface hardness of the specimens was more than two times the hardness of solution annealed non-treated AISI 304L steel. The width of the hardness profile was increased with increase in the SMAT duration. At constant SMAT duration, lower diameter balls resulted in the higher density of mechanical twins in the surface and smaller width of the hardness profile. In surface mechanical attrition treated specimens, deformation induced martensite (α′) phase was observed along the shear bands, near the grain boundaries and within the grains where mechanical twins were intersected. Proportion of α′ phase in the treated surface was increased with increase in the SMAT duration and the number of balls. However, it was decreased with increase in the gap between vibrating plate and specimen surface. New terminology called PI was introduced to describe the behaviour of specimens at various SMAT parameters. Peening intensity represented the interlinking nature of the various SMAT parameters. It was related to the quantity of accumulative strain at the specimen surface. Peening intensity was a very effective factor in describing the microstructure evolution during SMAT as a collective action of the operating parameters. Increase or decrease in the proportion of α′ phase and extent of grain refinement, for various interlinked SMAT parameters, were closely associated with the increase or decrease in PI.
Footnotes
Acknowledgements
We would like to thank Dr R. Kadam of Kalyani Centre for Technology and Innovation, Bharat Forge Ltd, Pune, India, for his cooperation in SEM and EBSD experiments. We are thankful to Professor K. Chattopadhyay and Professor S. Suwas (both at the Department of Materials Engineering, Indian Institute of Science, Bangalore, India) for their cooperation and discussion in the project. Support of the Networking Resource Centre for Materials (NRC-M), a scheme of University Grants Commission (UGC), India, is kindly acknowledged. One of the authors, Mr A. Gatey, would like to thank Bharat Forge Ltd for providing scholarship to do his PhD on the related topic. We would like to thank Professor S. Mali (Sinhgad Institute of Management, Kondhwa, Pune) for editing the English language in the manuscript.