
Abstract
Cr–Ni–N coatings, the Ni content of which was altered from 0 to 6·3 at-%, were deposited by a hybrid coating system consisting of high power impulse magnetron sputtering and radio frequency magnetron sputtering. The effects of Ni addition to Cr-N coatings on the microstructure and mechanical properties of the coatings were investigated in this study. The instrumental analysis revealed that the Ni element was incorporated into Cr-N crystals as solid solutions, while excess Ni was precipitated as nanocrystalline phases at the Cr-N grain boundaries. The toughness of the Cr–Ni–N coatings was significantly improved with Ni content increased. In addition, the hardness of the coatings slightly increased from 30·4 to 32·6 GPa due to the grain refinement effect and solid solution hardening. From the tribological tests, the highest wear resistance was obtained from the sample having a Ni content of 2·7 at-%.
Introduction
In the past decades, hard coatings have been extensively studied due to their excellent properties of high hardness, good chemical and thermal stability and high wear resistance. 1 In the industry application, hard coatings can significantly increase the life time of machining tools, improve productivity of high cost automatic machineries and decrease the coolant which is harmful to environment. 2
Hard coatings have been synthesised by several techniques including Direct current(DC)and radio frequency (RF)magnetron sputtering, plasma enhanced chemical vapour de position and cathodic arc deposition.3-8 Recently, a novel physical vapour deposition technique named high power impulse magnetron sputtering (HiPIMS) has attracted significant intention for deposition of hard coatings. By sputtering the target with high power (e.g. 1–3 kW, cm−2) short duration (< 200 ms) pulses, the sputtered species can be highly ionised, without significant target heating. 9 High power impulse magnetron sputtering has shown several merits over conventional sputtering, such as good adhesion and increased film density, as well as some advantages over the cathodic arc deposition, e.g. free from macroparticles and smooth surface. Especially, due to the high ionisation rate, the ad-atom mobility and reactivity at low temperatures can be much improved.5,9 These advantages make the HiPIMS technique desirable for synthesising hard coatings.
As one member of the transition metal nitride hard coatings, binary CrN coatings have been widely used for cutting tools and punching moulds due to their relatively high hardness, good wear resistance and superior resistance to high temperature oxidation.3,4 However, without toughness improvement, the life time of the CrN coatings can be restricted due to the propagation of cracks and abrasive wear at harsh working conditions. For longer life time and stability, many researches have been carried out to increase the toughness of the nitride hard coatings and improve the resistance to brittle fracture. Zhang et al. 10 selected Ni as the toughening agent to add to Ti-Si-N coating system, and the results showed that the toughness of coatings was improved by increasing Ni content. Akbari et al. 11 achieved a threefold increase in the critical load for crack formation by adding Ni, while retaining hardness >25 GPa, in their Ti-Ni-N coatings. Moreover, more recently, Wo et al. 12 synthesised Cr–Ni–N coatings by a closed field unbalanced magnetron sputtering ion plating and enhanced toughness of CrN coatings by Ni addition was also observed by nanoindentation and TEM analysis. Previous studies mainly focus on the effect of Ni addition on the toughness of the CrN coatings, but the existing status of Ni in the coatings, the nucleation mechanism of Ni in the CrN crystals and the influence of toughening by the Ni addition on the mechanical and tribological properties are still not well understood and need to be further investigated.
In this work, Cr–Ni–N coatings were deposited on Si wafer and SUS304 substrates using a hybrid coating system consisting of HiPIMS and RF magnetron sputtering (RFMS) in a reactive gas mixture of nitrogen and argon. The Ni content in the coatings was altered by adjusting the RF power on Ni target. The chemical bonding status and existing status of Ni in the coatings were studied by X-ray photoelectron spectroscopy (XPS) and TEM analysis. The effects of Ni content on the microstructure, toughness, mechanical properties and tribological properties of the coatings were investigated. The nucleation mechanism of Ni in the Cr–Ni–N coatings was also discussed.
Experimental
Deposition of Cr–Ni–N coatings
The Si (100) wafers and stainless steel (SUS 304) substrates were ultrasonicallycleaned in acetone and ethyl alcoholfor 20 min,blowndry by pure nitrogen respectively and fixed at a rotating sample holder,which was located atthe centre of the vacuum chamber with 100 mm distance from the targets. Before the deposition, the chamber was evacuated to <1·0 × 10−3 Pa using a rotary and turbo molecular pump and heated up to 300 C. To improve the adhesion of the coatings, ion bombardment on the substrates was conducted for 5 min by the HiPIMS power (HiPIMS+, Hauzer Techno Coatings BV) using a Cr target (99·99%), and a Cr layer was deposited for 3 min on the substrates as the adhesive layer. The Cr–Ni–N coatings were deposited in a reactive gas mixture of nitrogen and argon (N2:Ar=1:1) by a hybrid coating system combining a HiPIMS power and a RFMS power (13·56 MHz, YSR-06AF, YOUNGSIN-RF. CO. Ltd) from Cr target (by HiPIMS) and Ni target (99·95%, by RFMS). The working pressure was maintained at 4·7 × 10−1 Pa, and the DC bias voltage was kept at –100 V. The Ni content in the coatings was altered by adjusting the RF power from 0 to 100 W, while the HiPIMS power was fixed at 800 W. The film thickness was controlled at 〜2 μm by adjusting the deposition time. No apparent microarcs were observed during the deposition process.
Characterisations of Cr–Ni–N coatings>
The chemical compositions were characterised by the electron probe microanalyser (EPMA 1600, Shimadzu, Cr: CAMECA company, 100% Cr standard; N: CAMECA company, 56·44% N in BN standard; Ni: CAMECA company, 100% Ni standard; O: CAMECA company, 53·26% O in SiO2 standard.). The crystal structure of the coatings was investigated by an X-ray diffractometer (XRD; D8-Discovery Brucker, Cu Kα, 40 kV, 40 mA). Diffraction patterns were characterised from 20 to 80 . Relevant XRD analysis was performed by the operational mode of sample tilting diffraction (STD; i.e. Bragg reflection measurement in the θ-2θ mode, θ axis offset by 3) to avoid the signals of the single crystalline Si substrate. 13 This method has been proven to produce correct XRD results as the conventional Bragg-Brentano mode for the case of coatings on single crystalline substrates. 14 , 15 The selected coatings were observed using a field emission transmission electron microscope (Cs corrected STEM, JEOL, JEM-ARM200F) with an acceleration voltage of 200 kV. X-ray photoelectron spectroscopy (VG Scientifics ESC-ALAB250) was used to analyse the chemical bonding status of the Cr–Ni–N coatings. The XPS spectra were obtained after removing the surface contamination layer of the samples by in situ sputtering with Ar+ ions (3 keV) for 30 s, and were calibrated to the carbon peak C 1s at 284·6 eV. For qualitative evaluation of toughness, the scratch tests were carried out by a scratch tester (J&L tech, Scratchtester) under varied load from 0·01 to 50N. After implementing of scratch tests, we looked into the occurrence of cracks at the end of the edge on the scratch track by scanning electron microscope (SEM, Hitachi, S4800, 15 kV). The hardness and elastic modulus of the coatings were investigated by a nanoindenter (Hysitron, TI 950 TriboIndentor). A threesided Berkovich diamond tip (elastic modulus E = 1140 GPa and Poission ratio v = 0·07), having a tip radius of 100 nm, was used for the indentation tests. A trapezoidal load function (maximum indentation depths were 70 nm) was used, and the unload curve analysis was performed to determine the hardness of coatings, according to the Oliver and Pharr analysis method. 16 , 17 Twenty-five indentations were performed for each sample to obtain the averaged hardness and elastic modulus values. The wear tests were conducted by a ball on disc wear tester (J&L tech, Tribotester) under 1N load. SiC coated balls with 6 mm radius are equipped as counterpart material. After the wear tests, we investigated alteration of the wear track as a function of various Ni content using SEM.
Results and discussion
Chemical composition and crystallinity of Cr–Ni–N coatings
Figure 1 shows the chemical composition of the Cr–Ni–N coatings as a function of the Ni target power measured by EMPA. All the coatings exhibited excess N content over CrN stoichiometry (Cr:N = 1:1). He et al.
18
and Bertoti et al.
19
reported that the gas flow ratio of nitrogen and argon (FN2/FAr could substantially affect the composition of the CrN coatings. It was considered that the relatively high FN2/FAr ratio (1:1) lead to the formation of the coatings with over stoichiometric N content. As the Ni target power increased from 0 to 100 W, the Ni content in the Cr–Ni–N coatings presented a nearly linear increase from 0 to 6·3 at-%, while the Cr and N content decreased simultaneously. Tiny amount of oxygen was incorporated into the Cr–Ni–N coatings during deposition with concentrations under 0·66 %.
Chemical composition of Cr–Ni–N coatings as function of RF power from 0 to 100 W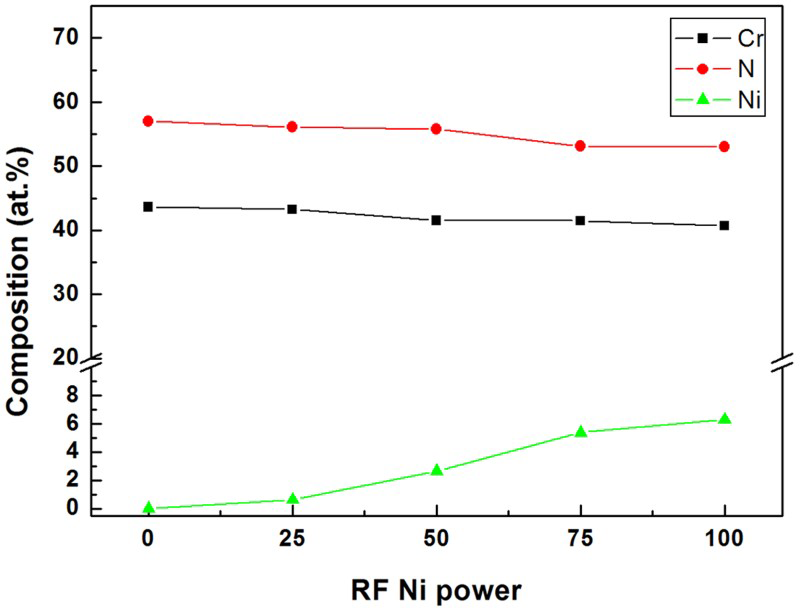
Figure 2a and b show the XRD patterns and average grain size of the Cr–Ni–N coating as a function of Ni content respectively. From the diffraction pattern of the pure Cr-N coating, typical peaks corresponding to face centred cubic (FCC) structured CrN phase can be identified. 16 A slight shift to lower angle can be seen for the Cr–Ni–N coatings, which can be attributed to the formation of solid solutions. It can be easily seen that the intensity of the main peaks significantly decreased as Ni content increased over 2·7 at-%, while no obvious Ni peaks were observed for all the coatings. It was considered that the Ni atoms existed in the coatings as three possible forms. (i) Ni atoms were incorporated in CrN crystals as solid solu tions. Zhang et al. 8 reported that the Ni atoms formed as solid solutions inCrN crystals at room temperature. (ii) Ni atoms existed at the CrN grain boundaries as amorphous phase. Zhang et al. 10 reported the Ni atoms existed as amorphous phase with SiNx at the TiN grain boundaries in the Ti–Si–N coating system. (iii) Ni existed at the CrN grain boundaries as nano crystals. 20
The average grain size of the coatings is usually determined by the broadening of the Bragg reflection in XRD using Scherrer's formula. Since the random strain in the coatings also contributes to the broadening, the Scherrer's formula with the full width at half maximum is subject to large errors.
17
Therefore, the Williamson-Hall plot, which can effectively separate the contributions of the crystallite size and strain, was used for the current study.
21
Average grain size of the as deposited Cr–Ni–N coatings is shown in Fig. 2b. The grain size of the coatings decreased from 197·5 to 98 nm as the Ni content increased from 0 to 6·3 at-%. These results further indicated that as Ni content increased over 2·7 at-%, the Ni atoms gathered at the CrN grain boundaries and blocked the lager grain growth during the deposition process, leading to grain size refinement effect.
a X-ray diffraction patterns and b average grain size of Cr–Ni–N coatings as function of Ni content respectively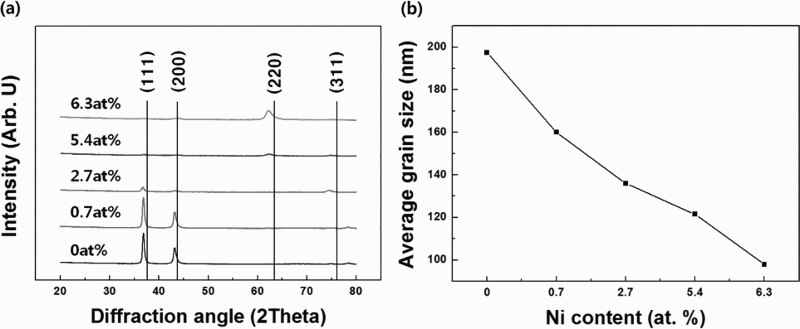
Chemical bonding status and microstructure of Cr–Ni–N coatings
To further investigate the existing status of Ni atoms in the Cr–Ni–N coatings, the chemical bonding status and microstructure of the coatings were investigated by XPS and TEM respectively. Figure 3a and b demonstrates the XPS spectra taken in the Cr 2p and N 1s energy regions for the Cr-N coating. Typical peaks corresponding to the CrN binding energy were observed at 574·3 eV in Cr 2p spectra and 396·6 eV in N 1s spectra respectively.22,23 The asymmetry of the Cr 2p3/2 peak was caused by the Cr2O3 phase due to contamination of small amount of oxygen. Figure 3c to e shows the XPS spectra of Cr–Ni–N coating with Ni content of 5·4 at-% in the energy regions of Cr 2p, Ni 2p and N1s. The Cr 2p spectra were similar to those of the Cr-N coating, while the binding energy peak corresponding to Cr2N phase was observed at 576·1 eV.
22
Meanwhile, the binding energy peak corresponding to CqN phase at 397·7 eV (reference value is 397·4 eV
22
) was observed in the N1s spectra, which also confirmed the existence of Cr2N phase in the coatings. As shown in Fig. 3
e, binding energy peak corresponding to Ni-Ni was observed at 853·0 eV in the Ni 2p spectra.
23
The slight shift was probably caused by the formation of Ni solid solutions in the CrN or Cr2N lattice. Apart from a small fraction of Ni as solid solutions, most of the Ni atoms exist in the status of metallic component.
X-ray photoelectron spectroscopy spectra taken in energy regions of a Cr2p and b N1s for Cr-N coating and in energy regions of c Cr2p, d N1s and e Ni2p for Cr–Ni–N coating with Ni content of 5·4 at-% respectively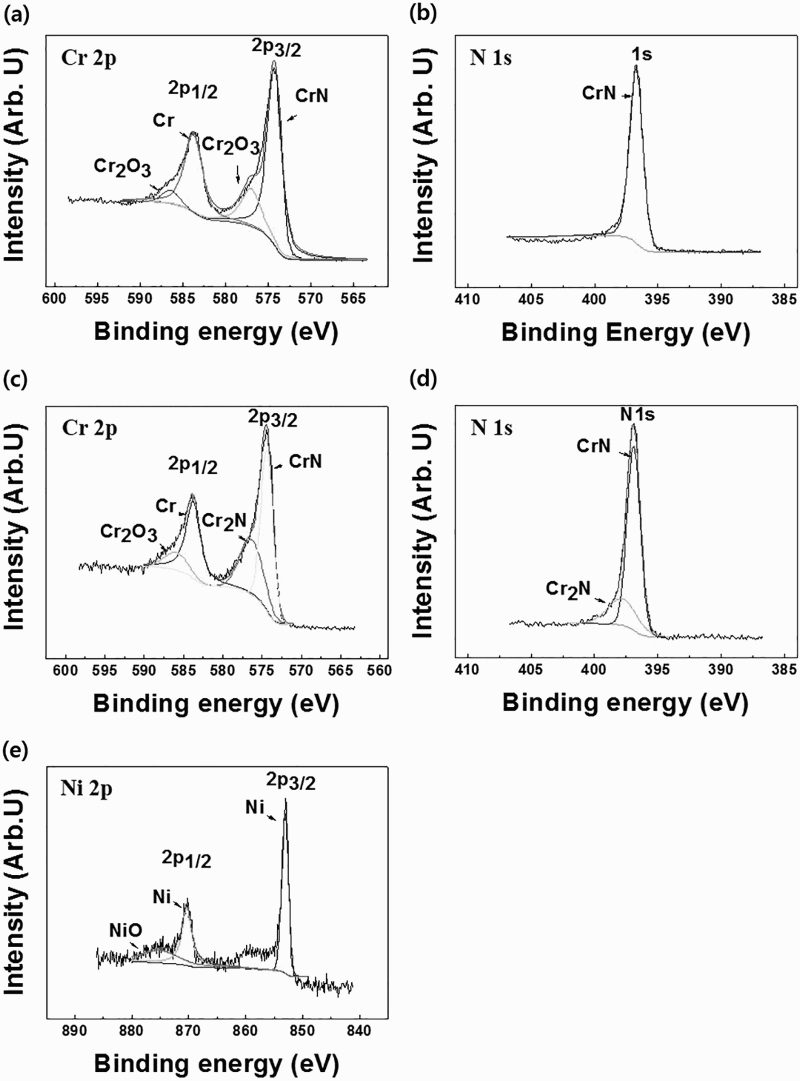
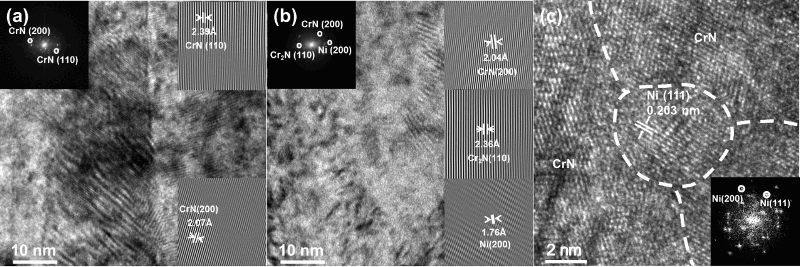
Figure 4 shows the dark field images and selected area electron diffraction (SAED) patterns of the pure Cr-N coating and the Cr–Ni–N coating with Ni content of 5·4 at-% by TEM analysis respectively. Typical columnar structures can be seen in the dark field images of both coatings, and the Cr–Ni–N coating with Ni content of 5·4 at-% possesses denser microstructure than that of the pure Cr-N coating. The SAED pattern altered from dot pattern to ring pattern by Ni addition, indicating that the grain size decreased and the amount of fine grains with random orientations increased by Ni addition, which is in good agreement with Fig. 2. (111), (200) and (220) planes of the FCC-CrN phase were identified from the SAED patterns, indicating that the main phase of both coatings were FCC-CrN phase. Figure 5 shows the cross-sectional high resolution TEM (HR-TEM) images, corresponding fast Fourier transform (FFT) images and their inverse fast Fourier transform images from selected FFT patterns of pure Cr-N coating and the Cr–Ni–N coating with Ni content of 5·4 at-% respectively. From Fig. 5a, the CrN (111) plane with d value of 2·39À and the CrN (200) plane with d value of 2·07Α were confirmed from JCPDS-#762494. As for the Cr–Ni–N coating in Fig. 5b, CrN (200) plane with d value of 2·04Å and CqN (110) plane with d value of 2·36Å were confirmed from JCPDS-#762494 and JCPDS-#792159. The d value decrease in CrN (200) plane from standard 2·07 to 2·04Å in this study was attributed to contraction of CrN lattice due to smaller Ni atoms substituting of Cr atoms as solid solutions, which was mentioned in the former section. Meanwhile, the FFT pattern corresponding to Ni (200) plane with d value of 1·76Å (JCPDS-#870712) was observed. As shown in Fig. 5
c, nanosized Ni crystal formed at the CrN grain boundaries with (111) plane (d value is 2·03Å) and (200) plane (d value is 1·76Å) being identified from the HR-TEM images and corresponding local FFT images. By considering above results, it can be confirmed that the main phase of the Cr-N and Cr–Ni–N coatings was FCC-CrN phase with existing of small amount of Cr2N phase, and that the Ni element was partially incorporated in CrN crystals as solid solutions while the excess Ni atoms was precipitated at the CrN grain boundaries.
a,c cross-sectional dark field TEM images and b,d SAED patterns of a,b Cr-N coating and c,d Cr–Ni–N coating with Ni content of 5·4 at-% Cross-sectional HR-TEM images, corresponding FFT and inverse FFT images of pure a Cr-N coating and b,c Cr–Ni–N coating with Ni content of 5·4 at-% respectively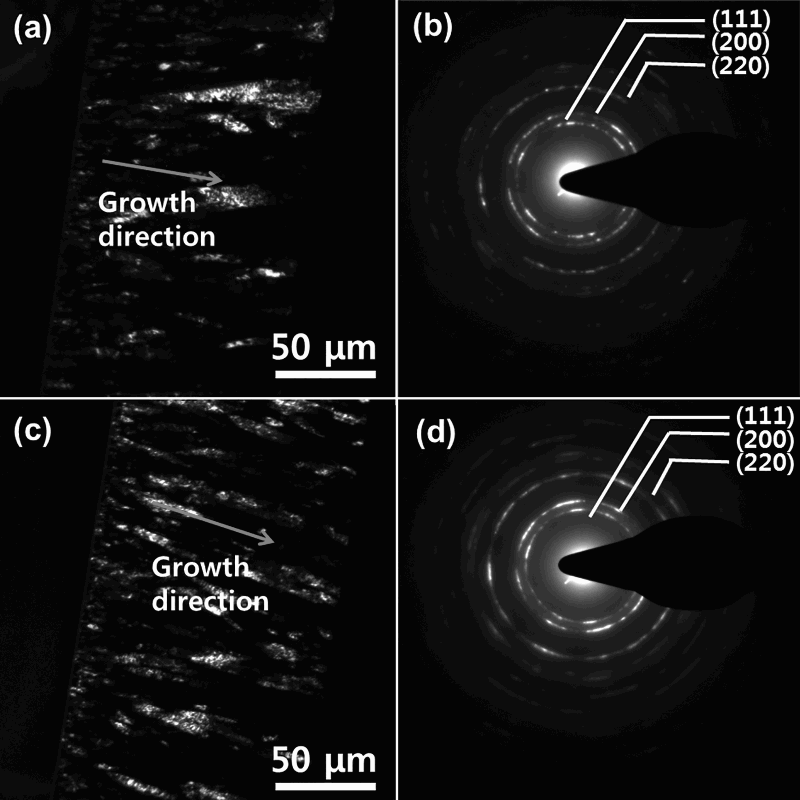
In this study, small amount of Ni atoms was incorporated as solid solutions into CrN crystals at the initial growth stage of CrN grains, while the excess Ni precipitated at the CrN grain boundaries in two possible forms: (i) nanocrystals or (ii) matrix surrounding CrN grains. Owing to the interface energy between metallic Ni phase and CrN phase is higher than that between CrN phase and CrN phase, to minimise the interface energy in the coatings, the excess Ni atoms possessed strong tendency to preferentially grow in the island growth mode and form Ni crystals on the nucleation sites of the CrN grains rather than the layer growth mode to be the matrix covering the surface of CrN grains. 24 Therefore, the excess Ni exists in the form of nanocrystals precipitating at the CrN crystal boundaries.
Toughness, mechanical and tribological properties of Cr–Ni–N coatings
Figure 6 shows the edge images of the scratch track of the Cr–Ni–N coatings with Ni content of 0, 2·7 and 6·3 at-% by SEM respectively. From Fig. 6a, plenty of cracks occurred due to both the compressive and shear stress during the scratch test. While as seen in Fig. 6b and c, by Ni addition, more plastic deformation appeared during the scratch test instead of occurrence of cracks, which proved that the fracture toughness of Cr–Ni–N coatings was significantly improved by increasing Ni content. It can be explained by that the soft Ni phase that precipitated at the CrN grain boundaries consumed the energy from the compressive and shear stress by plastic deformation and the plastic deformation acted more dominantly than the crack occurrence during the scratch test.
25
End-edge SEM images of scratch track of Cr–Ni–N coatings with Ni content of a 0, b 5·4 at-% and c 6·3 at-% under increased load from 0·01 to 50 N respectively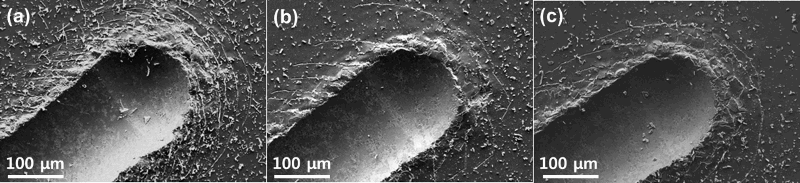
Figure 7 shows the hardness and elastic modulus of the Cr–Ni–N coatings as a function of Ni content respectively. The hardness and elastic modulus of the pure Cr-N coating were 30·4 and 253·9 GPa respectively. By Ni addition, the hardness of Cr–Ni–N coatings slightly increased, while the elastic modulus of the coatings decreased respectively, as compared to Cr-N coating. The increase in hardness of the coatings can be explained by two main possible reasons: (i) The solid solution strengthening occurred with Ni addition.
8
According to former section, Ni atoms were substituted for Cr atoms in CrN lattice as solid solutions, blocking the piling up and movement of the defects. (ii) Grain refinement effect. The grain growth of the CrN was interrupted by the precipitated Ni phases, leading to grain refinement of the coatings, and thus the hardness of the coatings was enhanced according to Hall-Patch relation.
8
On the other hand, the drop of elastic modulus of the Cr–Ni–N coating, as compared to Cr-N coatings, was considered to be attributed to the softer metallic Ni phase formation at the Cr-N grain boundaries.
a hardness and elastic modulus of Cr–Ni–N coatings with Ni content from 0 to 6·3 at-% respectively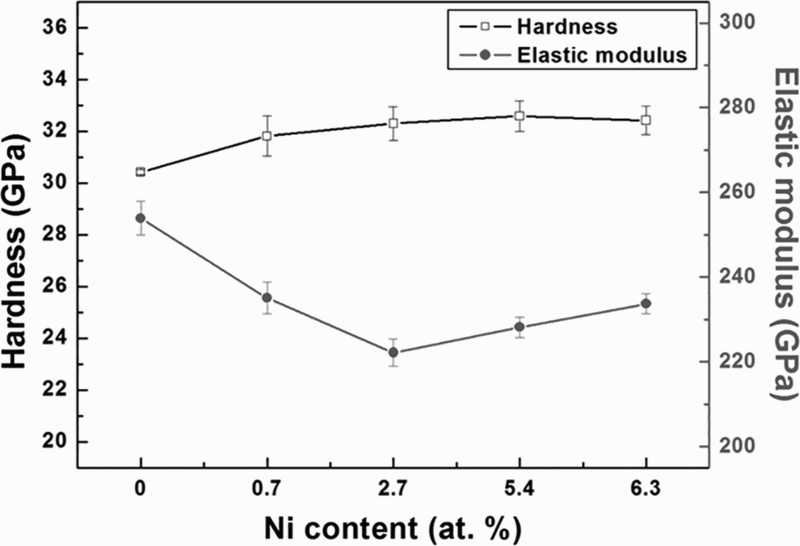
Figure 8 shows the SEM images of the wear track of the Cr–Ni–N coatings with Ni content from 0 to 6·3 at-% respectively. It was reported by other researchers that the wear track width typically represented the wear resistance of the coatings, and the wear resistance was strongly related to the hardness and fracture toughness of the coatings.
26
A wear track with a width of 167 μm and significant plowing action and grooves oriented parallel to the sliding direction can be observed on the Cr-N coating due to the brittle fracture of the Cr-N coating during sliding test and the abrasive wear effect of the wear particles. As the Ni content increased from 0 to 2·7 at-%, the width of the wear track obviously decreased to 93 μm, and less abrasive wear occurred during siding test as compared to the Cr-N coating, which indicated that the wear resistance of the coatings was significantly improved by Ni addition. The improvement of wear resistance was considered to be mainly attributed to the increase in hardness and enhanced resistance to brittle fracture of the coatings by adding Ni. Further increase in Ni content to 6·3 at-% lead to increase in the wear track width of Cr–Ni–N coatings and adhesive wear behaviour can also be observed. Owing to the further increase in the soft Ni phase volume in the Cr–Ni–N coatings, it performed dominant influence on the wear behaviour. The soft Ni phase consumed energy, plastically deformed and adhered to the counterpart ball during the wear test, resulting in adhesive wear behaviour of the coatings, which also lead to the increase in the width of wear track.
Images (SEM) of wear track of Cr–Ni–N coatings with Ni content of a 0, b 0·7 at-%, c 2·7 at-%, d 5·4 at-% and e 6·3 at-% after sliding test under 1 N load respectively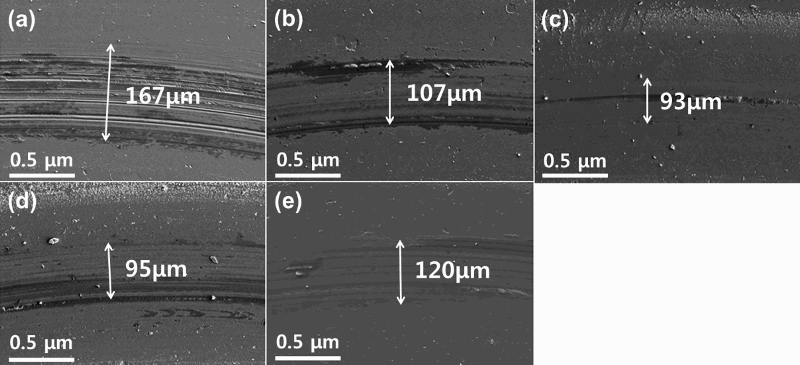
Conclusion
The effect of Ni addition into Cr-N coatings on the microstructural evolution and mechanical properties of the coatings were studied. The Ni content was varied from 0 to 6·3 at-% by the hybrid coating system consisting of HiPIMS and RFMS. The results revealed that the Ni element was incorporated into CrN crystals as solid solutions, while excess Ni was precipitated at the CrN grain boundaries. By adding small amount of Ni (up to 〜6·3 at-%), the toughness of the Cr–Ni–N coatings was significantly improved. In addition, the hardness of Cr–Ni–N coatings slightly increased from 30·42 to 32·59 GPa due to both the grain refinement effect and solid solution hardening. On the other hand, the elastic modulus of coatings decreased due to the soft Ni phase formation. The Cr–Ni–N coatings with the highest wear resistance were obtained at the Ni content of 2·7 at-%, where the proper amount of Ni phase effectively enhanced the toughness of Cr-N coatings, and the enhanced toughness played a role to increase the wear properties.
Footnotes
Acknowledgements
This research was supported by Global Frontier Program through the Global Frontier Hybrid Interface Material of the National Research Foundation of Korea funded by the Ministry of Science, ICT & Future Planning (2013M3A6B1078874).