
Abstract
The aim of this work is to discuss the effect of different amounts of NaF in electrolyte on structure, corrosion resistance and wear behaviour of the prepared ceramic coatings on Ti6Al4V alloy by plasma electrolytic oxidation (PEO) technique. PEO process was carried out under constant current of 2 A, frequency of 1 kHz, anodic duty cycle of 45% and cathodic duty cycle of 25% using a pulse bipolar power supply. TiO2 based coatings were prepared from three aluminate base electrolytes containing various amount of NaF (0.75, 1.5 and 2.25 g L−1). Phase composition, surface morphology and thickness of the resultant coatings were examined by means of X-ray diffraction and field emission scanning electron microscopy. Results indicated that solution composition and process time have a great effect on thickness and surface porosity of the coatings. Corrosion resistance and wear properties of the coatings were in a good accordance with structural properties.
Introduction
Titanium and its alloys are widely used in aerospace, marine and biomedicine industries due to their high strength/weight ratio and corrosion resistance along with excellent mechanical properties and biocompatibility.1-5 However, lack of surface hardness and weak frictional and wear properties have limited tribological applications of these alloys.6,7 The poor tribological properties of titanium alloys can be overcome by specific surface treatments. 7–9 Many surface treatments, such as thermal oxidation, 10 plasma nitriding, 11 ion implantation, 12 spraying, 13 laser modification 14 and plasma electrolytic oxidation (PEO),15,16 have been used to improve tribological properties of titanium and its alloys.
PEO, also called microarc oxidation, is a relatively new process to uniformly synthesise ceramic-like oxide films on the surface of lightweight metals and alloys (aluminium, magnesium, zirconium, titanium, etc.).15,16 During the PEO process, discrete spark discharges occur on the surface, when the supplied voltage is higher than a critical value (called dielectric breakdown voltage). 17 Discharges happen as a result of a loss in dielectric stability of oxide film in a region of low conductivity. This process is accompanied by visible light emission and gas evolution.17–20 The surface temperature and pressure are locally increased by microdischarging, which results in formation of oxide coatings due to high number of discrete spark discharges. The main part of the obtained oxide films is substrate oxides. However, they also contain complex oxides of the components of the electrolytes.17,21
Rutile, anatase and brookite are the three polymorphs of titania. Rutile is considered as the stable and anatase as the metastable form of titania. 22 These different polymorphs of titania have different corrosion and wear properties. The PEO process has numerous affecting parameters such as the solution, potential, frequency and duty cycle. These parameters directly affect the TiO2 film morphology and thus the corrosion resistance and wear characteristics changes. On the other hand, electrolytes’ composition has a great influence on the phase composition of the coating. Therefore, the effect of different electrolyte compositions on the microstructure and phase composition of coatings needs more investigations. Aluminate base electrolytes are an important group of solutions used in plasma electrolyte oxidation of titanium and its alloys.23–26 Coatings produced in aluminate base electrolytes contain TiAl2O5 complex oxide phase in addition to titania phases (rutile and anatase). 23
The aim of this study is to investigate the effects of different amounts of NaF addition to the electrolyte on the microarcing situation during the process, morphology, microstructure, corrosion resistance and wear behaviour of the prepared coatings.
Experimental
Materials and PEO procedure
Disc samples of Ti6Al4V alloy with 30 mm diameter and 4 mm thickness were first polished with SiC abrasive paper (60-1500#) and then washed with acetone and distilled water. A bipolar pulse galvanostatic power supply was employed for plasma electrolyte oxidation. The applied amperage, anodic duty cycle, cathodic duty cycle and frequency were selected to be 2 A, 45%, 25% and 1000 Hz respectively. Disc samples were used as anode and stainless steel plates were used as cathode in this electrochemical system. The anodic peak voltages were monitored by means of a Ziegler RM-16 high resistance voltmeter. During the process, the discharge behaviour was also monitored using Canon XS-1000 camera, operating at 24 frames/s and a resolution of 640×480.
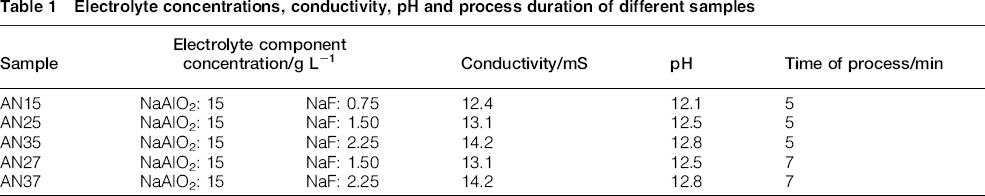
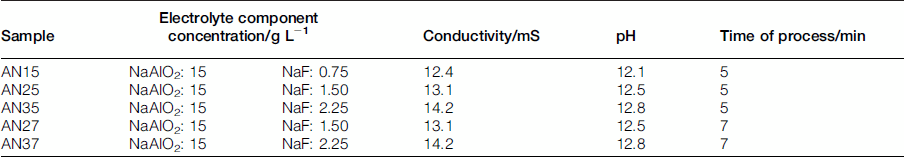
Electrolyte concentrations, conductivity, pH and process duration of different samples
Morphological and microstructural analysis
Surface morphology and cross-sections of the produced coatings were examined using a field emission scanning electron microscope (Tescan Mira3). The surface morphology images were processed by means of Image Processing Lab software. Phase composition of the coatings was also analyzed by means of X-ray diffractometer (XRD; Philips X'Pert) with Cu Ka radiation.
Corrosion tests
Corrosion properties of the coatings were investigated by potentiodynamic polarisation, using a BioLogic SP 150 potentiostat/galvanostat. All the electrochemical tests were carried out in 3.5 wt-% NaCl solution at room temperature. A platinum foil (1 cm2) was used as the counter electrode, and Ag/AgCl (3M KCl) was used as the reference electrode. Potential range for potentiodynamic polarisation tests was –300 to + 1000 mV with respect to the open circuit potential, while potential scan rate was 1 mV s−1.
Hardness, scratch, roughness and tribological tests
Hardness measurements were carried out on an AMSLER D-6700 Vicker's microhardness testing machine, using an applied load of 1 N for 15 s. The mean values of at least three measurements conducted on different areas of each sample were considered.
Dry sliding ball on disc wear tests on the Ti6Al4V substrate and coated samples were carried out in a laboratory atmosphere at 30–40% relative humidity and room temperature. The rotating specimens were slide against an alumina ball with a diameter of 6 mm. Wear tests were undertaken under the normal load of 2 N, the sliding linier velocity of 0.1 m s−1 and sliding distance of 300 m. The coefficient of friction was also recorded continuously during the tests. Scratch tests were performed on the coated samples using the continuous load increase method up to 25 N with a Micro Scratch Tester, with a load rate of 18.2 N min−1 and an advance rate of 9.5 mm min−1, resulting in a scratch of 13 mm. The tip was a diamond Rockwell C diamond stylus indenter with a radius of 200 μm. The surface roughness (Ra) was measured by means of a mechanical profiler. The surface profile included the variation on the surface topography, which filtered to obtain surface roughness profile only. The filtration was done using Gaussian filter with cutoff wavelength of 0.25 mm and measuring length of 6 mm.
Results and discussion
Formation of PEO coatings in different electrolytes
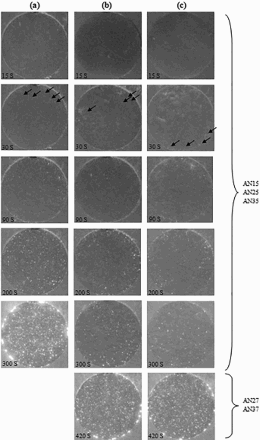
The anodic peak voltage changes with time for AN15, AN25 and AN35 are shown in Fig. 1. For all the samples, the anodic peak voltage is rapidly increased to ∼175 V at the first 20 s of experiments, and then the slope of the plots is decreased. Real time imaging of the discharges can show the influence of electrolyte NaF content. Images of the samples in different electrolytes during the PEO process are shown in Fig. 2. It can be seen that in all the samples, microarcing is not started after 15 s, while microarcs appeared after 30 s. Comparing Figs. 1 and 2, it can be concluded that microarcing started after ∼20 s. Black arrows in Fig. 2 (30 s) show relatively weak discharges. Thus, the point of change in the increasing rate of the anodic peak voltage (20 s in these samples) can be the time of dielectric breakdown and the start of microarcing process.
Figure 1 also shows that the final peak voltages (Vf) of AN15, AN25 and AN35 are 400, 300 and 315 V respectively. On the other hand, Fig. 2 shows red severe arcs on the surface of the AN1 sample after 300 s. These red powerful arcs may cause some destructive effects such as rough surface finish and thermal cracking of the film.
27
However, severe red arcs did not appear on the surface of AN25 and AN35 because the final peak voltages of these samples are lower than that of AN15. Therefore, it can be concluded that the limiting voltage of the PEO process in our electrolytes is between 315 and 400 V, and the process in the electrolytes containing 1.5 and 2.25 g L−1 NaF can be continued to Vf reach to about these voltages. Comparing Fig. 1 and conductivity of the electrolytes (in Table 1) shows a reverse relationship between the electrolyte conductivity and the slope of voltage–time response after microarcing. This reverse relation is in accordance with Ohm's law. Continuing the process in these two electrolytes (AN27 and AN37 samples) shows that after 7 min, powerful red arcs appeared (Fig. 2
b and c, after 420 s) and the peak voltage reaches to ∼400 V. Figure 3 shows the voltage–time response of AN27 and AN37 samples. It can be seen that the final peak voltages for these two samples are 380 and 420 V respectively. So, the severe red arcs of AN27 and AN37 samples after 420 s are due to the increase of peak voltage to these higher values.
Changes in peak voltage of AN15, AN25 and AN35 samples during PEO treatment Video images of samples during PEO process in different electrolytes: a 0.75 g L–1; b 1.5 g L–1; c 2.25 g L–1 NaF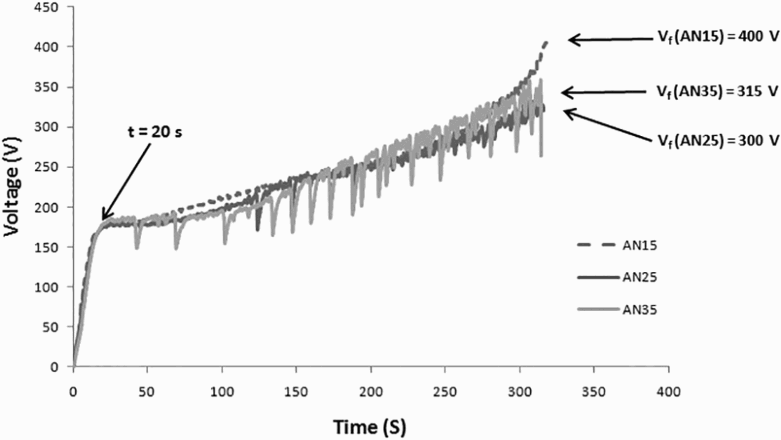
Morphology and microstructure of coatings
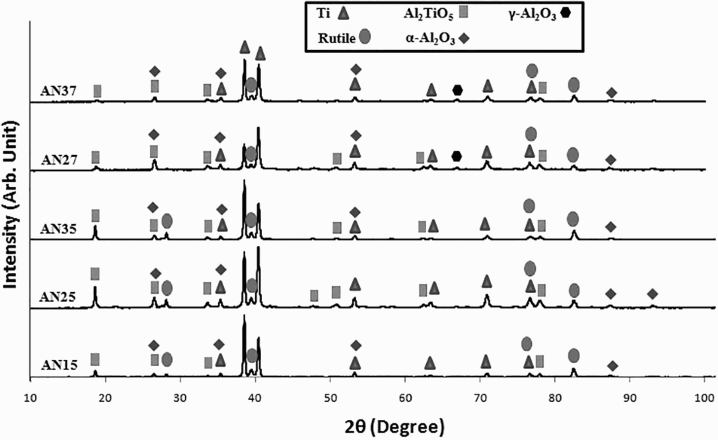
XRD patterns of the coated samples are depicted in Fig. 4. Two of the strongest peaks in all the patterns are related to titanium from the substrate. The main phase in all coatings is Al2TiO5. Comparing the relative intensity of Al2TiO5 peaks in AN25 with other samples reveals that the amount of this phase in AN25 is higher than the other samples. Increasing of PEO process duration from 5 to 7 min decreases the relative intensity of Al2TiO5 peaks (AN27 and AN37).
According to Fig. 4, rutile is the main titanium oxide phase in all the samples. Thermodynamic studies showed that the α-Al2O3 phase is usually formed at temperatures higher than 1273 K. Thus, it shows that the coating is likely exposed locally to such high temperatures due to discharges. c-Al2O3 phase (that is, a metastable phase) is also detected in AN27 and AN37 specimens. Aluminium species in Al2O3 and Al2TiO5 phases must be derived from Ti6Al4V substrate and sodium aluminate (NaAlO2) in the electrolyte.
28
Changes in peak voltage of AN27 and AN37 samples during PEO treatment XRD patterns of coated samples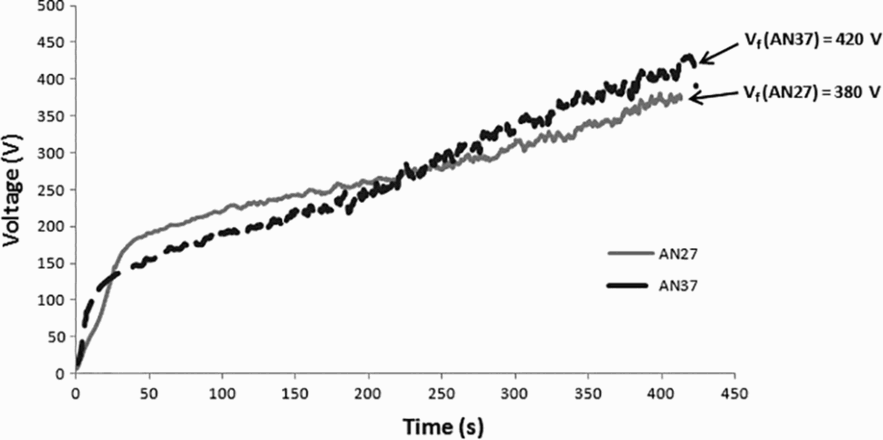
The surface morphologies of the prepared coatings are shown in Fig. 5 (a, c, e, g and i). Pancake-like morphology of the coatings is clearly observable. This could be due to formation of microarcs during the PEO process. On the surface of each sample, pores with different diameters are observable. This is in agreement with the fact that the intensity and size of the arcs were increased continuously during the process (Fig. 2), which in turn increased the size of the micropores diameter after cooling.1
Venkateswarlu et al. mentioned that the morphological properties such as the shape (closed or opened or interconnected), size, number and distribution of micropores over the surfaces of PEO coatings can be related to the properties of microspark discharges hat occurred during the PEO film growth process. 29 Further, they showed that the density of the microarcs is mainly controlled by the resistivity of the electrolyte solution, and these two are in a direct relation with each other. 30 Comparing Fig. 5 c and e, it is seen that the pore density on the surface of AN25 is less than that on AN35, which could be due to its lower electrolyte conductivity (because of lower NaF content). In addition, the surface of AN25 film looks more compact with well dispersed oxidation products, which close the surrounding pores. According to Fig. 4 i and 5g, some regions on the surface of AN27 and AN37 samples are totally destroyed and the pancake morphology in these regions is broken down. This phenomenon may be related to the severe red microsparks at the end of the PEO process of these samples.
Porosity data derived from image processing of surface SEM images
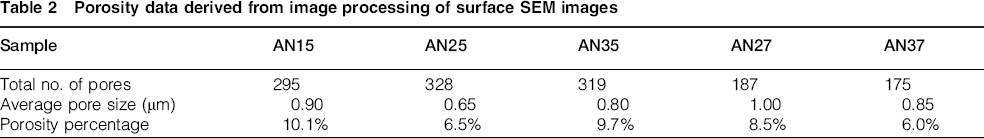
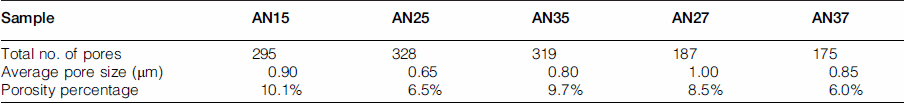
The porosity of AN27 and AN37 samples is 8.5% and 6.0% respectively. These lower percentages of porosity can be due to the fact that there are some totally damaged regions on the surface of these two samples (which are obviously detectable in Fig. 4 g and i), which can affect the real PEO treated surface and decrease it. The average pore sizes of AN27 and AN37 are 1.0 and 0.85 μm respectively. These large pores can be generated by powerful sparks at the final stages of the PEO process of these samples (Fig. 2 b and c, 420 s).
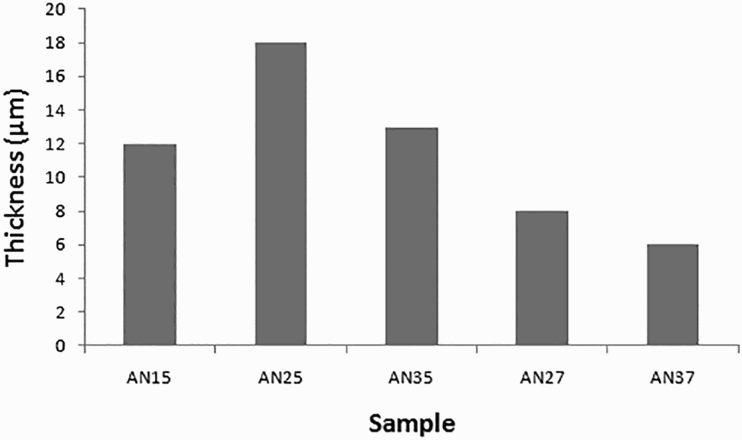
Figure 6 shows SEM images from cross-section of the coatings. The thickness of these coatings is also shown in Fig. 7. The cross-section images illustrate that the AN15 coating is thinner than AN25 and AN35. This may be because of the powerful sparks generated on the surface of AN15. These intense red sparks can lead to generation of cracks in the coating and detachment of some parts from it. Lower thickness of AN27 as compared to AN25 (8 and 18 μm respectively) could also be due to the destructive effects of powerful sparks by continuing the PEO process for 7 min (Fig. 2
b). On the other hand, Fig. 6
a, d and e shows a gap between the coating surface and resin. These gaps can be as a result of some totally destroyed regions that are obvious on the surface images of these samples (Fig. 5).
Surface morphology and image processed micrographs of a, b AN15, c, d AN25, e, f AN35, g, h AN27 and i, j AN37 Cross-section SEM images of a AN15, b AN25, c AN35, d AN27 and e AN37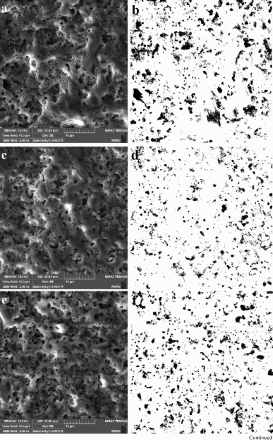
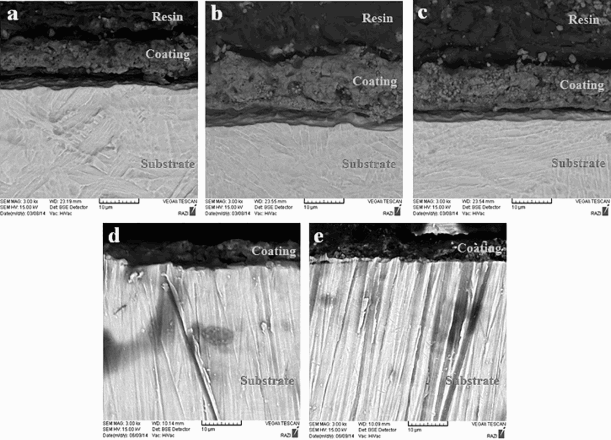
Figure 6 also shows that coatings prepared in electrolytes with higher NaF content (1.5 and 2.25 g L−1 NaF) have better adhesion to the substrate. This can be due to higher electrolytic conductivity and higher microarcs density. 30
Corrosion resistance of coatings
An oxide film by restricting adsorption of corrosive ions shifts the surface potential to more positive potentials and reduces the charge carrier mobility at the interface of metal and electrolyte, which in turn protects the substrate from corrosion. Anti-corrosion properties of this group of coatings are affected by a combination of characteristics of the oxide film (phase composition, structural imperfections and thickness) and corrosion environment (such as concentration of aggressive ions). 2
In PEO coatings, larger micropores increase the real area that is exposed to the corrosive solution. On the other hand, an increase in coating thickness increases the barrier property of coating and improves anti-corrosion properties.
1
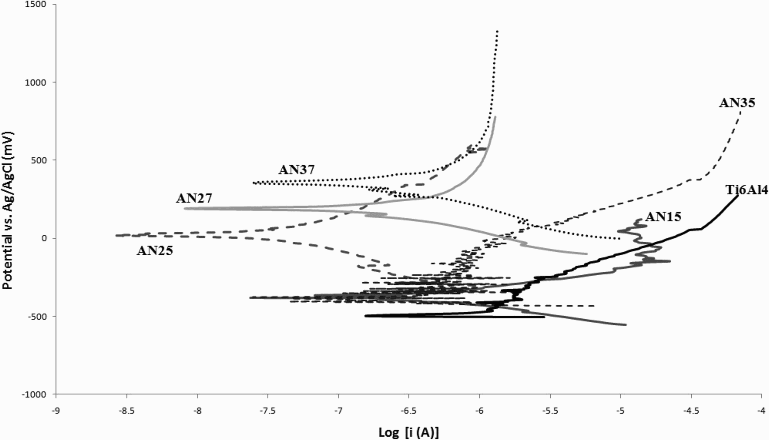
Tafel curves of the untreated Ti6Al4V alloy and PEO coated samples in the 3.5% NaCl solution are illustrated in Fig. 8. The corrosion potential (Ecorr), corrosion current density (icorr) and polarisation resistance (Rp) obtained from these curves are presented in Table 2. Stern–Geary equation was used to obtain polarisation resistance (Rp):
1
Thickness of PEO treated coatings Potentiodynamic polarisation curves of untreated Ti6Al4V alloy and PEO treated samples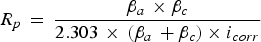
Corrosion parameters obtained from Tafel curves
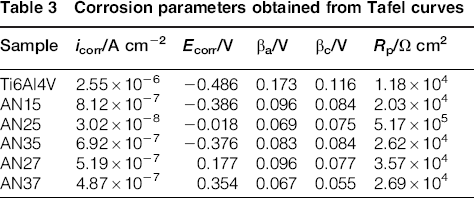
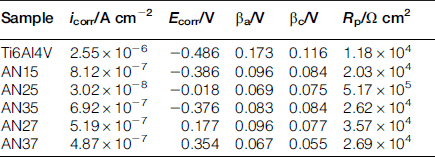
The corrosion current density of AN35 is lower than that of AN15. The XRD patterns show that the peaks related to rutile and Al2TiO5 in AN35 has higher relative intensity as compared to the intensity of these phases in AN15. On the other hand, the thickness of AN35 is, 10% more than that of AN15. Moreover, the image processed surface micrographs show that AN35 has lower surface porosity and smaller average pore diameter as compared to AN15. The higher polarisation resistance of AN27 and AN37 compared to that of AN15 and AN35 can be a result of lower surface porosity percentage of these samples.
Microhardness and wear behaviour of coatings
The microhardness of untreated Ti6Al4V substrate and PEO treated samples is shown in Fig. 8. It is clearly evident that the PEO treatment results in a great increase in the surface microhardness. AN25 has the highest microhardness among all the PEO treated samples. This can be due to the high content of hard phases (such as Al2TiO5 and a-Al2O3) and lower porosity (and smaller pores) on the surface of this sample. Comparing Figs. 5 and 9, it can be concluded that microhardness is decreased by increasing the surface porosity.
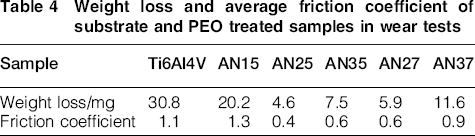
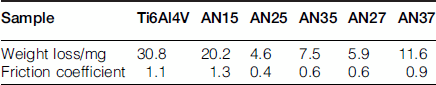
Weight loss and average friction coefficient of substrate and PEO treated samples in wear tests
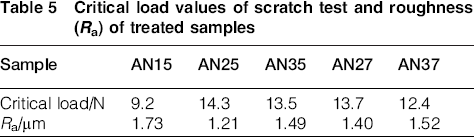
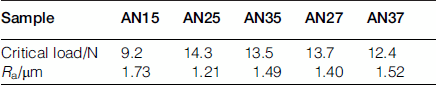
Critical load values of scratch test and roughness (Ra) of treated samples
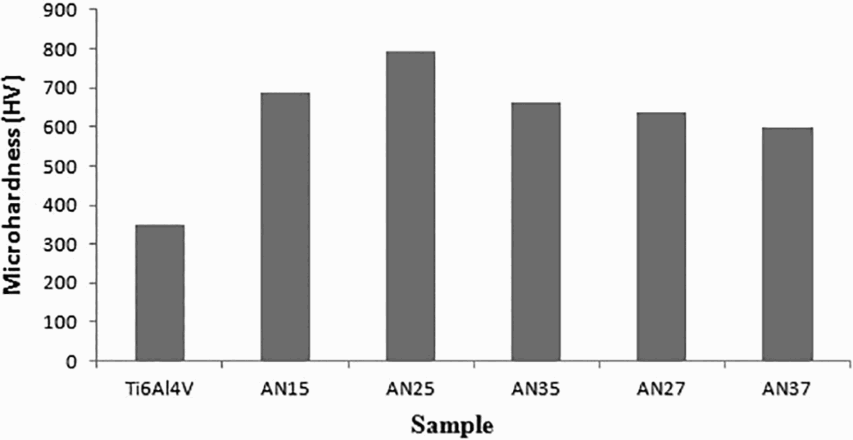
Microhardness of untreated Ti6Al4V alloy and PEO treated samples
Moreover, scratch and roughness tests show that AN15, AN27 and AN37 samples (which have severe microarcing process) have lower adhesion and rougher surface in comparison with AN25 and AN35 samples. These data are in agreement with wear resistance of these samples.
Al2TiO5 and α-Al2O3 are known as phases with good anti-wear properties. XRD patterns show that relative intensity of the peaks of these phases in different samples is in a good agreement with the wear resistance of the coatings.
Conclusion
In the present study, different ceramic coatings were prepared by PEO of Ti6Al4V alloy in aluminate base electrolytes with different concentrations of NaF, and their morphology, microstructure, corrosion resistance and wear behaviour were examined and compared to the Ti6Al4V substrate. The outcome of the results can be summarised as follows:
In all three different electrolytes, microarcing process starts when the anodic peak voltage of the sample increases to ∼175 V, although powerful severe red arcs are generated when the peak voltage increases to ∼400 V. Al2TiO5, rutile and α-Al2O3 are the main phases in the prepared coatings. Relative intensity of peaks shows that the sample treated in 1.5 g L−1 for 5 min (AN25) has higher amount of rutile and Al2TiO5 in its structure. The coated sample in 1.5 g L−1 NaF electrolyte for 5 min (AN25) has the lowest surface porosity (6.5%) and smallest average pore size (∼0.65 μm). The coated sample in 0.75 g L−1 NaF solution for 5 min (AN15) has the highest surface porosity of ∼10.1%. The coatings prepared in electrolytes with higher NaF content (1.5 and 2.25 g L−1 NaF) have better adhesion to the substrate than that prepared in the electrolyte with 0.75 g L−1 NaF. All prepared coatings showed better corrosion resistance as compared to Ti6Al4V substrate. Among the films, the icorr of AN25 was the least at a value of 3.02×10⁻⁸ A cm−2 and the icorr of AN15 was the highest at a value of 8.12×10⁻⁷ A cm−2, corroborating with their Rp values. The weight losses of PEO treated samples were from 1.5 to 7 times lower than the Ti6Al4V substrate.
Footnotes
Acknowledgements
This funding of this project has been provided by Sarkhoon and Qeshim Gas Treating Company.