
Abstract
Micro‐Raman spectroscopy has been employed as an effective technique to determine the phase transformations in nanostructured yttria stabilised zirconia (YSZ) ceramics with different yttria contents. Samples have been prepared with varying mean grain sizes by a slip casting route followed by a microwave assisted two‐step sintering cycle starting with aqueous nanozirconia suspensions. Indents were generated using a Vickers pyramidal indenter at different loads, and the resulting phase transformations were mapped using micro‐Raman spectroscopy. The results were compared to those of a commercial submicrometre 3 mol.% YSZ. The amount of transformation was found to be much lower for nanozirconia compared to the submicrometre zirconia with similar yttria content.
Introduction
Zirconia has three well defined polymorphs: monoclinic, tetragonal and cubic; the first one is stable at room temperature while the other two are stable at temperatures above 1000°C.1 The tetragonal and cubic phases can be stabilised at room temperature by doping with appropriate amounts of CaO, MgO, Y2O3 and CeO2. Full or partial stabilisation is required because the martensitic transformation from tetragonal to monoclinic involves a 3–5 vol.% change when the sintered body is cooled, and this induces cracks causing components to shatter on cooling.2 Zirconia nanoparticles, however, have a size dependent phase stability; when the particle size is below a critical limit, they exist in their metastable tetragonal polymorph.3 This provides the possibility of stabilising the tetragonal phase in yttria stabilised zirconia (YSZ) with lower amounts of stabiliser than for conventional, submicrometre ceramics, in turn, helping to reduce the cost of zirconia based nanopowders.
Micro‐Raman spectroscopy is an important technique enabling fundamental molecular vibrations to be measured. These vibrations shift the wavelength of a small fraction of the light, typically from a laser that strikes the substance, forming sharp, well resolved bands. The Raman shift is different for the monoclinic and tetragonal phases of zirconia resulting in separate peaks. The intensity of the peaks is proportional to the amount of each phase, and this, in turn, can be used for quantitative phase analysis of materials. The technique is non‐contact and non‐destructive and requires no special preparation or manipulation of the sample. It is a rapid method compared to techniques, such as X‐ray diffraction (XRD), and can be used to obtain both qualitative and quantitative data. Unlike XRD, a micro‐Raman spectrum can be collected from a very small area (∼1 μm2) yielding high spatial resolution. In the confocal probe configuration, Raman spectrometers can obtain information from the surface of a sample inwards, enabling gradients to be assessed. Micro‐Raman mapping is a technique in which a number of spectra are collected from a specific area to obtain information about the spatial distribution of different materials and/or different phases. A large number of spectra are collected from an area under investigation with the help of computer controlled stepping motors and are then integrated with the help of a software to yield a two‐dimensional map of the area, showing different materials, different phases or stress levels. Spectroscopes equipped with confocal lenses enable quasi‐three‐dimensional mapping.
There are a number of reports in the literature concerning the use of Raman microscopy for analysing zirconia based ceramics;4–8 for example, it has been employed to find the different ZrO2 phases present at various temperatures, both above and below the phase transition temperature,9–12 and to study pressure induced phase transitions.13 Quantitative data may be obtained11–16 allowing, e.g. examination of Vickers indentation induced phase transitions,17,18 characterisation of wear surfaces,19 calculation of residual and mechanical stresses in bulk materials including zirconia toughened alumina20,21 and also for analysing fracture surfaces.22 Micro‐Raman mapping has been used to map the locations of the phases present, for example, to study the phase changes near indent corners.23 The technique has also been used recently for the study of the phase changes and stress distributions occurring in zirconia toughened alumina femoral heads.24
In this work, confocal micro‐Raman spectroscopy was used as an effective technique for studying the spatial distribution of indentation induced phase transformations in nanostructured zirconia ceramics with different yttria contents. Recording the spectra with a spatial resolution of ∼1 μm2, the results have been compared with those of a submicrometre zirconia sample prepared from a commercial powder. No quantitative calculations were made; the aim was to investigate the potential grain size dependent stabilisation of nanozirconia and its consequences.
Experimental
The nanozirconia samples used in the present study were prepared by slip casting. As received aqueous suspensions of nanoyttria partially stabilised zirconia powders containing 0, 1·5, 2 and 3 mol.% yttria and with ∼5 vol.% solid content (MEL Chemicals, Manchester, UK), were concentrated using a patented technique25,26 to ∼20 vol.% solid content and slip cast into 15 mm diameter plaster of Paris (Millecast, Lafarge Prestia, Mériel, France) moulds. To ensure that there were no agglomerates present before slip casting, the suspensions were exposed to ultrasound for 3 min while being kept cool in a water bath. The required amount of suspension was transferred slowly into the mould cavity to ensure that no air bubbles became trapped in the suspension during transfer. After casting, the mould and casting were left under laboratory conditions (20–25°C) for up to 72 h to allow an initial degree of drying, after which the samples were removed from the mould and placed on a Teflon sheet to allow unrestricted shrinkage for a further drying period of 48 h. Once fully dry, the samples were heated to 700°C for 2 h at 0·5°C min−1 to remove the organics. Sintering was subsequently performed via a two‐step sintering cycle using a microwave–radiant hybrid furnace (C‐Tech Innovation Limited, Capenhurst, UK). Previous work had shown that this approach was capable of limiting the grain growth.26 The samples were heated to a high initial temperature T1 for 6 s and then cooled down to a slightly lower temperature T2 and held for sufficient period of time to allow complete densification. The hybrid furnace could be operated in either pure radiant or hybrid microwave–radiant mode. The microwave frequency was 2·45 GHz; up to 2 kW of microwave power was available. In the present work, a fixed level of 600 W of microwaves was used throughout the sintering cycle, with the amount of radiant power being varied to yield the desired temperature–time profile. The temperature was measured and controlled using an optical fibre thermometer (Accufiber model 100; Luxtron Corp., Santa Clara, CA, USA). Samples with different mean grain sizes were prepared by varying the sintering conditions (Table 1). More details about sample preparation can be found elsewhere.26,27 Nano‐0YSZ samples were prepared using conventional single step sintering (Carbolite Ltd, Sheffield, UK). For comparison, samples with a submicrometre grain size were prepared using a commercial 3YSZ powder, grade 3YSB‐C (Tosoh Corporation Europe, Amsterdam, The Netherlands). These samples, which measured 10 mm in diameter, were prepared by dry pressing at 180 MPa and subsequently sintered using a conventional, single stage sintering cycle (Carbolite Ltd, Sheffield, UK) at 1500°C for 2 h using a heating/cooling rate of 2°C min−1.
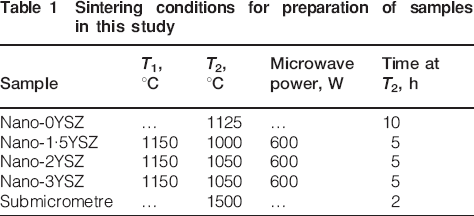
Sintering conditions for preparation of samples in this study
The density of the sintered samples was determined using the Archimedes method with water as the displacing medium. The theoretical density was taken as 6·05 g cm−3 for all the yttria containing samples and as 5·84 g cm−3 for the pure monoclinic zirconia (0YSZ). For polishing and grain size determination, the sintered samples were mounted in epoxy resin (Epofix, Struers Ltd, Solihull, UK) and polished using a semiautomatic polishing machine (TegraPol‐25, Struers Ltd, Solihull, UK) with successively finer diamond polishing discs. The final polish used a 0·04 μm colloidal silica suspension (OP‐S, Struers Ltd). After polishing, the nanosamples were thermally etched for 6 min at the second step sintering temperature, T2. This prevented unwanted grain growth during thermal etching. The commercial submicrometre samples were thermally etched for the same duration at 1350°C. To determine the grain size, micrographs were taken using a LEO 1530VP field emission gun SEM (LEO Elektronenskopie GmbH, Oberkochen, Germany) at different magnifications. The grain size was determined using the linear intercept method (ASTM E 112‐96), the two‐dimensional grain size being converted to three dimensions using a conversion factor of 1·56.28 At least three micrographs and a total of 300 grains were evaluated to determine the mean grain size for each sample batch.
The indentation toughness of the samples was measured after polishing, but before thermal etching. The indents for the toughness measurements and subsequent micro‐Raman studies were created using a Mitutoyo AVK‐C2 Vickers hardness tester (Mitutoyo Corporation, Kawasaki, Japan) by applying a 10 kg load. The load was increased to 20 kg and then to 30 kg for the nano‐1·5YSZ samples, and the indentation toughness was calculated using the formula reported by Anstis et al.29
The micro‐Raman spectra were recorded using a LabramHR spectrometer (Horiba Jobin Yvon SAS, Villeneuve d'Ascq, France) in the confocal configuration. The spectrometer was equipped with a liquid nitrogen cooled charge coupled device detector and had two objective lenses with ×10 and ×50 magnification. The optical microscope of the micro‐Raman device was connected to a video monitor that allowed specific areas on the sample surface to be selected for analysis. The movement of the sample stage was controlled using a computer driven stepping motor. The spectroscope was equipped with argon (wavelength, 514 nm) and helium–neon (wavelength, 632·8 nm) lasers. The latter was used in the present study to excite the sample, and the laser power used was 20 mW. The spectra were collected from 100 to 800 cm−1; spectrum integration time was 60 s, and it was averaged over two successive measurements. When mapping was performed, the range was reduced to 100–350 cm−1 since it covered the most important peaks corresponding to the monoclinic and tetragonal phases, and the integration time was reduced to 5 s. The spatial resolution of the equipment was ∼1 μm2.
Results and discussion
Only samples with a density of >99·0% were used in the present study, except for the 0YSZ sample, where the maximum density obtained was ∼98% of theoretical density. Representative microstructures of the nano‐ and submicrometre 3YSZ samples are shown in Fig. 1.
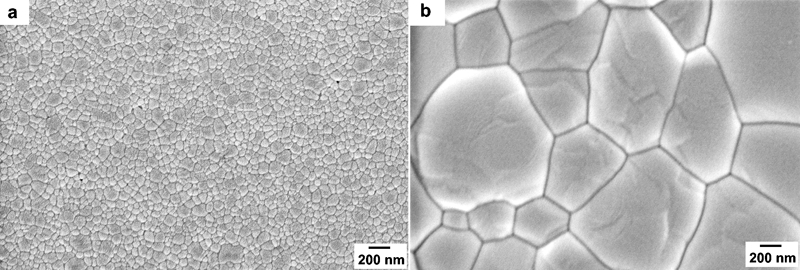
Representative microstructures of a nano‐3YSZ and b submicrometre 3YSZ used in present study: both samples were >99·0% of theoretical density and had mean grain sizes of 130 and 520 nm respectively
A detailed study of the variation in hardness and indentation toughness with grain size for samples with different yttria contents is reported elsewhere.30 The samples that showed the maximum indentation toughness for each composition were selected for the micro‐Raman study. Table 2 summarises the mean grain size, density, hardness and toughness of these samples.
Mean grain size, density, hardness and toughness of samples selected for micro‐Raman study
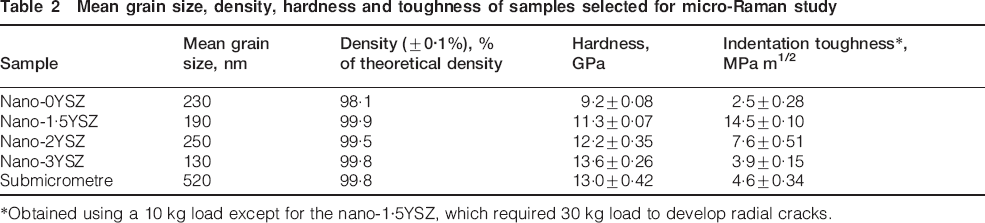
*Obtained using a 10 kg load except for the nano‐1·5YSZ, which required 30 kg load to develop radial cracks.
The 10 kg indentations on the submicrometre 3YSZ and nano‐1·5YSZ samples are shown in Fig. 2; the absence of radial cracks for the nanosample is clearly evident. Nano‐1·5YSZ and nano‐2YSZ had lower hardness than the submicrometre 3YSZ, whereas nano‐3YSZ displayed slightly higher hardness (Table 2).
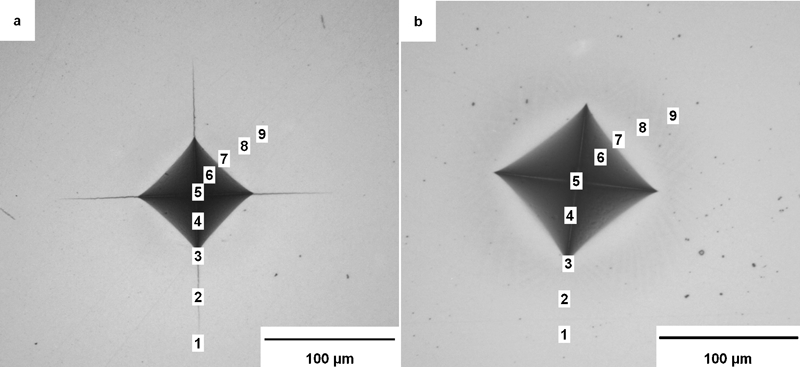
Optical microscopic image of indent created on a submicrometre and b nano‐1·5YSZ at 10 kg load: locations from where micro‐Raman spectra were taken are numbered 1–9
The micro‐Raman spectra were recorded at a number of locations as indicated in Fig. 2; the distance between points 7, 8 and 9 were ∼20 μm each. The micro‐Raman spectra of the submicrometre 3YSZ, nano‐0YSZ, nano‐2YSZ and nano‐3YSZ listed in Table 2 are shown in Fig. 3.
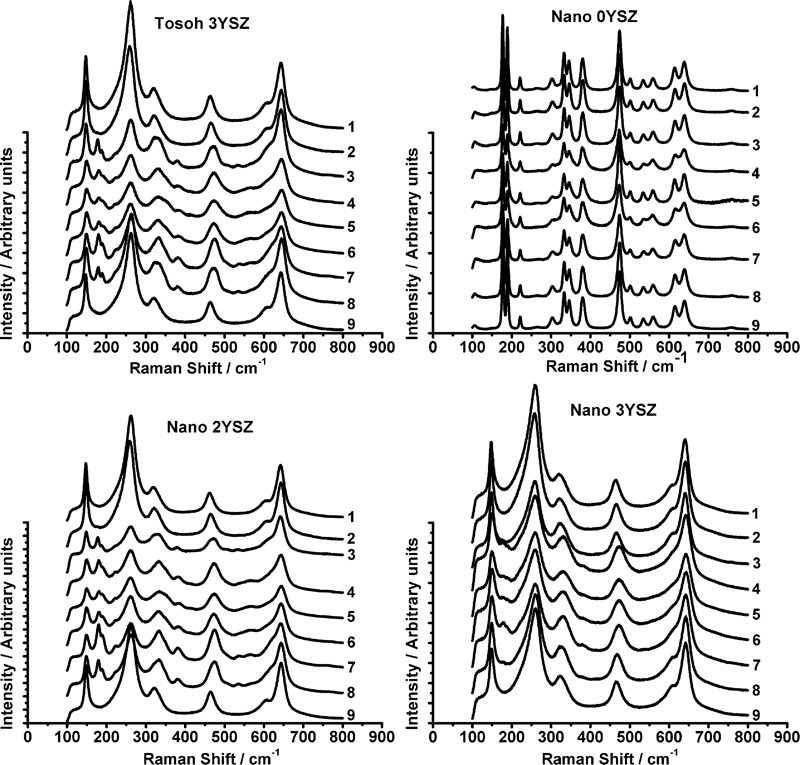
Micro‐Raman spectra recorded from positions 1–9 for four different samples: all indents were created using 10 kg load
All peaks for the nano‐0YSZ correspond to the monoclinic phase; this was expected since XRD (not shown here) confirmed that this composition consisted entirely of this phase. The indentation toughness of this material was also the lowest because of the absence of any transformation toughening. The micro‐Raman spectra for the submicrometre sample showed mainly the tetragonal peaks (148 and 264 cm−1), while monoclinic peaks (monoclinic doublet at 181 and 192 cm−1) are identified in most of the locations in and around the indent and the crack. From the monoclinic peak intensities, it can be observed that maximum phase transformation has occurred at the indent corners and near the indent edges (positions 3 and 7). These observations are in agreement with the results reported by Reece et al.,31 where they observed maximum transformation away from the apex of the indentation impression for a highly transformable Ce–tetragonal zirconia polycrystal ceramic. Any transformation below a few micrometres from the surface was not detected since the equipment was used in the confocal probe configuration. Previous studies in this area employed a non‐confocal approach,31–33 which can lead to the penetration of laser beam up to a depth of 40 μm, leading to Raman signals being collected from well below the surface layer altering the peak intensities.34
Comparing the micro‐Raman spectra of the nano‐3YSZ with the submicrometre 3YSZ, it is apparent that the intensity of the monoclinic peaks was much smaller for the nanosample. This suggested that less transformation had occurred for the latter even though the yttria contents were the same, presumably due to the much finer grain size. The reduction in transformation will have reduced the ability for crack suppression and hence resulted in less transformation toughening, explaining the slightly lower toughness values obtained for the nano‐3YSZ compared to the submicrometre 3YSZ. In the case of the nano‐2YSZ, the monoclinic peak intensities were found to be higher than those of both the nano and submicrometre 3YSZ, indicating a higher amount of phase transformation and hence a higher indentation toughness.
Figure 4 reveals an indent generated in the nano‐1·5YSZ using a 30 kg load; although cracks were formed at the indent corners, they were very short compared to those in the submicrometre 3YSZ (Fig. 2a) and other yttria containing compositions indented at the reduced load of 10 kg. Figure 4 also highlights the stress patterns around the indent. Reece et al.31 suggested that such surface patterns were a combination of the effect of elastic relaxation during indenter unloading and dilatation associated with phase transformation. Kaliszewski et al.33 reported that during indenting, the martensitic transformation occurred in a localised zone around the indentation, giving rise to stress fields in the surrounding material due to volume misfit. Since the stress fields were visible even after the removal of the indenter, they assumed that the indentation induced deformation was accommodated by a permanent, non‐elastic mechanism. Bravo‐Leon et al.35 also reported similar indentation behaviour for nano‐1·5YSZ, although the latter was only 98% dense. They suggested that the slightly projecting lines surrounding the indentation area were the lines of maximum shear stress.
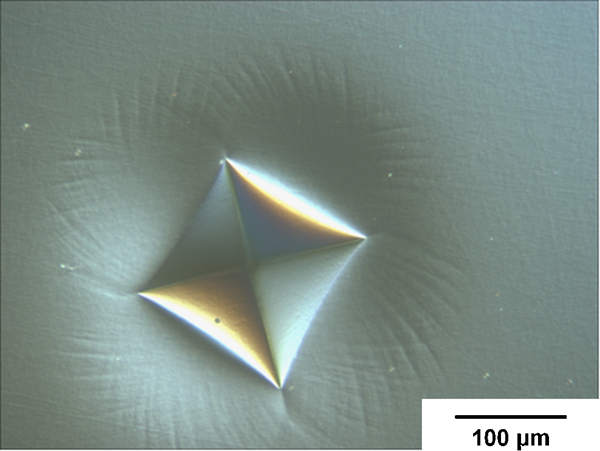
Differential interference contrast microscopic image of indent on nano‐1·5YSZ sample with 30 kg indentation load
The micro‐Raman spectra recorded for the nano‐1·5YSZ sample indented at loads of 10, 20 and 30 kg are shown in Fig. 5. It can be observed that the intensities of the monoclinic peaks are higher than those of all other yttria containing compositions at the same load, indicating a greater amount of phase transformation. This increased phase transformation resulted in higher indentation toughness for the nano‐1·5YSZ (Table 2). A comparison of the spectra obtained after indenting at 20 and 30 kg revealed that there was at least some monoclinic phase at all locations in and around the indent, with more monoclinic being present after use of the 30 kg load. This illustrated not only an increase in phase transformation with increased load but also an increase in the size of the transformation zone around the indent.
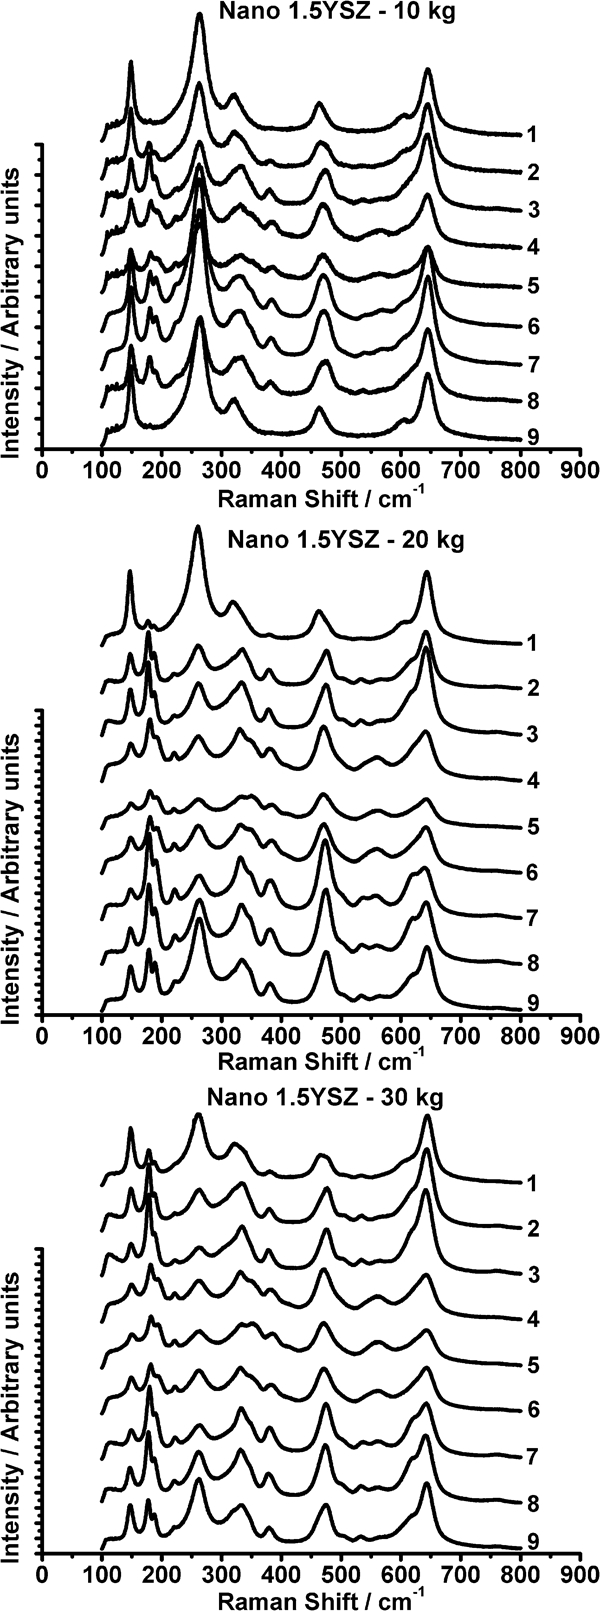
Micro‐Raman spectra of nano‐1·5YSZ sample after indenting at 10, 20 and 30 kg loads
The nano‐1·5YSZ sample indented using the 30 kg load was used to map the phase transformations in and around the indent (Fig. 6). It can be observed that there was a considerable amount of phase transformation around the indent; the presence of monoclinic phase close to the propagating cracks is also clearly distinguishable. One would expect the maximum phase transformation directly below the indent; however, the dilatation associated with the phase transformation enhances the residual tensile forces, which in turn enhances subsurface transformation and transformation around the indentation impression giving rise to higher monoclinic peak intensities.31 The monoclinic peak intensities in the indent are not influenced by the presence of subsurface monoclinic peaks, since the mapping is carried out using the confocal probe configuration. Thus, confocal micro‐Raman spectroscopy proved to be a very powerful technique for mapping the phase distribution of zirconia, which is not possible with other techniques such as XRD. It was also observed from the micro‐Raman mapping that the nano‐1·5YSZ samples displayed the maximum amount of transformation among all the compositions studied in the present work explaining the superior indentation toughness displayed by this composition.
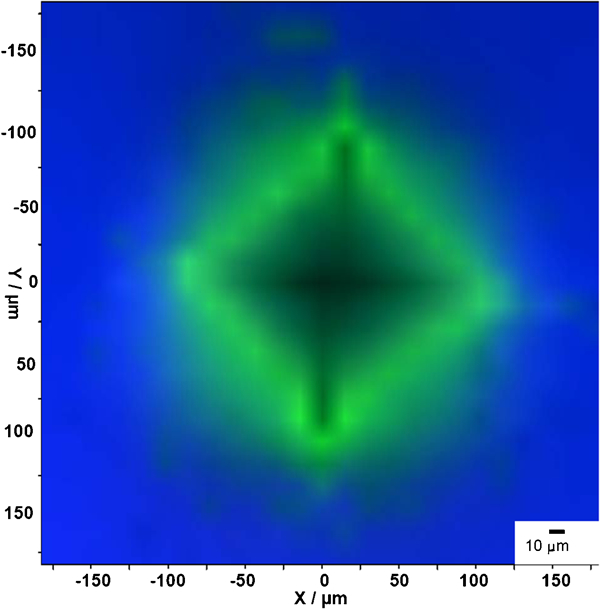
Micro‐Raman mapping of indentation induced phase transformation for 30 kg indented nano‐1·5YSZ sample: green colour represents presence of monoclinic phase
Conclusions
Confocal micro‐Raman spectroscopy and mapping have been employed successfully to study the spatial distribution of indentation induced phase transformations in nanozirconia with different yttria contents. The high spatial resolution achievable with the technique enabled the mapping of the transformed monoclinic phase in and around the cracks. No tetragonal peaks were observed for the nano‐0YSZ sample after indentation as expected, which resulted in the lowest toughness for these materials. The monoclinic peak intensity for the nanozirconia ceramics decreased as the yttria content increased from 1·5 to 3 mol.‐%. The intensities of the transformed monoclinic peaks were found to be directly related to the indentation toughness of the materials. The monoclinic intensity was found to be reduced for the nano‐3YSZ sample compared with the submicrometre 3YSZ; this is believed to be due to the increased phase stability of the former. The results of the mapping also confirmed that maximum transformation occurred in an area around the indent, not on a surface layer directly below it.