
Abstract
Titanium dioxide (rutile) is known as n-type semiconductor. Recent studies show that prolonged oxidation of pure n-type TiO2 may lead to its conversion into a p-type semiconductor. It has been documented that the conversion is associated with the formation of titanium vacancies. The present work derives the defect disorder model of TiO2, which explains the effect of oxygen activity on the concentration of all point defects, including titanium vacancies, and the related semiconducting properties. The derived defect diagram, plotting the concentration of all ionic and electronic defects in TiO2 within a wide range of oxygen activity [10–15 Pa<p(O2)<105 Pa], allows to predict the effect of oxygen activity on semiconducting properties of rutile within both n- and p-type properties. This diagram may be used in the selection of processing conditions of p-type TiO2 from n-type TiO2. The present work also considers the kinetic aspects related to the imposition of defect equilibria associated with titanium vacancies. The real chemical formula of rutile, representing the semiconducting properties within both n- and p-type regimes, is derived.
Keywords
Introduction
Rutile, TiO2 is a non-stoichiometric compound that is known as an n-type semiconductor. 1 Its non-stoichiometry is related to the Ti/O ratio and has been frequently represented by the formula TiO2−x (where x is the oxygen deficiency).
The rutile phase, TiO2, is well defined in terms of its crystalline structure. However, this structure is defected. Its properties, such as semiconducting and photocatalytic properties, are closely related to the concentration of point defects rather than the crystalline structure. 2 Therefore, the development of TiO2 based high performance photocatalysts requires correct understanding of defect chemistry of rutile.
Rutile may be reduced or oxidised within a single phase leading to the formation or removal of point defects. Reduction of TiO2 results in the formation of donor type defects: oxygen vacancies (predominant defects) and titanium interstitials (minority defects). 1 Their ionisation results in the formation of quasi-free electrons that are responsible for n-type charge transport.
The concentration of intrinsic point defects in rutile and its solid solutions is closely related to oxygen activity. Therefore, the effect of point defects on semiconducting properties can be assessed using defect diagrams plotting the concentration of the defects versus oxygen activity.
The first attempt to derive a quantitative defect chemistry model of rutile was made by Kofstad. 1 However, his diagram does not explain the n–p transition observed for rutile in oxidising conditions.3–6
The previous studies of the authors on defect related properties of rutile resulted in derivation of a defect disorder model, which was based on the following assumptions: 7
variation in oxygen activity results in a change of concentration of donor type defects, including oxygen vacancies and titanium interstitials
the effective concentration of acceptor type defects remains constant.
This defect model is consistent with three independently determined defect related properties,3–7 including:
The recent studies show, however, that prolonged oxidation of rutile leads to the formation and propagation of titanium vacancies, which are acceptor type defects.13,14 Their ionisation results in the formation of electron holes, which are associated with p-type conduction of rutile. Therefore, the real chemical formula of titanium dioxide, reflecting the non-stoichiometry in both oxygen and titanium sublattices, is better represented as Ti1±yO2−x. 2 Consequently, correct description of the properties of rutile requires derivation of defect disorder diagrams, which include titanium vacancies. This is the aim of the present work.
While titanium vacancies are thermodynamically reversible, their diffusion rate is extremely slow. Therefore, in commonly applied equilibration experiments lasting few hours at 1000–1500 K, their concentration remains practically constant.13,14 It takes approximately 4000–6000 h to impose the equilibrium concentrations of titanium vacancies at 1123–1323 K in a slab ∼2 mm thick.
It has been documented that titanium vacancies are responsible for p-type properties of pure TiO2 (Refs. 2 and 7) and photoreactivity with water. 15 So far, however, the effect of titanium vacancies on semiconducting properties of rutile has not been addressed. Therefore, this work attempts to address the following questions:
what is the effect of point defects, including titanium vacancies, on semiconducting properties of rutile?
what is the real chemical composition of rutile?
how performance related properties of rutile, including photoreactivity, may be enhanced using defect engineering?
Postulation of problem
Scientific aspect
Titanium dioxide is the promising compound for solar energy conversion.16–19 The photocatalytic properties of TiO2 are frequently associated with its electronic and crystalline structure, such as rutile.20,21 Similar studies, which aim to assess the effect of noble metal loading on photocatalytic performance of rutile,22–25 fail to recognise that the rutile phase is non-stoichiometric and, consequently, this effect depends not only on the surface structure but also on the titanium to oxygen ratio for the rutile phase. Therefore, data on photocatalytic properties of rutile based systems are well defined only when the rutile phase itself is well defined in terms of its non-stoichiometry and the related defect disorder.
Recent studies have documented that the photoreactivity of rutile with water is closely related to defect disorder. 2 Therefore, the development of TiO2 based systems for solar energy conversion requires to address the following problems:
derivation of defect chemistry models and the related diagrams
establishment of the effect of defect disorder on semiconducting properties, as semiconducting properties of rutile are determined by the concentration of point defects rather than its crystalline structure2,7
establishment of the relationship between semiconducting properties and photoreactivity. Photoreactivity of rutile is determined by its ability to charge transfer, which is closely related to semiconducting properties 15
the reported data for rutile doped with aliovalent ions lead to the formation of systems, which are not well defined.26,27 Knowledge of the diffusion rate of point defects is essential in the formation of well defined photocatalytic systems
it is a common practice to report data on photocatalytic properties of TiO2 that are compared with that for commercial specimens (made by Degussa, Kerr-McGee and Millennium Chemicals) as standards. However, the manufacturers do not provide the information about the titanium to oxygen ratio or semiconducting properties of their products. Therefore, there is a need to develop the rutile phase that is well defined and may be used as a standard.
Applied aspect
Yoneyama et al. 28 and subsequently Nozik 29 have shown that a substantial increase in the solar to chemical energy conversion efficiency may be achieved in a photoelectrochemical cell eqipped with two photoelectrodes, instead of one. Their photocells were using n-GaP and p-GaP as photoanode and photocathode respectively. However, the observed high performance was rapidly decreasing due to photocorrosion of these photoelectrodes in an aqueous electrolyte. Therefore, the formation of p-type TiO2 paves the way for the construction of a biphotoelectrochemical cell equipped with two photoelectrodes made of TiO2, which is resistant to corrosion and photocorrosion in water.
In conclusion, derivation of a full defect disorder model of rutile, including titanium vacancies, is essential in correct description of semiconducting properties of this phase, including both n- and p-type regimes, and to address the postulated problems. The derivation of the diagrams is preceded by a short discussion related to the formation and diffusion of titanium vacancies in rutile. First of all, however, we provide the definitions of basic terms and relationships.
Definition of basic terms and relationships
The basic defect equilibria and the associated relationships between the concentration of defects and oxygen activity for rutile and its solid solutions have been derived before. 2 They will be briefly summarised in this section.
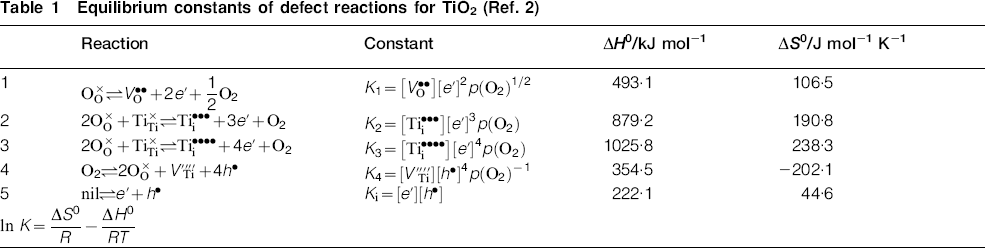
The formation of point defects is represented, using Kröger–Vink notation, 30 in Table 1, in terms of defect reactions and the related equilibrium constants.
Equilibrium constants of defect reactions for TiO2 (Ref. 2)
The defect disorder must satisfy the charge neutrality, which requires that
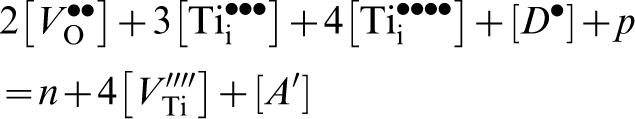
For the sake of simplicity, further considerations will be limited to pure TiO2. Consequently, the condition expressed by equation (1) may be represented in the following form

Defect disorder based on simplified charge neutrality
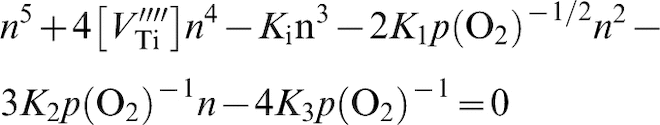
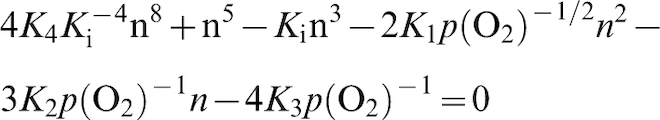
The defect related data of rutile have been commonly determined after the equilibration during 1–2 h at 1000–1500 K. In such conditions, titanium vacancies are quenched and their concentration remains constant. In this case, the relation between n and p(O2) may be transformed into a polynomial form
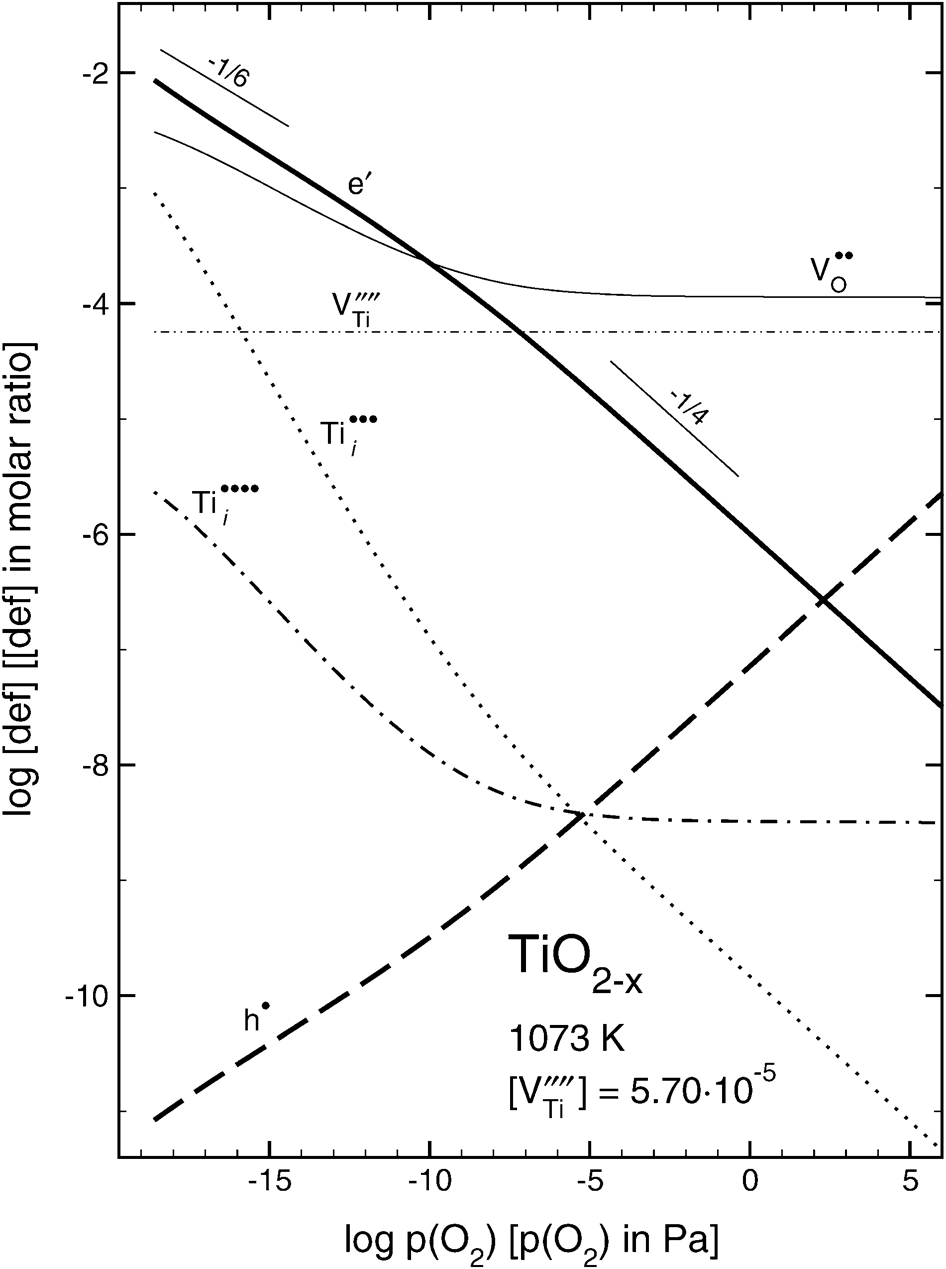
Simplified defect diagram for pure TiO2 at 1073 K and at constant concentration of titanium vacancies
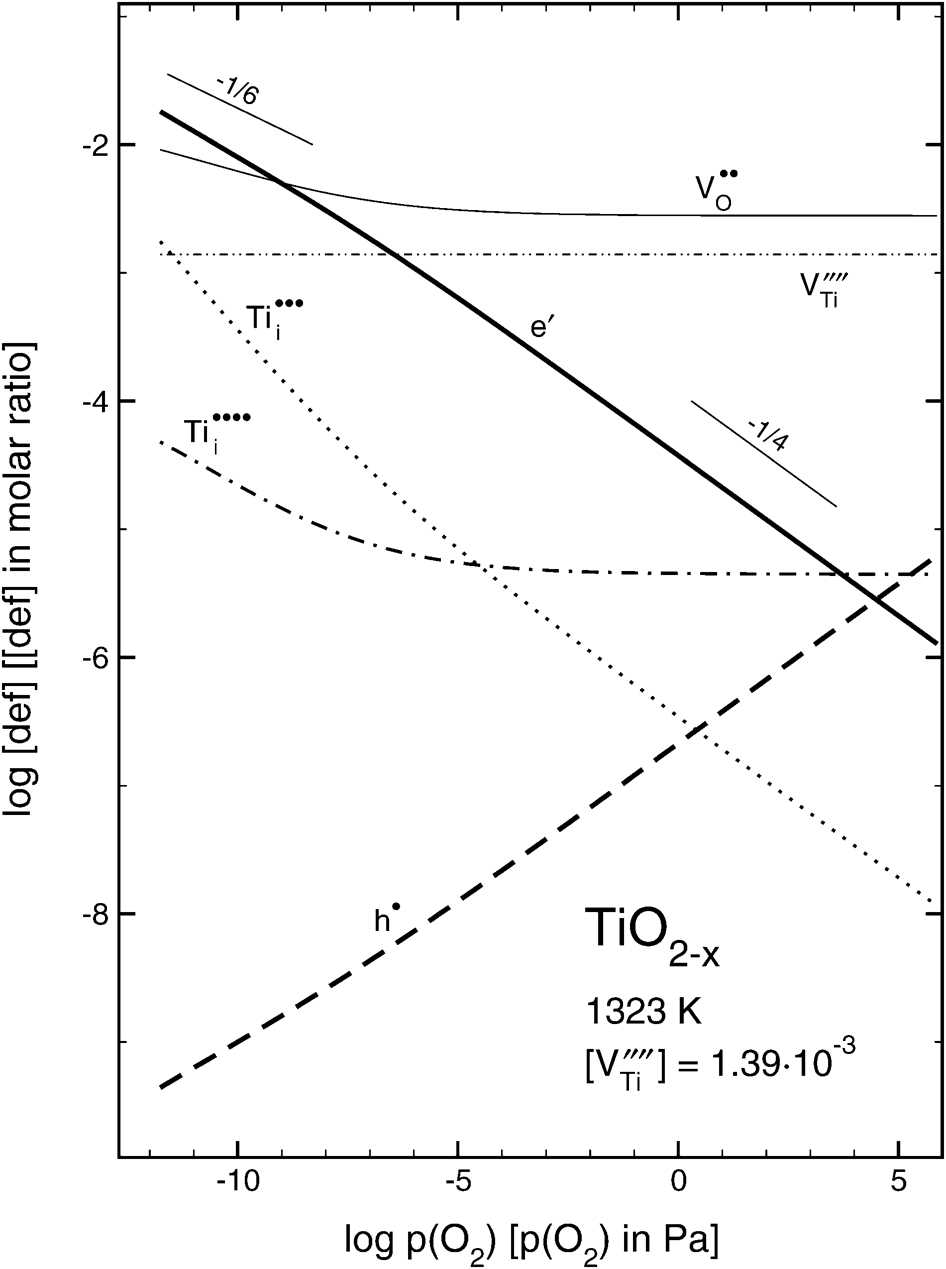
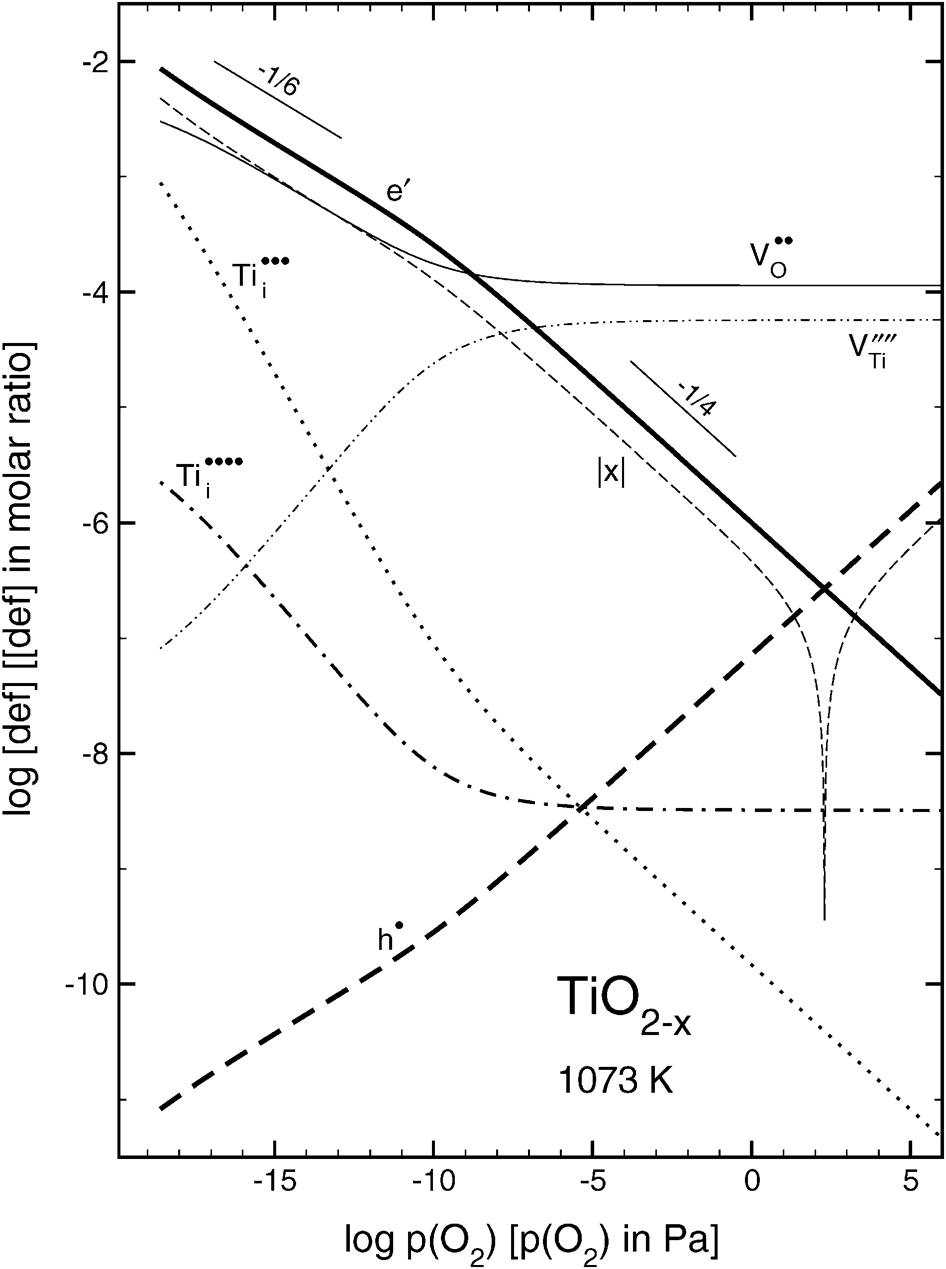
Simplified defect diagram for pure TiO2 at 1323 K and at constant concentration of titanium vacancies
the concentration of electrons and electron holes intersect at p(O2) = 102 Pa and p(O2) = 104 Pa at 1073 and 1323 K respectively. These intersections indicate that cooling results in a shift of the n–p transition point to lower oxygen activity by two orders of magnitude
the slope of log n versus log p(O2) changes from −1/6 in strongly reduced conditions to −1/4 at higher oxygen activity
the predominant defects are oxygen vacancies; however, titanium interstitials may have an effect on properties of TiO2 in extremely reducing conditions.
The defect disorder shown in Figs. 1 and 2 represents the effect of oxygen activity on the concentrations of all reversible defects that exhibit high mobility in the TiO2 lattice, including oxygen vacancies and titanium interstitials. This assumption is valid in commonly reported processing conditions when TiO2 is equilibrated within several hours in the temperature range 1000–1500 K. However, longer equilibration (oxidation/reduction) results in a change of the concentration of titanium vacancies as well.
The defect disorder represented by the diagrams shown in Figs. 1 and 2 will be termed simplified defect disorder.
Effects of titanium vacancies on properties of rutile
n–p transition
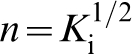
The effect of titanium vacancies on properties of TiO2 may be considered in terms of their effect on the position of the n–p transition point. At the oxygen activity corresponding to the condition n = p, denoted here as p(O2)n = p, the concentration of electrons may be expressed as
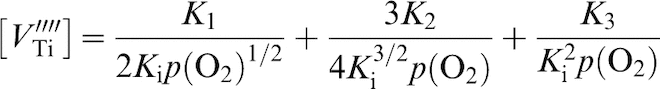
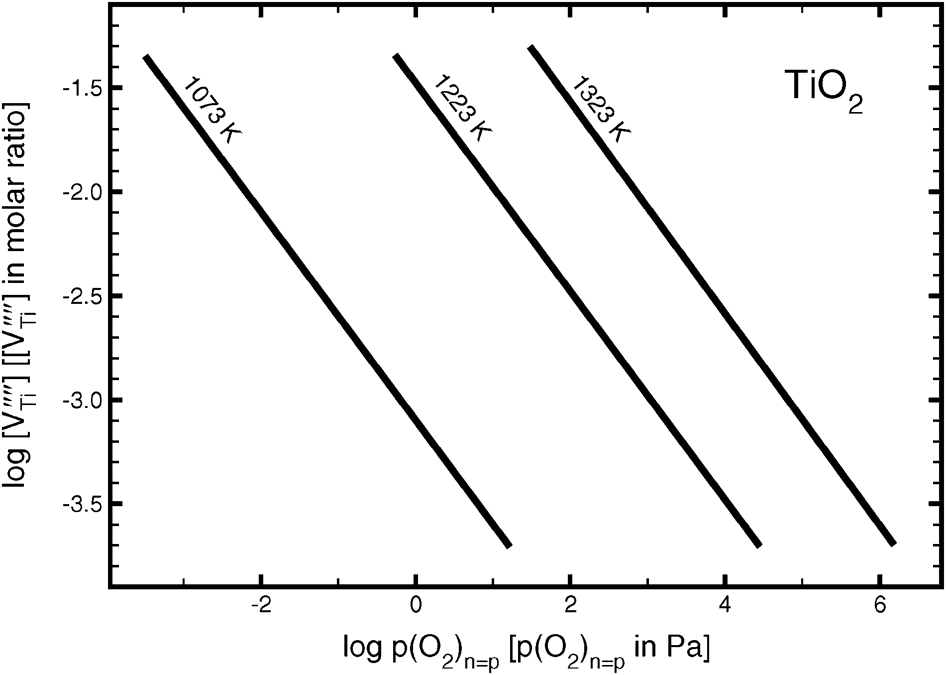
Dependence of concentration of titanium vacancies on oxygen activity corresponding to n–p transition in pure TiO2
Kinetics
Like any oxide, TiO2 reacts with oxygen. The reactivity (oxidation or reduction) results in a shift of equilibria listed in Table 1. The newly imposed defects at the gas/solid interface then propagate into the bulk phase leading to the imposition of new equilibrium. The related equilibration kinetics can be considered in terms of two kinetic regimes:13,14
kinetic regime I. This regime corresponds to the transport of fast defects: oxygen vacancies and titanium interstitials. The equilibrium established in this regime is termed operational equilibrium
kinetic regime II. The kinetics in this regime is determined by the diffusion of titanium vacancies that is extremely slow. The equilibrium established in this regime is termed full equilibrium.
The equilibration kinetics of rutile may be monitored using the measurements of electrical conductivity. The oxidation kinetics within these two regimes for high purity TiO2 single crystal at 1123 and 1323 K is represented in Fig. 4.
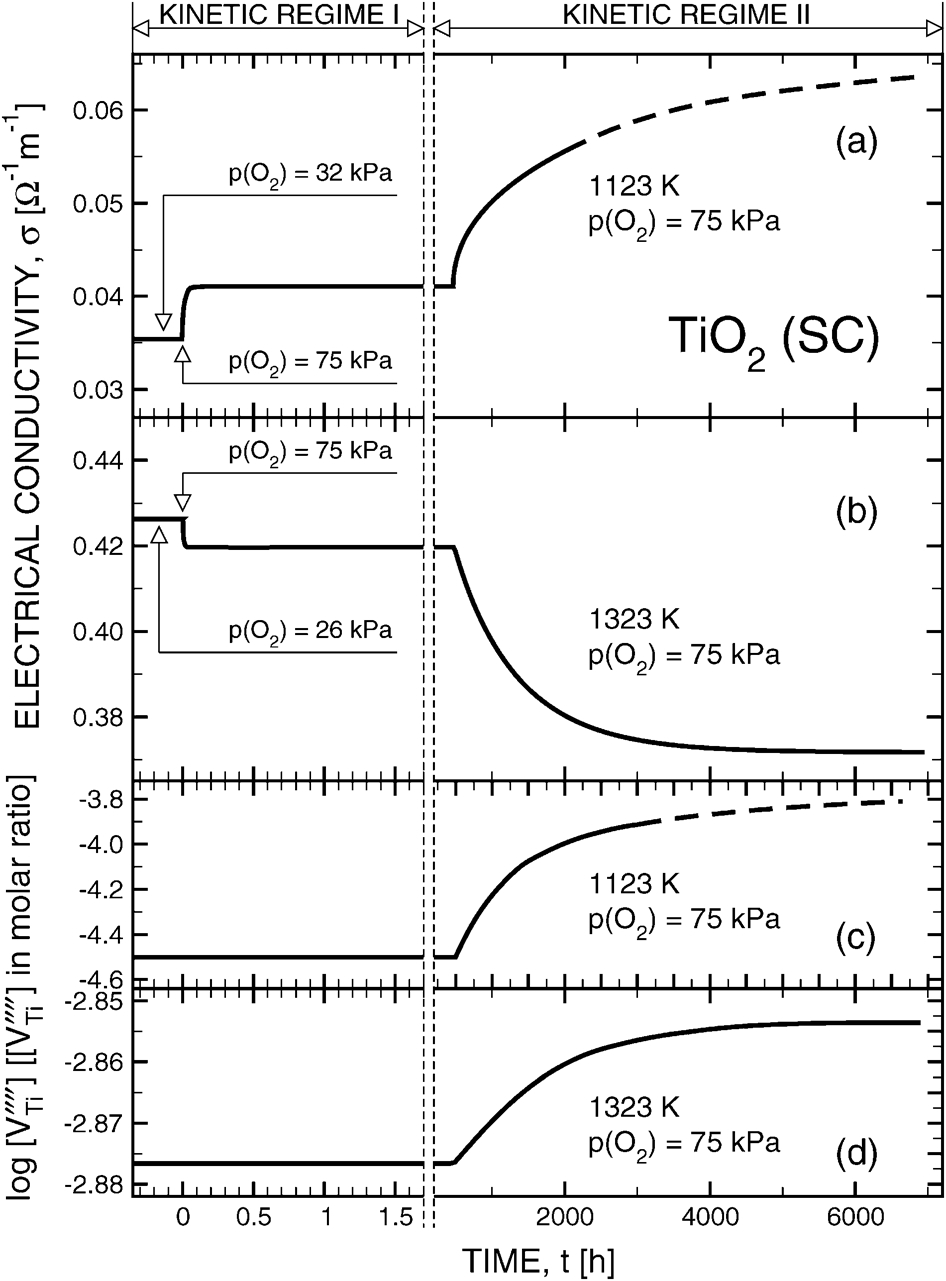
Isothermal equilibration kinetics at a 1123 K and b 1323 K in kinetic regimes I and II, and related changes in concentration of titanium vacancies at c 1123 K and d 1323 K
TiO2 is known as an n-type semiconductor. According to thermoelectric power data, this is the case in reduced conditions. However, at higher oxygen activity, TiO2 also exhibits p-type properties. In the latter case, its chemical composition is better expressed by the formula either TiO2+x or Ti1−xO2. Prolonged oxidation, leading to the increase in the concentration of titanium vacancies, results in the increase in concentration of electron holes (minority type charge carriers) and, consequently, leads to a shift of the n–p transition towards lower values of oxygen activity. 32
The n–p transition point is an important quantity as it demarcates the regimes in which TiO2 posseses different majority charge carriers. Therefore, knowledge of the concentration of titanium vacancies and the procedures leading to its changes is an important matter in processing well defined TiO2.
Full charge neutrality
The diagrams in Figs. 1 and 2 were derived on the assumption that the changes of oxygen activity result in variation in the concentration of all point defects, except of titanium vacancies. Therefore, these diagrams correspond to operational equilibrium at the arbitrary chosen concentration of titanium vacancies. Consequently, these diagrams may not reflect the properties of rutile specimens, which were subjected to prolonged oxidation.
The equlibrium constant related to the formation of titanium vacancies reported elsewhere
7
may be used for derivation of defect disorder with variable concentration of titanium vacancies. The combination of the equilibrium constants listed in Table 1 and the electroneutrality condition (equation (2)) results in the relationship between the concentration of electrons and oxygen activity
Full defect diagram for pure TiO2 at 1073 K, showing concentrations of all defects and deviation from stoichiometry x as function of oxygen activity
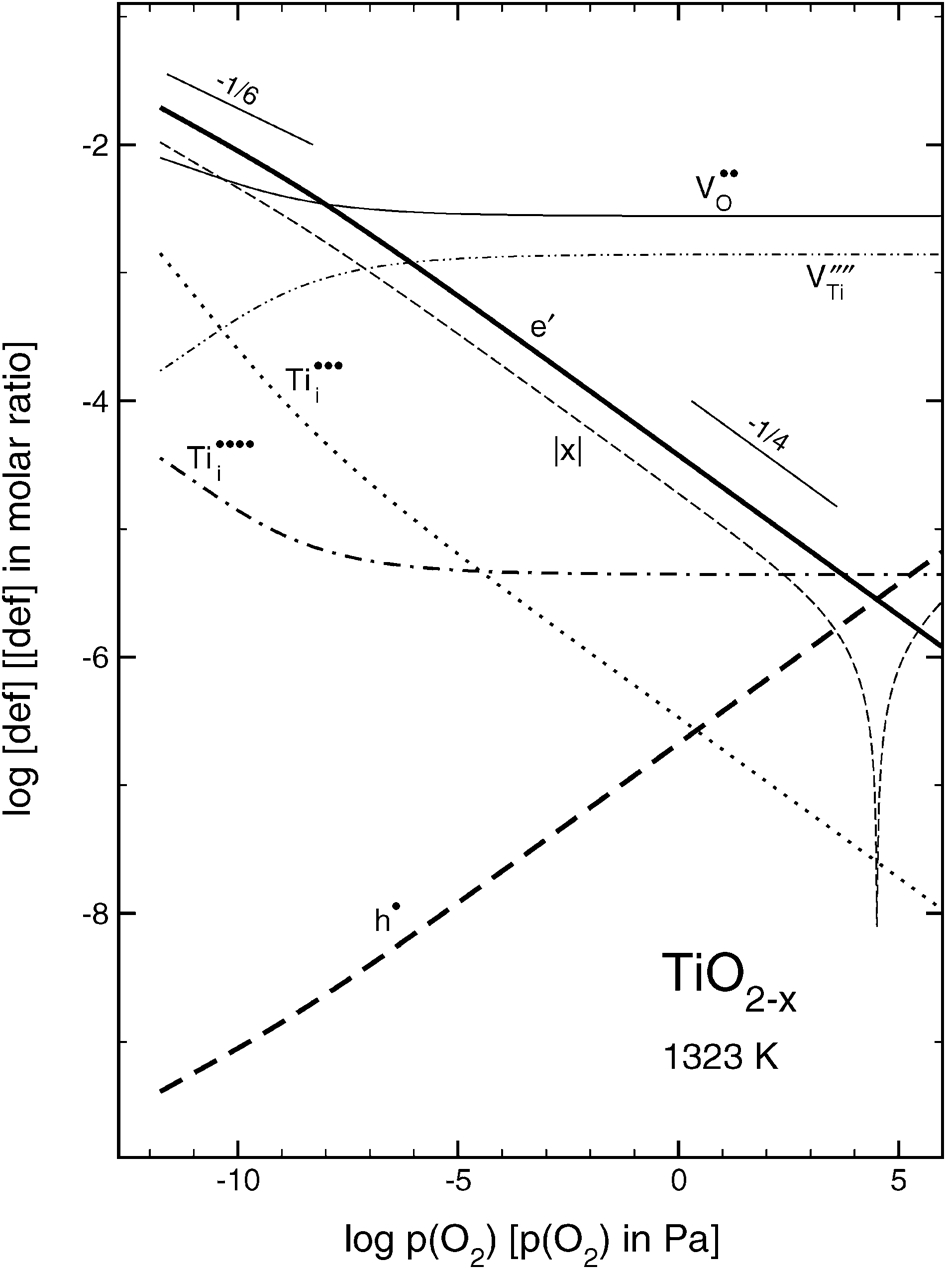
Full defect diagram for pure TiO2 at 1323 K, showing concentrations of all defects and deviation from stoichiometry x as function of oxygen activity
Fully equilibrated versus semiquenched system
The comparison of defect diagrams determined from equation (3), Figs. 1 and 2, and from equation 6, Figs. 5 and 6, indicates that the difference between the absolute values of defect concentrations, and their dependence on oxygen activity, is not substantial. However, in both cases we compare defect disorders at comparable concentrations of titanium vacancies:
the diagrams in Figs. 1 and 2 are derived at constant concentration of titanium vacancies that was intentionally chosen to be close to that of the gas/solid equilibrium in oxidising conditions
the diagrams in Figs. 5 and 6 are derived for variable concentrations of titanium vacancies that depend on oxygen activity.
Consequently, Figs. 5 and 6 represent the rutile phase annealed respectively at 1073 and 1323 K for a very long time, until full equilibrium was reached. This is frequently not the case because due to practical reasons the specimens are equilibrated with respect to fast defects (oxygen vacancies and titanium interstitials) while the content of titanium vacancies established at elevated temperatures is quenched. Therefore, let us consider the effect of quenching on the concentration of titanium vacancies from the level of 1323 to 1073 K.
The diagram in Fig. 6 represents the defect disorder in full equilibrium at 1323 K. As seen, the related concentration of titanium vacancies remains constant within a wide range of oxygen activities, at the level of 1·39×10−3 (molar ratio). This concentration will be termed the standard 1323 K equilibrium level
 . The applied cooling procedure should be slow enough to allow imposition of equilibrium concentration of fast defects (oxygen vacancies and titanium interstitials), but also fast enough to quench the concentration of titanium vacancies. Such cooling corresponds approximately to the rate of 100 K h−1. This rate of cooling will be termed operational cooling.
Figure 7 represents the defect disorder at 1073 K for the rutile phase equilibrated initially at 1323 K and then cooled down, following the operational cooling, to the level of 1073 K. As seen, the n–p transition point in full equilibrium is at p(O2) = 102 Pa (Fig. 5). On the other hand, n–p transition point for the specimen quenched from 1323 K and containing the
 concentration of titanium vacancies is ∼1 Pa. This difference results from the decrease in the concentration of electrons and related increase in the concentration of electron holes, as shown in Fig. 8.
Defect diosrder model for pure TiO2 at 1073 K, representing effect of oxygen activity on concentration of defects at constant concentration of titanium vacancies equal to
after operational cooling
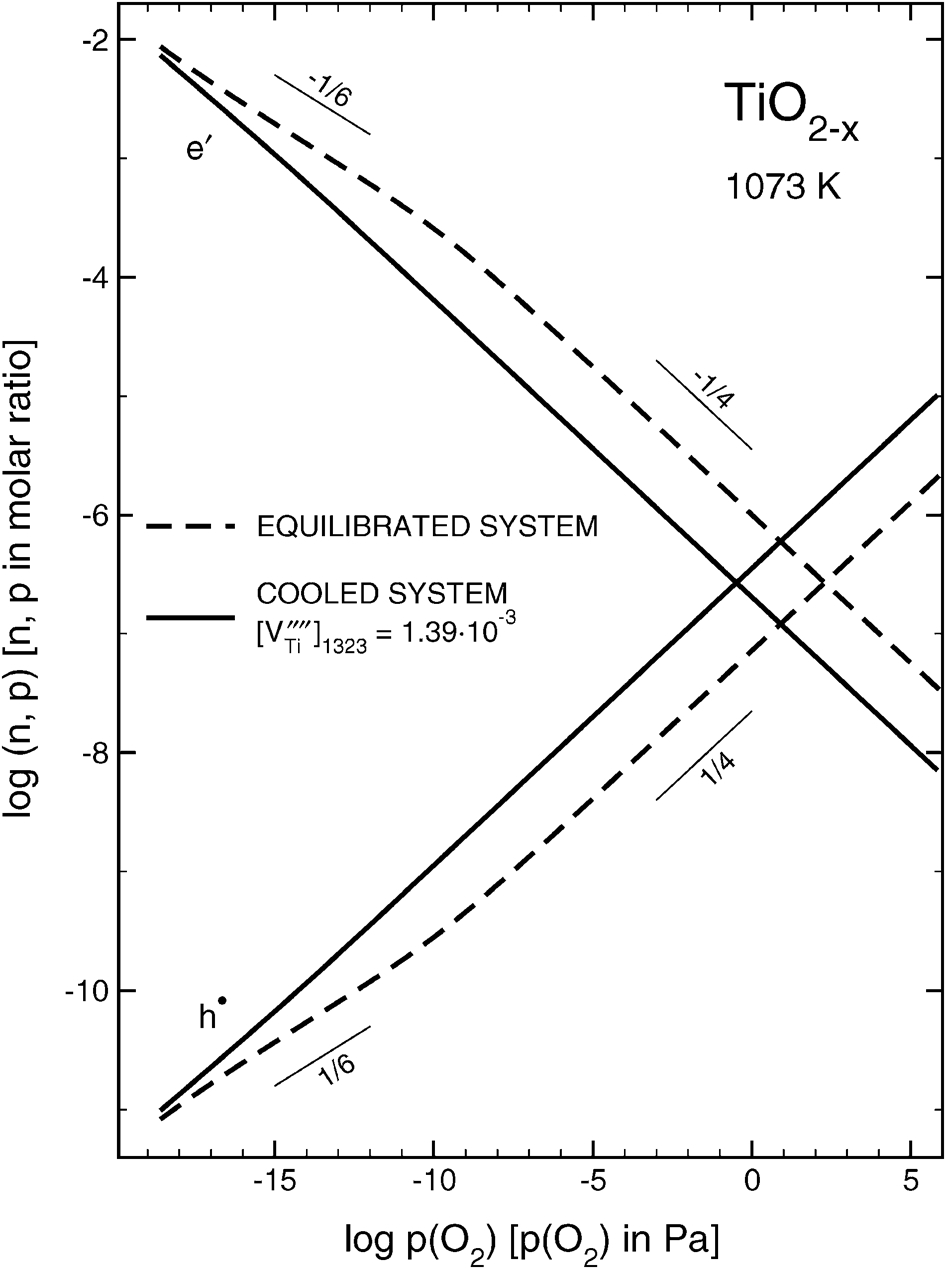
Effect of oxygen activity on concentrations of electronic defects in pure TiO2 at 1073 K, including data corresponding to full equilibrium (dashed lines) and after operational cooling from 1323 K (solid lines)
As seen in Fig. 8, the operational cooling results in a substantial decrease in the concentration of electrons (and equivalent increase in the concentration of electron holes) leading, consequently, to a shift of the n–p transition point to a lower value of oxygen activity. The effect of operational cooling increases with a decrease in the final temperature (Fig. 9). Such phenomena may be used for controlled modifications of semiconducting properties of rutile.
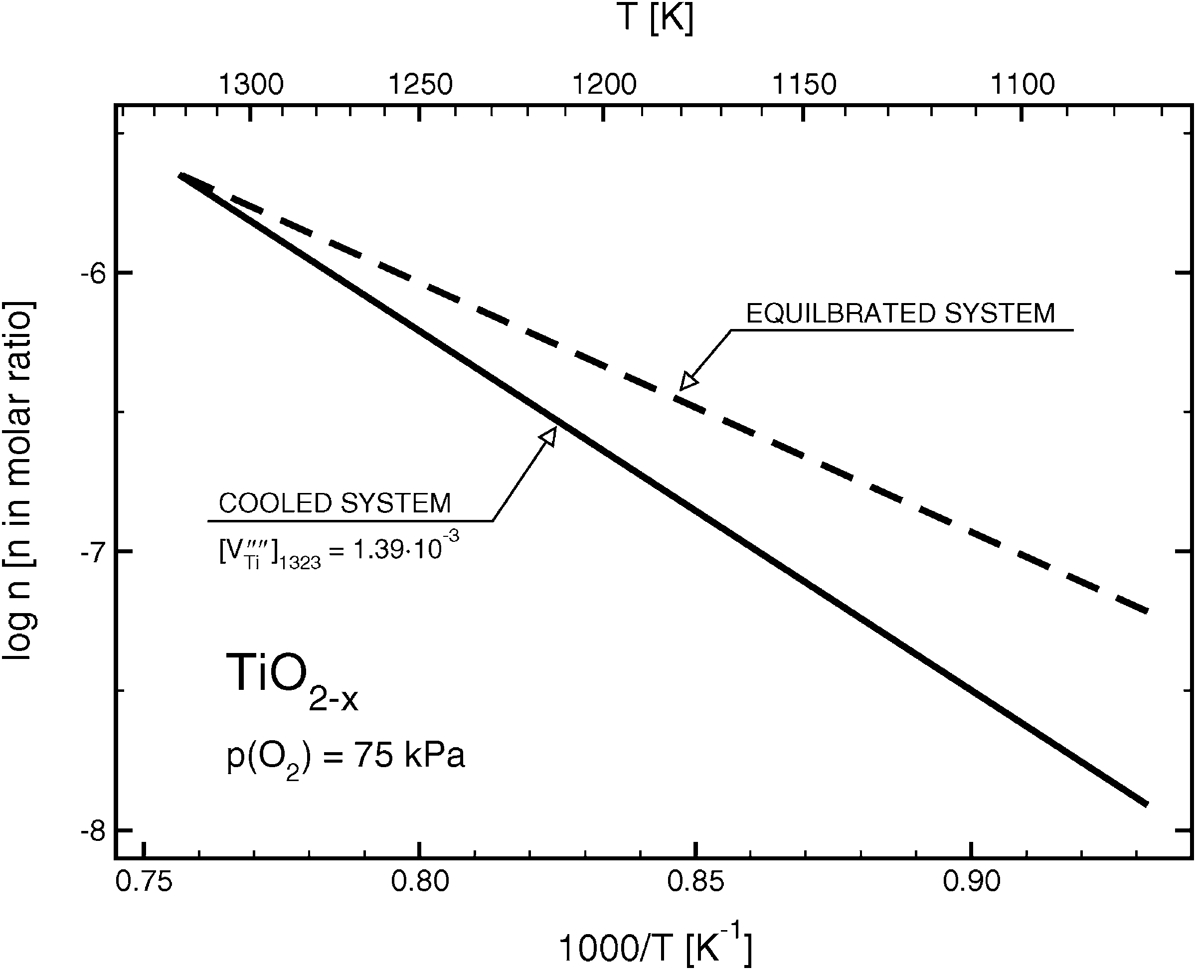
Arrhenius plot of concentration of electrons in oxidising conditions for pure TiO2, including data corresponding to full equilibrium (dashed line) and after operational cooling (solid line)
According to Fig. 10a, the operational cooling results in an increase in the concentration of oxygen vacancies by over one order of magnitute, compared with fully equilibrated system. This effect is consistent with the charge neutrality requirement, since oxygen vacancies are mainly compensated by titanium vacancies (cooling results in an increase in their concentration, above the equilibrium level at 1073 K).
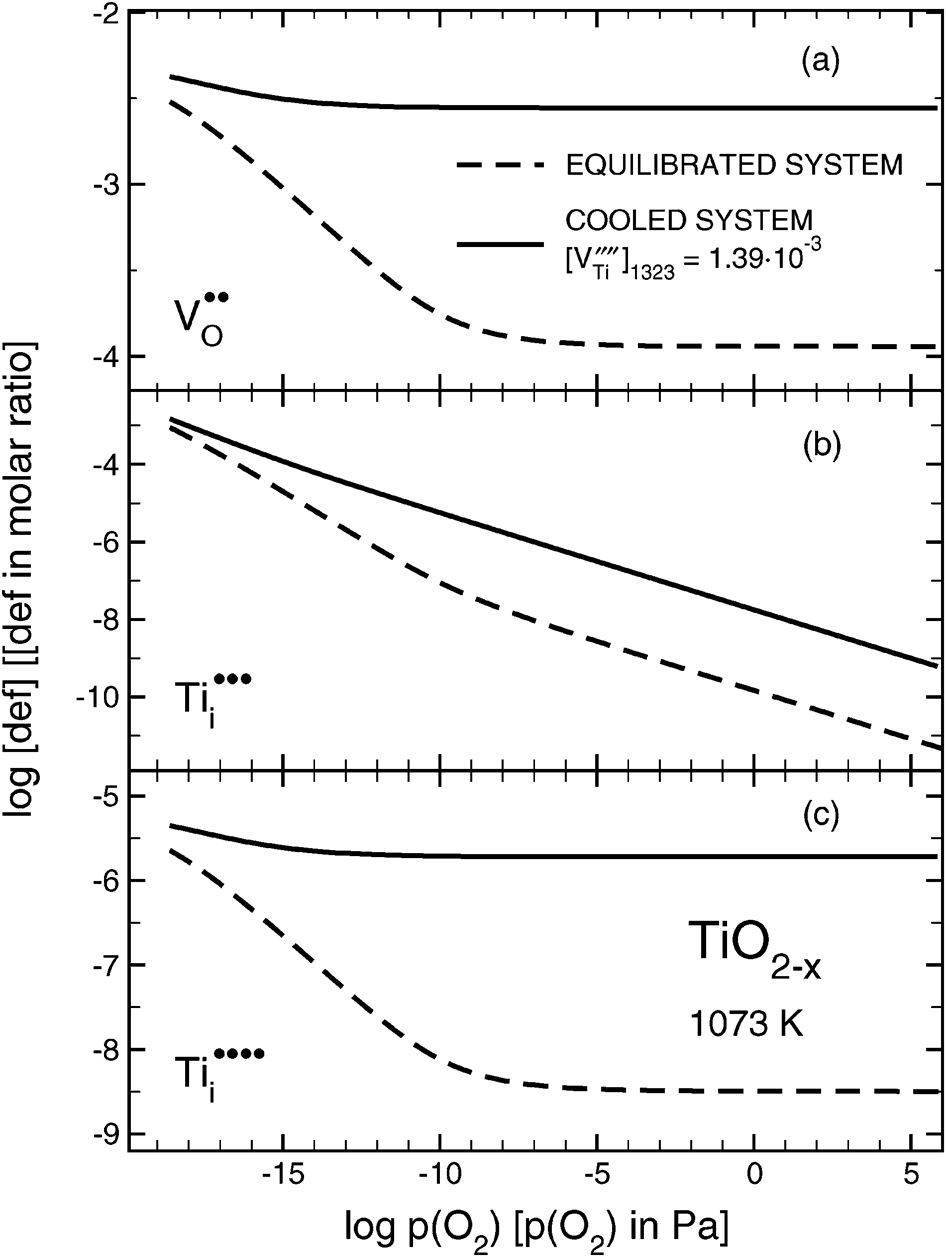
Isothermal effect of oxygen activity on concentration of fast defects at 1073 K for pure TiO2, including data corresponding to full equilibrium (dashed lines) and after operational cooling (solid lines)
The similar effects of the operational cooling on the concentration of trivalent and tetravalent titanium interstitials are shown in Fig. 10b and c respectively. In this case, cooling results in an insignificant change in the concentration of trivalent and a substantial change in the concentration of tetravalent titanium interstitials. This effect is consistent with the lattice charge compensation requirement.
As seen in Fig. 11, the operational quenching results in an increase and decrease in non-stoichiometry in the n- and p-type regimes respectively. These effects are related to the increased concentration of oxygen vacancies and titanium vacancies respectively.
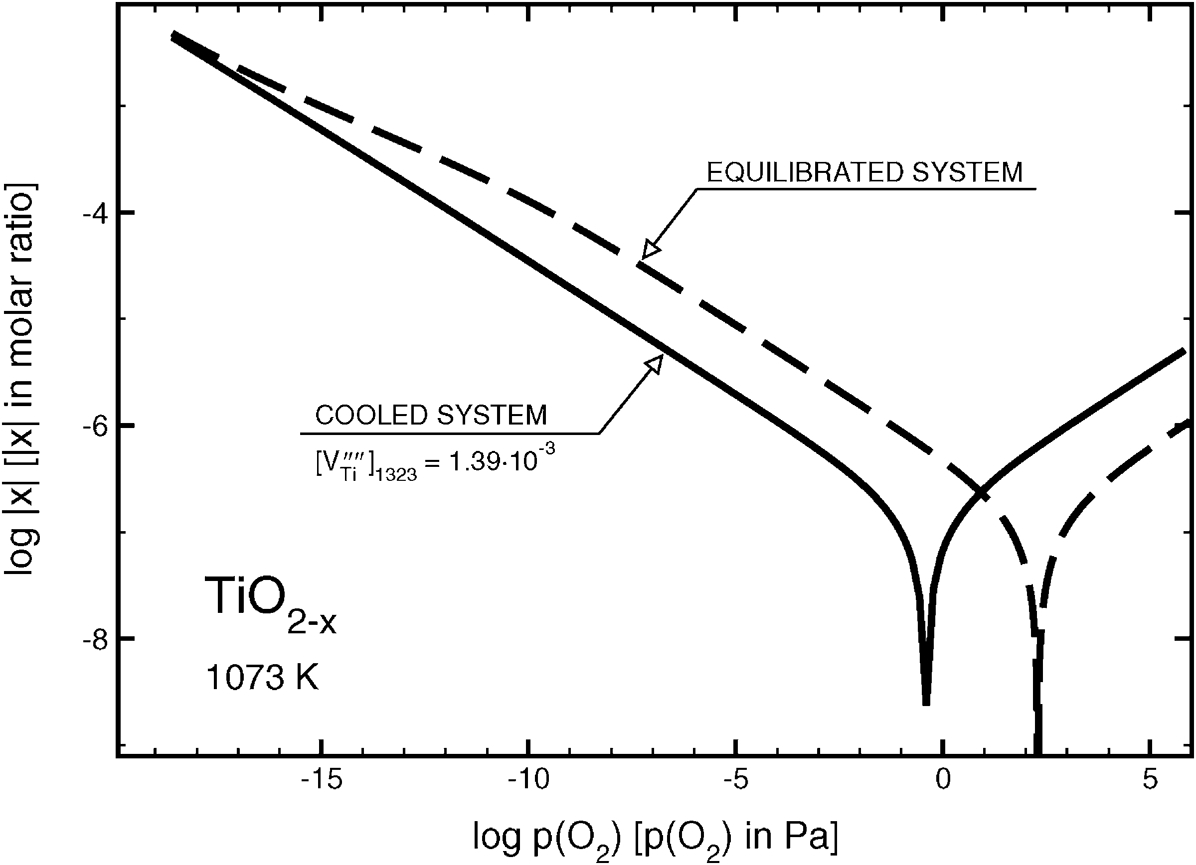
Deviation from stoichiometry x as function of oxygen activity for pure TiO2 at 1073 K, comparing fully equilibrated system and system after operational cooling
Experimental verification
The aim of this section is to compare the derived defect diagrams with the experimental data of defect related properties, including electrical conductivity and thermoelectric power, obtained for high purity single crystal and polycrystalline TiO2.3–6 Although the diagrams presented in this paper were constructed for temperatures 1073 and 1323 K as an example, similar diagrams may be developed for any temperature within the validity limit of the equilibrium constant in Table 1. The experimental data used for this illustration were determined at 1223 K.
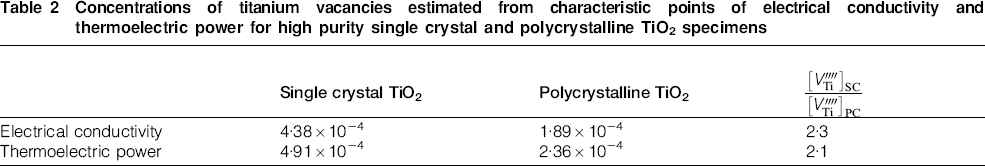
The effects of oxygen activity on electrical conductivity σ and thermoelectric power S of TiO2 are shown in Figs. 12 and 13 respectively. The distinctive minima of electrical conductivity and the zero value of thermoelectric power demarcate the regions of p-type properties of TiO2. These characteristic features were used to estimate the oxygen activity corresponding to the condition: n = p. That, in turn, allows to find out the related concentrations of titanium vacancies in the examined specimens (Table 2).
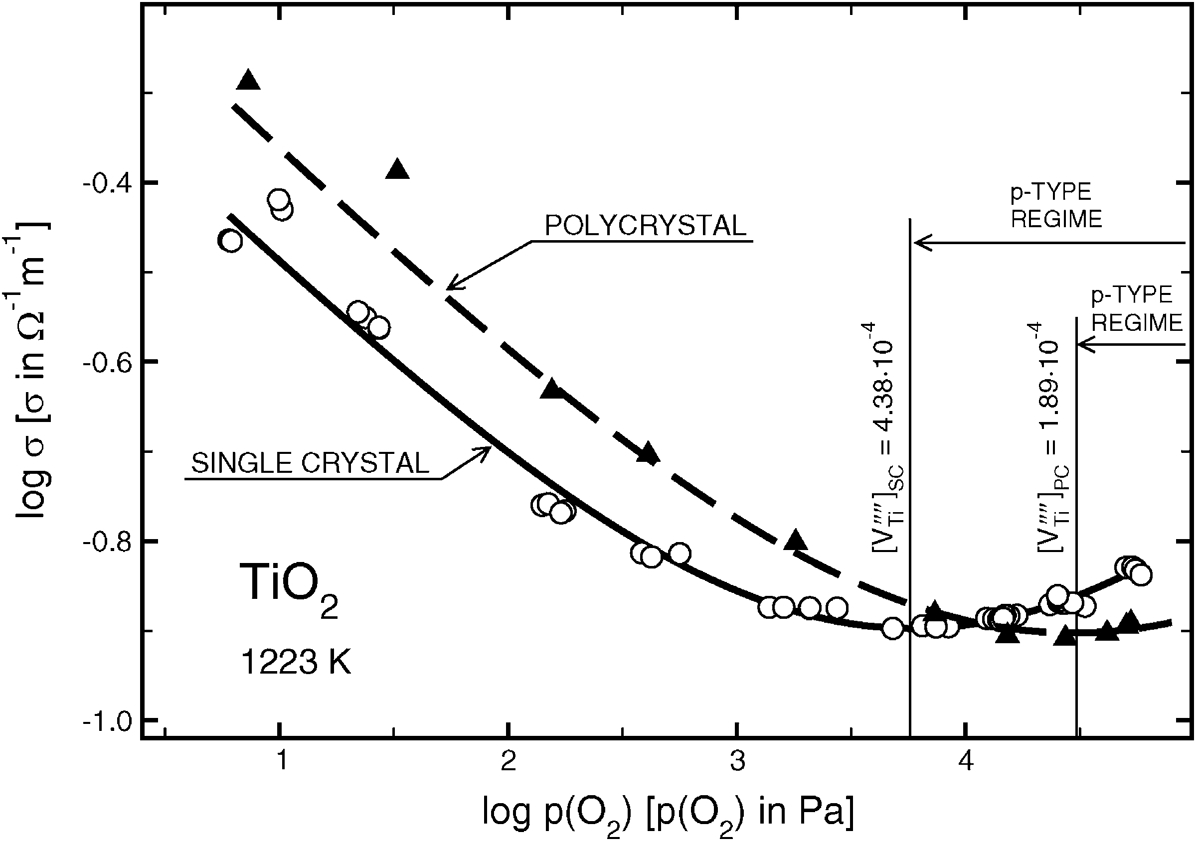
Dependence of electrical conductivity on oxygen activity for single crystal and polycrystalline TiO2 at 1223 K
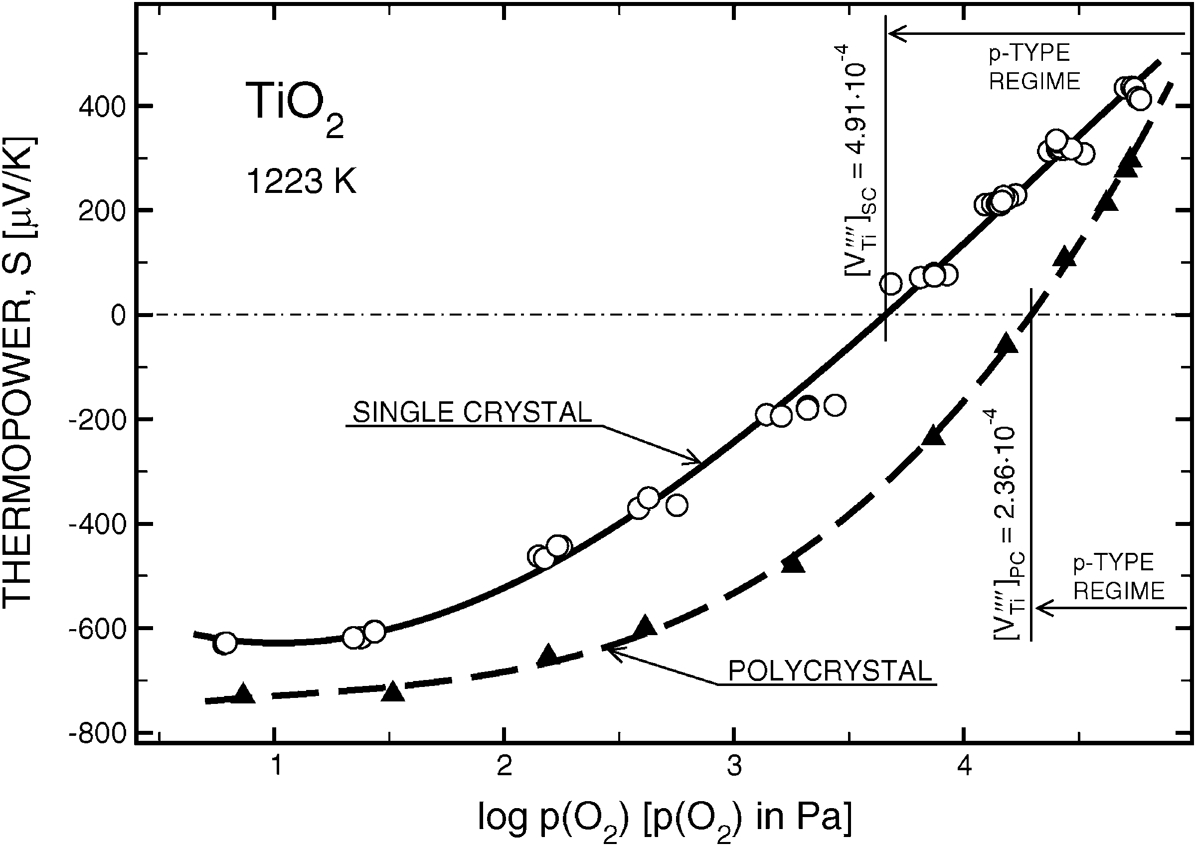
Dependence of thermoelectric power on oxygen activity for single crystal and polycrystalline TiO2 at 1223 K
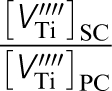
Concentrations of titanium vacancies estimated from characteristic points of electrical conductivity and thermoelectric power for high purity single crystal and polycrystalline TiO2 specimens
The obtained results allow to make the following conclusions:
the concentrations of titanium vacancies determined using electrical conductivity and thermoelectric power data are different. Since the n–p transition point determined from thermoelectric power (S = 0) is not influenced by the mobility term, the last values are probably more accurate
the concentrations of titanium vacancies are higher, by the factor of ∼2, in the single crystal specimen, compared with the polycrystalline sample. One should expect that this difference is related to different processing conditions, including the gas phase composition, temperature and time of annealing. It seems that the conditions associated with the crystal growth are more favourable for enhanced penetration of titanium vacancies.
Chemical formula
Taking into account the equilibria listed in Table 1, the lattice of TiO2 may be represented by the following general formula
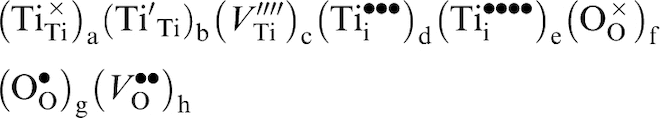
conservation of the ratio of lattice sites
the lattice charge neutrality condition requires that the charges associated with all lattice species are fully compensated electrically

The effective deviation from stoichiometry x shown in Figs. 5–7 and 11, according to the present nomenclature is defined as
This allows to process a wide range of TiO2 semiconductors with controlled properties, which are needed for specific applications.
Conclusion
This work derived two kinds of defect disorder diagrams of rutile.
The diagrams plotting the concentration of fast defects (oxygen vacancies and titanium interstitials) as a function of oxygen activity, at constant concentration of titanium vacancies (Figs. 1,2 and 7). These diagrams allow to determine defect disorder for specimens after operational cooling.
The diagrams plotting the concentration of all point defects, including titanium vacancies, as a function of oxygen activity. These diagrams, however, are valid only for specimens after prolonged oxidation (Figs. 5 and 6).
The derived defect diagrams may be used as a guide for the selection of optimal processing conditions of pure TiO2−x with the aim to impose controlled defect disorder and desired semiconducting properties including both n- and p-type regimes. The derived models may also be used for the conversion of TiO2 solid solutions into n- and p-type TiO2 semiconductors with controlled Fermi level.
The chemical formula derived for rutile reflects its complex chemistry and the related properties, which can be modified in a controlled manner.