
Abstract
A combined dilatometer and mass spectrometer unit is used to examine the high temperature species that appear during the sintering of strontium titanate. Two regions of evolved gas are identified. In the temperature range from 400 to 900°C, carbon dioxide and fragments related to its cracking are observed; these species are assigned to the decomposition of organic species and trace strontium carbonate. In the temperature range of 800–1400°C, species are identified that can be assigned to the evolution of SO2, possibly arising from celestite used in the synthesis scheme. Species identification was achieved by using tabulated cracking patterns and natural isotopic abundancesby, by obtaining cracking patterns from a known gas (CO2) and by using model compounds (KHCO3, SrCO3 and SrSO4), which evolve the suspected species at elevated temperature.
Introduction
The identification of gas phase species that are evolved when inorganic materials are heated to high temperature has been carried out over the last 40 years by a number of techniques, which have been reviewed and summarised elsewhere.1–5 In one approach, a Knudsen diffusion cell containing an inorganic material is heated, and the reaction products evolved into the gas phase are either trapped for subsequent analysis or monitored directly by a mass spectrometer (MS). A second technique has used a carrier gas flowing across a sample to transport the evolved species for analysis. The former type of measurement is made under conditions corresponding to chemical equilibrium, whereas the latter type may not correspond to chemical equilibrium but, instead, may represent non-equilibrium environments, such as those found in furnaces during sintering.
The types of reactions4–38 which may occur at elevated temperature include the decomposition or dissociation of inorganic material, the volatilisation of sintering aids or other additives and the removal or modification of native surface layers, which may differ from the bulk composition. In addition to the reactions that arise from the sample itself, the furnace environment may participate in or catalyse reactions;39 the gas phase is thus changed, which may influence sintering kinetics, sample composition and microstructural development.
Although high temperature dilatometers26–35 and MSs13,15–17,33,34 have been used separately, these techniques have not been routinely combined to simultaneously monitor the gas phase during sintering. To highlight the potential utility of such measurements, Ness and Rafaniello25 have examined the origin of density gradients in β-silicon carbide bodies by monitoring during sintering the evolution of CO with a gas chromatograph (GC). With this approach, they were able to correlate CO evolution with low sintered density. In another study, Carroll et al.37 monitored CO evolution during the sintering of nanophase SiC/Si3N4 to optimise the material density. Both studies highlight the utility of using information about the gas phase to rationalise the sintering behaviour and ultimately the microstructural development.
We have also examined, as a model system, the decomposition and sintering of calcium carbonate at different heating rates. To do this, a combined dilatometer/MS (CDMS) system,38 connected with a transfer tube and a leak valve, was used. The kinetics of decomposition, as measured by CO2 evolution, were then analysed by integral kinetic methods, and a decomposition activation energy of 115 kJ mol−1 those obtained. The shrinkage data recorded by the dilatometer were also analysed by an integral kinetic method, in this case the master sintering curve approach,40 and an activation energy of 225 kJ mol−1 was determined. Thus, the differences in activation energies may indicate that the decomposition reaction is more facile than the subsequent structural rearrangement.
In this work, we combine a dilatometer and MS to examine the evolved gases which arise during the sintering cycle of strontium titanate, an important perovskite material used in numerous applications. A surprisingly large number of species were detected over two regions of temperature and, in particular, over the midtemperature range near the onset of sintering; two compounds may be suspected as the source. To clarify the origin of these species, we use MS cracking patterns (CPs), natural isotopic abundances and the decomposition behaviour of model inorganic compounds.
Experimental
The experimental apparatus consists of three sections (Fig. 1): gas handling system, furnace/dilatometer assembly and gas analysis by mass spectrometry. The gas supply section consists of cylinders and a mixing station for preparing the desired gas phase composition. The furnace/dilatometer (L75/2000; Linseis, Germany) can be heated to 1500°C with temperature measurement by a type B thermocouple placed directly below the sample holder. The sample holder and push rod are made from alumina, and the surrounding muffle tube is mullite. A slip stream from the furnace effluent is introduced via a fused silica transfer capillary (Post Nova Analytics, Salt Lake City, UT, USA) of 0·1 mm interior diameter and 450 mm length into a quadrupole MS (Hewlett Packard 5971A, Agilent, Santa Clara, CA, USA). The silica capillary runs through a heated interface held at ∼320°C.
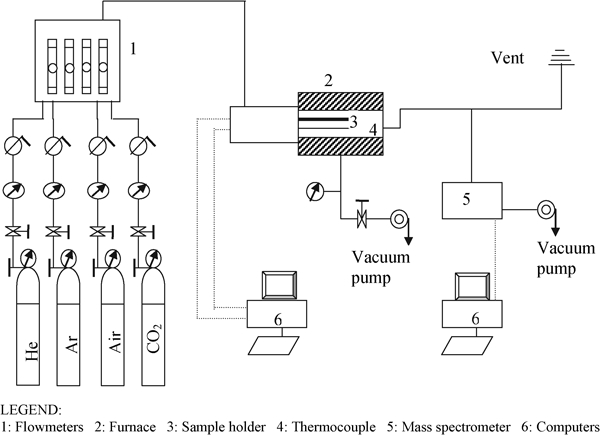
Schematic of combined CDMS apparatus showing gas handling system, furnace/dilatometer assembly, MS and data acquisition computers
High purity helium (99·9995%) was used as the carrier gas in each experiment. Before the start of each experiment, the muffle tube was evacuated twice to 0·6 mbar and backfilled with helium. The gas flowrate was then set at 135 mL min−1 at nominally 1 atm total pressure. This flowrate is maintained for 60–180 min to completely purge the system and to establish flat baseline signals in the MS. Specified mass/charge m/z ratios and sample length change were monitored as a function of time and temperature at a constant heating rate of 14°C min−1 to 1500°C followed by a 20 min hold. For the carrier gas flowrate used, the transfer time from the sample location in the furnace to the MS detector was <10 s.
Samples were prepared from strontium titanate powder (Sigma Aldrich, Milwaukee, WI, USA) with a nominal particle size of <5 μm and 99% purity. The samples were fabricated by dry pressing 1·00 g of powder to a relative green density of 0·55, which is based on a theoretical density of 5·1 g cm−3. Calcia stabilised zirconia spacers (Machined Ceramics Inc., Bowling Green, KY, USA) were used to prevent reaction between the strontium titanate samples and the alumina sample holder.
To identify the species evolved into the gas phase and subsequently into the MS, three approaches were used. When an easily available compound such as carbon dioxide was suspected, the gas was introduced into the MS, and the CP was determined by integrating and then normalising the intensities to the most dominant signal. For less commonly available substances or for substances that could not be easily evolved into the gas phase, either a National Institute of Standards and Technology (NIST) database41 of CPs or the naturally occurring isotope abundances42 were used to aid in species identification. In other instances, the CPs were determined for the decomposition behaviour of the model compounds strontium carbonate, potassium bicarbonate and strontium sulphate (all from Sigma Aldrich).
Results
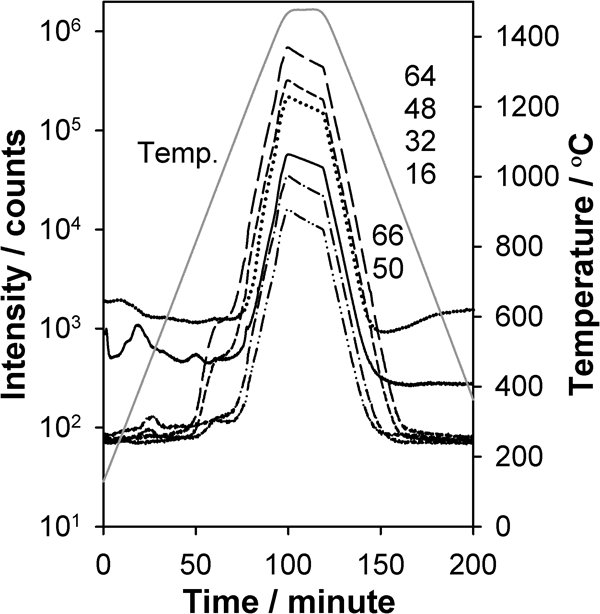
Figure 2 shows the fractional length change of the SrTiO3 sample and the four highest intensity signals (m/z = 28, 44, 48 and 64) recorded by the MS versus time for a heating rate of 14°C min−1 in helium gas. For temperatures from 200 to 1100°C, the SrTiO3 sample expands with a coefficient of thermal expansion value of 11·2×10−6°C−1, which is consistent with literature values.43 At ∼1100°C, the sample begins to sinter and ultimately experiences ∼17·3% linear shrinkage, which corresponds to a change in fractional density from 0·55 to 0·97.
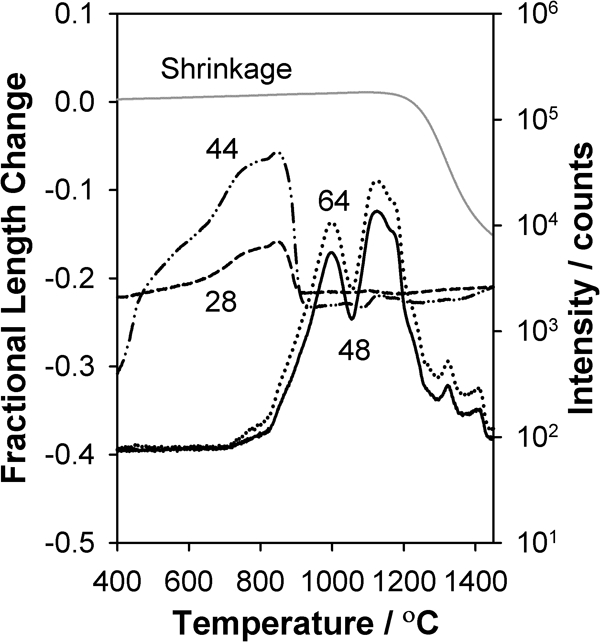
Fractional linear shrinkage and intensity of different m/z ratios versus temperature for 1 g of pressed SrTiO3 heated at 14°C min−1 in flowing helium
Figure 2 also shows that the evolution of species in the gas phase can be divided into two primary periods. The first occurs from 400 to 900°C, where m/z = 28 and 44 are observed with a peak temperature near 800°C preceded by a broad low temperature shoulder, which may consist of one or more additional features that overlap. The second region of gas evolution occurs from 800 to 1400°C, where for both m/z = 48 and 64, peaks are evident at 1000 and 1125°C followed by lower intensity features at higher temperature.
To aid in the identification of the gas phase species evolved over the two temperature ranges, the intensities of additional signals are shown in Fig. 3. From 400 to 900°C, Fig. 3a shows that species of m/z = 12, 16, 28, 44 and 45 are evolved with the aforementioned single peak and low temperature shoulder, all with the same general shape. The dominant intensity at m/z = 44 is suggestive of CO2 evolution. To verify this assignment to CO2, Table 1 compares the normalised measured intensities arising from the SrTiO3 sample as compared to the measured and tabulated CPs and to isotopes of CO2 gas [m/z = 44 (12C16O2) and m/z = 45 (13C16O2)]. In general, the measured ratios at m/z = 12, 16, 28 and 45 arising from the sample are in good agreement as compared to the CP data for CO2 measured with the MS on pure CO2 gas. In contrast, poorer agreement is obtained for the tabulated CP; this underscores the well known best mode of MS analysis, whereby CPs should be obtained with same equipment under similar conditions, when possible.
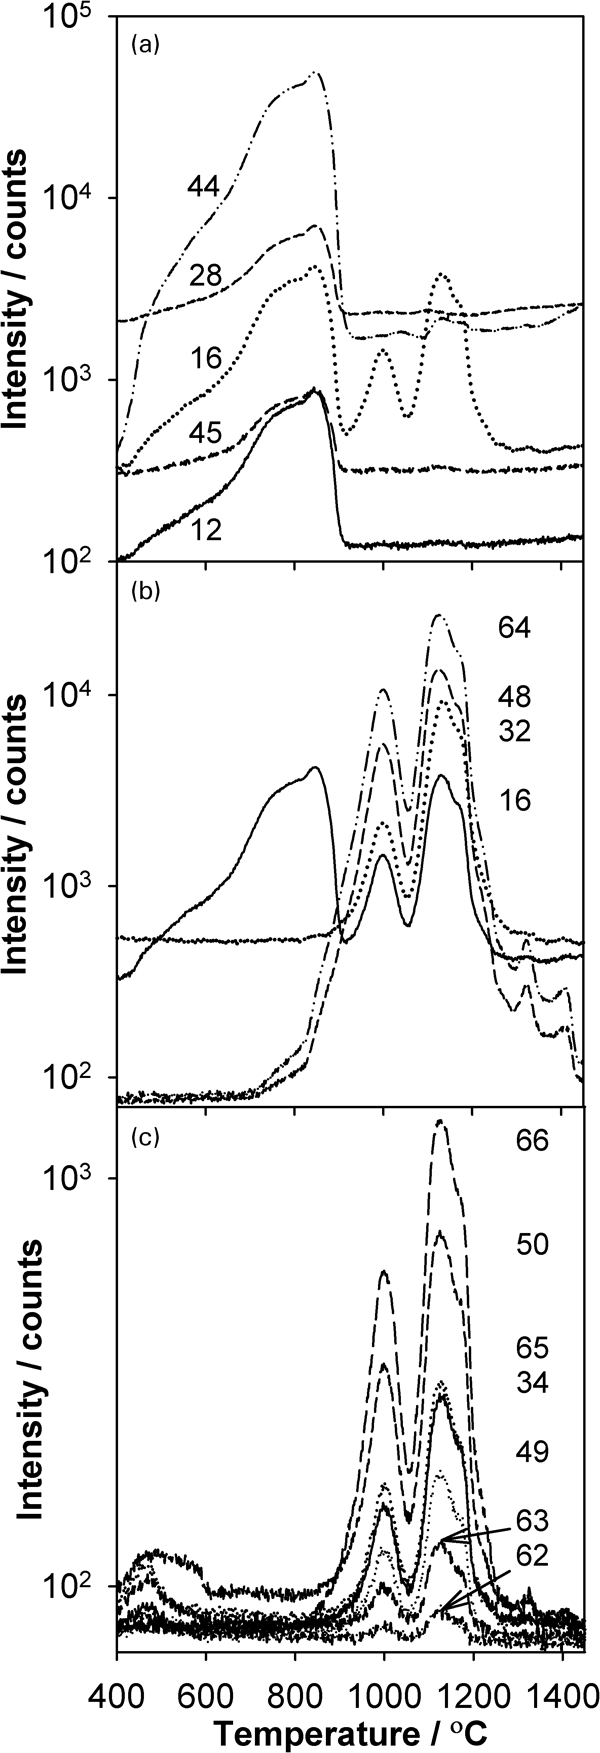
Intensity of different m/z ratios versus temperature for pressed SrTiO3 heated at 14°C min−1 in flowing helium:
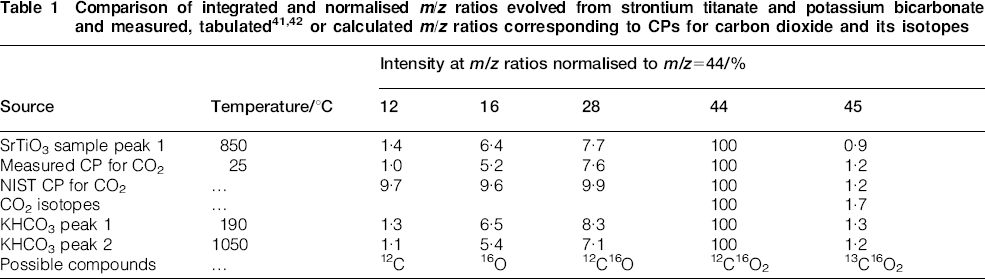
As an alternative method to verify the assignment to CO2, a sample of KHCO3 was completely decomposed at the same heating rate in helium, and for this sample, peaks were observed at 190 and 1050°C. Table 1 shows that the observed ratios of normalised ion intensities from both peaks during KHCO3 decomposition agree with the measured CP for CO2. Taken together, the results in Table 1 indicate that the m/z intensities seen from 400 to 900°C arise from CO2. The CO2 at low temperature may have as its source trace organic impurities arising from processing and exposure to the ambient environment. At higher temperature, the source of CO2 may be from residual unreacted SrCO3, which is a common precursor used to synthesise SrTiO3.44 When a sample of pure SrCO3 was decomposed at the same heating rate, a strong family of signals at m/z = 12, 16, 28, 44 and 45 was observed over the temperature range of 750–1470°C with a smaller peak between 400 and 650°C; this low temperature range overlaps the first region in Fig. 3a. The CP of the CO2 signals from SrCO3, however, exhibited some discrepancies at the lower m/z ratios, and in addition, other (unidentified) compounds were detected.
For the second period of gas evolution from 800 to 1400°C, Fig. 3b shows that a family of similarly shaped peaks for m/z = 64, 48, 32 and 16 are observed, whose appearance coincides with the onset of sintering. Based on these four m/z ratios, one possible source is TiO with peaks assigned as 48Ti16O (m/z = 64), 48Ti (m/z = 48), 16O2 (m/z = 32) and 16O (m/z = 16). The underlying defect chemistry reaction corresponding to the appearance of these species in the gas phase is
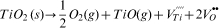
A second plausible reaction is the evolution of SO2 and fragments thereof as 32S16O2 (m/z = 64), 32S16O (m/z = 48), 32S (m/z = 32) and 16O (m/z = 16) according to either the oxidation of trace S or S containing species or from the decomposition of sulphate, as, respectively


To differentiate between TiO and SO2 evolution, the fact that S, Ti and O have different natural isotopic abundances, as given in Table 2, may be of use. Figure 3c illustrates the m/z signals corresponding to a number of the isotope combinations of the species appearing in Table 2. All of these signals in Fig. 3c closely mirror the trends for the m/z = 64, 48, 32 and 16 signals in Fig. 3b for the temperature range of 800–1400°C. Thus, the presence, absence and amount of signal can next be used to distinguish between TiO and SO2.
Species and natural isotopic abundances for S, Ti, O and C42
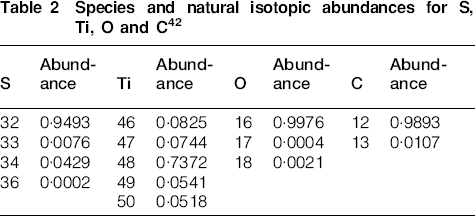
Table 3 shows the integrated and normalised ratios at m/z = 48 and 64 for the case where TiO is suspected to be evolved from the SrTiO3 sample. With the exception of the signals at m/z = 50 and 66, very little agreement is seen between the observed intensity ratios and the expected ratios based on the isotopic abundances. In addition, no signals (m/z = 46 and 47) or extremely small signals (m/z = 62) are observed, and these should be seen in larger amounts based on the expected isotopic abundances relative to the parent compounds.
Comparison of integrated and normalised m/z ratios evolved from strontium titanate and calculated m/z ratios corresponding to CPs for titanium monoxide and its isotopes
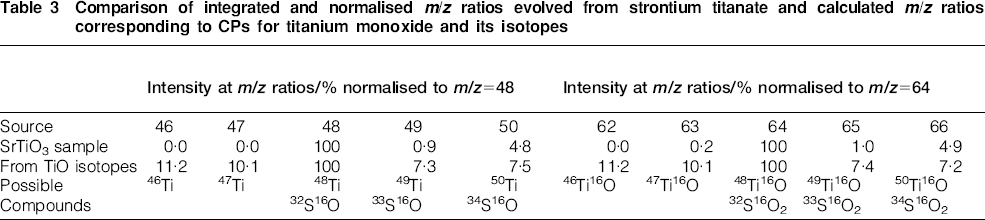
Table 4 shows the observed intensity ratios, normalised to m/z = 64, for the case where SO2 is suspected to be evolved. Based on the expected isotopes for sulphur, the signals at m/z = 50, 65 and 66 are now present in approximately the correct amounts as compared to Table 3. In addition, the level of agreement between the measured CP and a tabulated pattern41 for SO2 is quite good, with the exception of the signal at m/z = 32, which can be accounted for by the release of additional oxygen gas, as given by equation (2b).
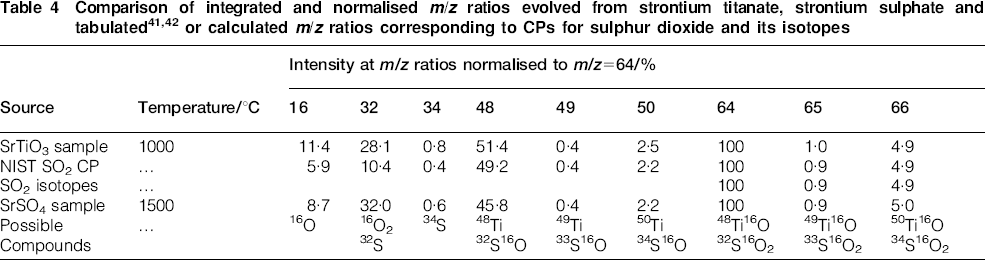
To provide further insight into the identity of the source compound, a sample of SrSO4 was heated at 14°C min−1 in helium. As seen in Fig. 4, SrSO4 begins decomposing at 50 min (800°C) with the main period of decomposition occurring during the soak period at 1470°C. Thus, the temperature ranges for the signals observed from the SrTiO3 sample in Fig. 3b and c are consistent with the lower temperature range seen for the same signals in Fig. 4. A discrepancy exists, however, in that the dominant family of signals in Fig. 4 arising at high temperature from SrSO4 decomposition is not seen from the SrTiO3 sample. This suggests that the evolution of trace SO2 from the SrTiO3 sample is more facile than for the pure SrSO4; this may occur because the SO2 from the SrTiO3 sample is not arising from pure bulk crystalline SrSO4. Alternatively, the more facile evolution of SO2 may be related in part to diffusion and surface area changes that occur during the sintering process of SrTiO3, which is just initiating at 1100°C.
Intensity of different m/z ratios and temperature versus time for 0·25 g of pressed SrSO4 heated at 14°C min−1 in flowing helium
Table 4 also compares the integrated normalised signals observed at nine m/z values for the SrTiO3 and SrSO4 samples; the level of agreement at all intensities is quite high, and decomposition of the SrSO4 sample also shows the elevated intensity at m/z = 32, again in accord with equation (2b). In summary, the agreement between the CPs arising from the SrTiO3 and SrSO4 samples is quite high, which suggests that the decomposition of a sulphate compound underlies the family of peaks seen in Fig. 3. This reaction presumably arises from the residual trace celestite used in the synthesis scheme to produce SrTiO3.
The CDMS apparatus can also be used to examine other aspects of the synthesis scheme, the powder purity and the sintering. As mentioned earlier, a common route to SrTiO3 is from the conversion of SrSO4 to SrCO3 with the subsequent reaction with TiO2. Figure 5 compares the CO2 signals arising from SrTiO3, SrCO3 and SrSO4, and a number of features common to two or more of the compounds are evident. Both SrTiO3 and SrSO4 evolve CO2 below 900°C with similar features, and both have a peak at ∼850°C, which may have a common source from trace carbonate present in both. At ∼1200°C, however, peaks of different widths are common to both SrCO3 and SrSO4 samples but not to SrTiO3. Above 1300°C, SrCO3 has two sharp peaks, whereas SrSO4 has one; these two highest temperature features may be related. In summary, the appearance of CO2 with peaks of the same shape and at the same temperature from different compounds suggests that the kinetics are the same, which in turn then implies that the structural environment from which the CO2 emanates may be similar as well. The traces in Fig. 5 may thus be used to track both the purity and possibly the environment of carbonate species.
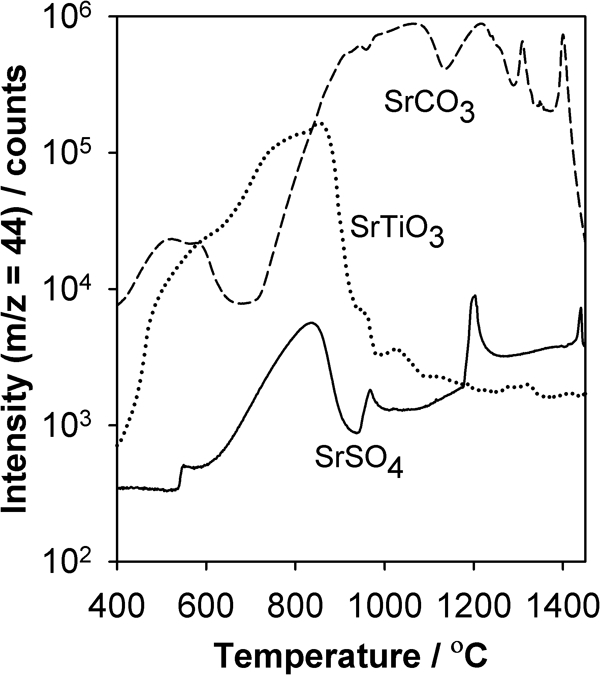
Intensities for m/z = 44 versus temperature for pressed samples of SrTiO3, SrCO3 and SrSO4 heated at 14°C min−1 in flowing helium
The CDMS apparatus can further be used to assess the effects of powder compaction during dry pressing on the evolution of gas species. Figure 6 shows the MS signals for m/z = 28, 44, 48 and 64 for SrTiO3 present as a loose powder. As compared to Figs. 2 and 3, the signals corresponding to CO2 (m/z = 28 and 44) are similar, regardless of whether the sample is pressed or not. In contrast, the relative peak heights for m/z = 48 and 64, which correspond to SO2 evolution, are quite different in that for the loose powder, the low temperature peaks are attenuated by more than an order of magnitude as compared to the peaks for the pressed sample in Figs. 2 and 3, which have peak intensities within a factor of 2. This difference depending on sample form, whether compacted or not, may arise because the SO2 evolves from different environments, such as from the near surface region of particles and from deeper within primary particles. Dry pressing of the powder may lead to fragmentation of primary particles, which leads to more evolution of SO2 at low temperature. For the loose powder, however, SO2 appears in abundance at higher temperature, which coincides with the diffusional processes and surface area changes occurring at the onset of sintering.
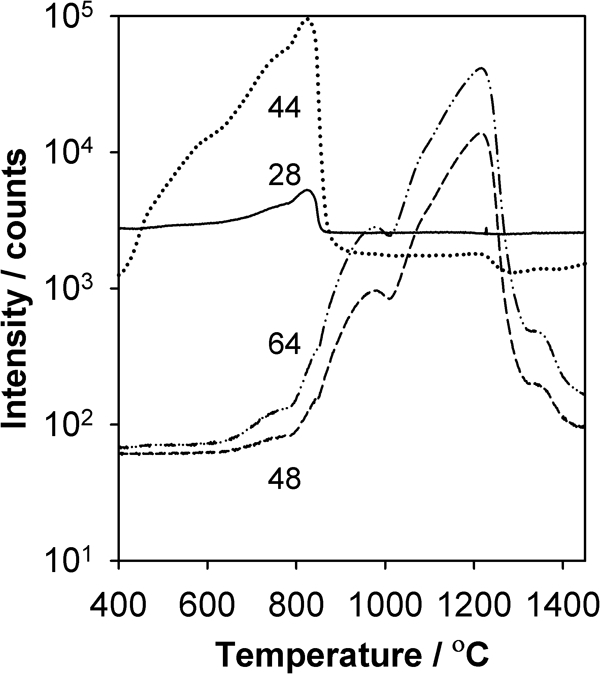
Intensities of different m/z ratios versus temperature for SrTiO3 in loose powder form heated at 14°C min−1 in flowing helium
Finally, in addition to providing CPs, the decomposition of the model compounds KHCO3, SrCO3 and SrSO4 can be used to help quantify the weight loss corresponding to the different regions of gas evolution in the SrTiO3 sample. To accomplish this, integration of the area under the curve of a dominant signal (e.g. m/z = 64 in Fig. 4 for SO2) and the stoichiometric weight loss from the reaction SrSO4→SrO+SO2+½O2 can be used to relate the signal intensity to the moles of SO2. A similar procedure can be used for the decomposition behaviour of KHCO3 and SrCO3 to relate the intensity to the moles of CO2. Table 5 shows that with this procedure, the estimated weight loss from SrTiO3 due to CO2 and SO2 evolution ranges from 60 to 200% of the observed weight loss. This range arises partially because of the uncertainty in the source of the oxygen for the evolution of CO2 and SO2 (equation (2)), i.e. does the oxygen arise from traces in the gas phase or from the sample itself. In addition, some of the weight loss arises from adsorbed water, which occurs below 500°C. Based on the analysis in Table 5, the conservative sensitivity of the apparatus, for a 1 g sample, is ∼100 ppm by weight or 1 μmol.
Weight losses during heating for potassium bicarbonate, strontium carbonate and strontium sulphate used to calibrate MS for strontium titanate sample: all weights normalised to 1 g of sample
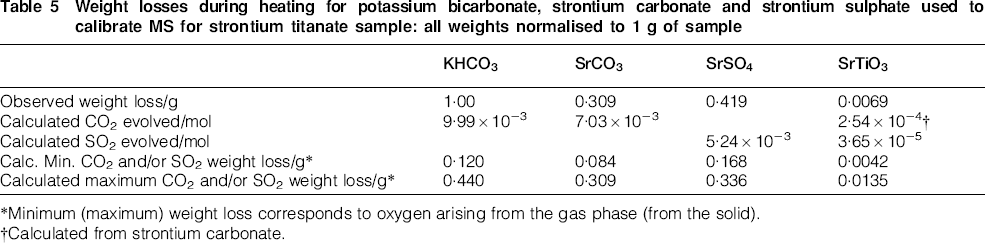
*Minimum (maximum) weight loss corresponds to oxygen arising from the gas phase (from the solid).
†Calculated from strontium carbonate.
Discussion
In this work, it was desired to examine the evolved gases that appear during a sintering cycle by combining a dilatometer with a characterisation technique for qualitatively and quantitatively analysing species in the gas phase. The decision to use mass spectrometry over gas chromatography was based on the following considerations. Gas chromatography is useful for identifying different species because when a mixture is present, the GC column effects a separation so that individual species elute sequentially into the detector. By using known calibration compounds and amounts, quantitative analysis of unknowns can be performed. A limitation of GC is that because of possibly lengthy separation times, the analysis can only be performed at selected, discrete times and not on a continuous basis in real time.
Mass spectrometry, on the other hand, allows for essentially continuous real time analysis. A limitation of MS, however, is that because gas phase species are not separated before entering the quadrupole filter, multiple compounds of a given mass/charge ratio are indistinguishable. In addition, fragmentation during ionisation in the MS leads to additional signals. To overcome these complications, a number of options are available for species identification. Measured CPs, reference CPs, isotopic abundances and model compounds have all been used in this work to aid in the identification of gas phase species, and the use of multiple methods increases the certainty of species assignment. In addition, the use of model compounds can be used to semiquantitatively calibrate the instrument, and in the future, the accuracy of the CDMS apparatus may be improved. Helium gas was selected as the carrier gas because its low mass/charge ratio does not interfere with other signals and thereby further complicate the assignment of intensities. In current and future works, we will examine the use of other gases and gas mixtures.
For the SrTiO3 material sintered in this work, high temperature species are evolved in the early part of the heating cycle. At lower temperatures, CO2 is observed, the source of which may be trace organic contamination and trace strontium carbonate. It is further expected that when binders are present in a sample, the kinetics of their decomposition can be observed as well, and this information can then be used to develop heating cycles for binder removal. At higher temperature, a family of signals were evident, which were ultimately assigned to the evolution of SO2. This species may arise from residual celestite used to synthesise SrTiO3. The decomposition of both strontium carbonate and strontium sulphate likely leads to residual strontium oxide within the strontium titanate, which may affect the material properties. The sensitivity of the apparatus, together with the capability to monitor signals continuously in real time, suggests that the CDMS can be used as a quality control tool by simultaneously assessing aspects of powder chemistry and sintering behaviour.
Finally, the appearance of species in the gas phase at the onset of sintering raises a number of interesting questions, and in future work, we will determine if the high temperature chemistry accelerates, inhibits or is independent of the sintering process. In addition, we will attempt to quantify in what manner the gas phase species affects the defect chemistry, defect equilibria and the resulting electrical properties of SrTiO3. Such information can then be used to compare different strontium titanate powders, derived, for example, from other synthesis routes such as sol–gel, hydrothermal or nanosized powders. Ultimately, the results of in situ gas phase chemistry and sintering studies can be tied to the microstructure and properties determined ex situ to help complete the structure-processing-property paradigm.
Conclusion
The high temperature species evolving during the sintering cycle of strontium titanate have been examined using a combined CDMS system in real time. At both low and intermediate temperatures, the dominant species observed was carbon dioxide. In addition, high temperature chemistry occurred at the onset of sintering; the observed species were ultimately related to the evolution of sulphur dioxide from the strontium titanate sample. Both of these decomposition reactions may lead to residual strontium oxide in the material and may affect the material properties as well. The apparatus can thus serve as a sensitive means to assess powder purity and material composition.
The identification of species in the gas phase was accomplished by using measured and tabulated CPs and cracking patters calculated from known isotopic abundances. Model compounds were also used to aid in distinguishing between possible species. The CDMS unit was demonstrated to have high sensitivity, on the order of hundreds of parts per million by weight (1 μmol), and high m/z resolution, in that isotopes differing by 1 atomic mass unit were easily distinguished.