
Abstract
It is known that bones and teeth are composed mostly of hydroxyapatite (HAp), and that iron is present in them as a trace element. Crystal growth after the incorporation of Fe, however, has not been reported extensively yet. In this work, HAp particles doped with Fe ions were synthesised using hydrothermal method. The influence of Fe addition and pH values on the crystal growth of HAp was studied. It was shown that a higher pH will increase the crystal size and thereby increase the crystallinity of HAp. Fe2+/3+ has a smaller ionic radius than Ca2+ and can be incorporated directly, resulting in poor crystallinity and a concomitant reduction in crystal size. At an Fe concentration of 0·2, the rod-like Fe-HAp transformed to a spherical morphology. It suggests that Fe ions can affect the morphologies by the adsorption on specific crystal faces that inhibit growth.
Introduction
Hydroxyapatite [Ca10(PO4)6(OH)2, HAp] has a similar composition to the mineral component of hard tissues found in the human body. HAp based materials have been investigated for use in hard tissue replacement for in excess of 80 years, and it has been shown that the biological response to them may be tuned by modifying the composition, crystal size, crystallinity and morphology.1–3 Although widely used in biomedical applications, HAp has also found application in food, pharmacy, chromatography and water remediation. In an effort to tailor apatite properties to specific applications, scientists have evaluated the characteristics of HAp particles doped with various metal ions, such as Mg2+, Zn2+, Na+ and Si4+. These ions have been shown to have different influences on the physical and chemical properties on the resulting apatite salt.4–8 For example, Zn2+ and Mg2+ have been shown to change the protein adsorption behaviour of apatite particles, Na+ contributes to the stability of synthesised HAp and Si4+ introduction favours dissolution in aqueous media.
Iron is one of the trace elements contained in bones and teeth. Iron containing HAp (Fe
Experimental
Preparation of Fe-HAp
All the chemicals used in this work were of analytical grade and used as received from Xilong Chemical Co., Ltd. The HAp particles were prepared using the hydrothermal method from aqueous solutions. Typically, 4 mM calcium acetate [Ca(CH3COO)2] and 400 mg PVP were dissolved in 40 mL of deionised water (solution I). The pH value of this solution was adjusted from 8 to 14 by adding aqueous ammonia and HNO3 solution. Second, 400 μM trisodium citrate and 2·4 mM NH4H2PO4 with various amounts of FeCl2 (Fe/Ca = 0–2·0) were added into 30 mL deionised water (solution II). Solution II was then added into solution I over a period of 50 min during vigorous stirring. The resulting mixture was then transferred into a polytetrafluoroethylene bottle and stored at 120°C for 12 h under vacuum. Finally, the precipitates were centrifuged, washed five times with deionised water and then dried at 80°C in air for 12 h.
Characterisation techniques
The crystal structure of the specimens was identified using a D/ruax 2550PC powder X-ray diffractometer. The diffraction spectra were recorded in the 2θ range from 10 to 130° using Cu Kα (wavelength = 1·5418 Å, 30 mA, 40 kV) radiation with a step size of 0·02° and a step duration of 2 s. The chemical properties of the titanates were evaluated using an IRZS Advantage 1000 ICP after dissolving a weighed amount of sample with HNO3 solution. The nanoparticles were put on a glass cover slip and dried in the desiccator. Morphology and structural information were obtained using a JEOL JEM-2100F field emission TEM.
Determination of crystal size and crystallinity of Fe-HAp
The size of individual Fe-HAp crystallite was calculated from XRD data using the Scherrer equation (equation (1)) and verified by measuring 200 particles using TEM. The full width at half maximum peak at 25·9° 2θ (002) was selected as the peak by which to determine crystallite size [B1/2(rad-2θ)]

The crystallinity, defined as Xc, corresponds to the fraction of crystalline phase in the investigated volume of powder sample. An empirical relation between Xc and the B1/2 was deduced according to equation (2)
Possible changes in the crystal structure (lattice parameters) were quantified. Interplanar distances (d values) obtained by XRD (peak 25–27° = 002 planes; peak 30–35° = 211+300 planes; peak 39–40° = 310 planes) allowed the calculation of the lattice parameters in accordance with equations (3) and (4)

Results
Phase composition
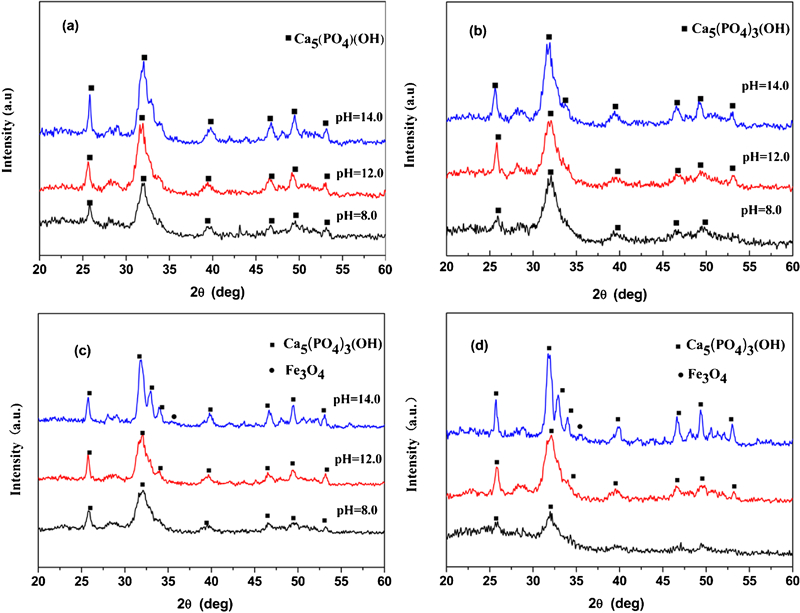
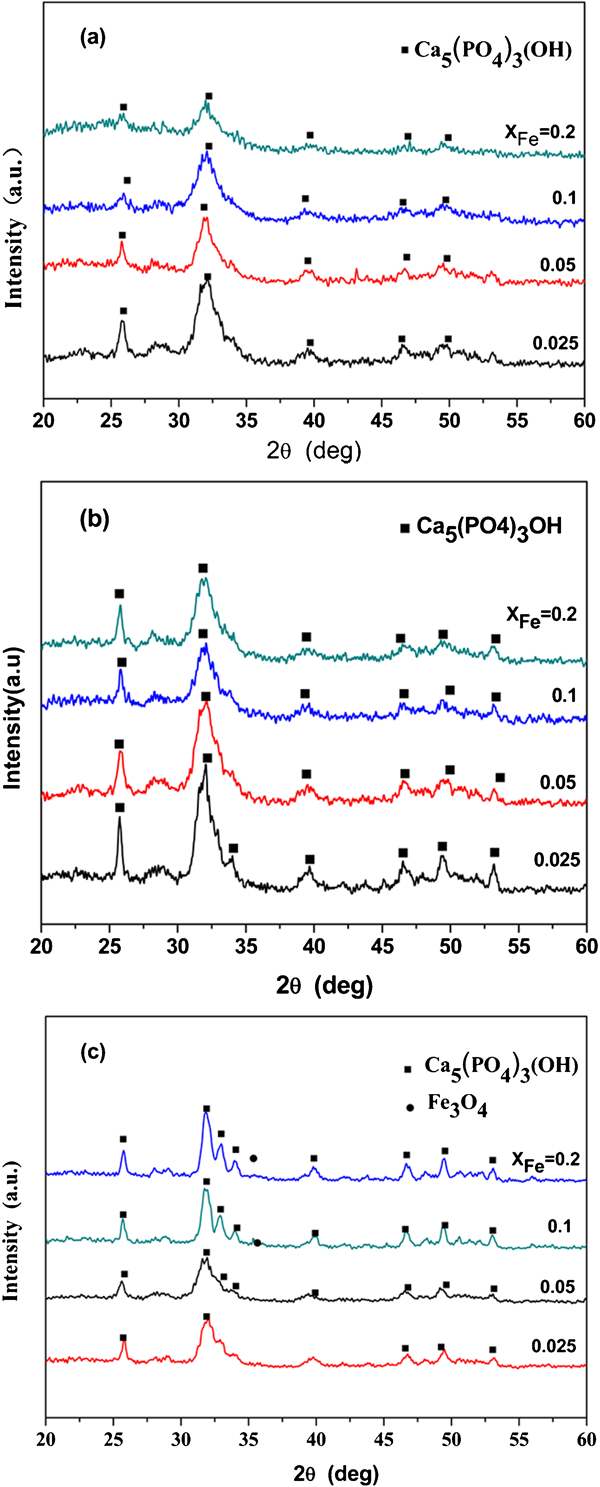
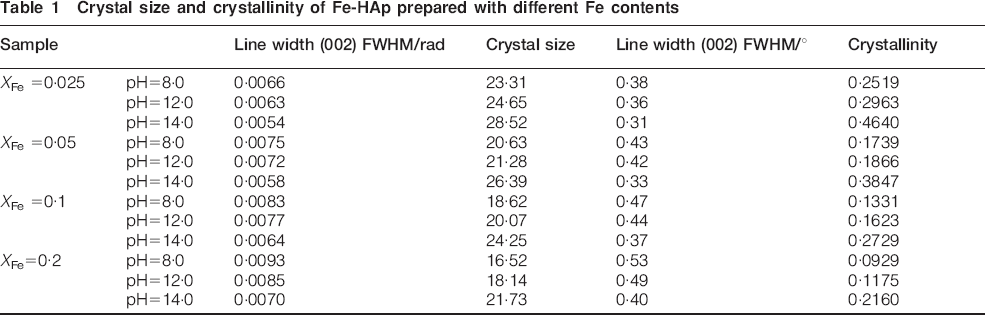
The XRD patterns of the samples added with various amounts of Fe ions made under various pH values are shown in Fig. 1. The main phase can be indexed as HAp, as the diffraction pattern shows peaks that correlate to the Joint Committee on Powder Diffraction Standards pattern for HAp (Joint Committee on Powder Diffraction Standards no. 09-0432). Meanwhile, two weak peaks at 2θ = 35° were detected on the samples with XFe (molar ratio of Fe/Ca) = 0·1 and 0·2 at a pH value of 14·0. These peaks were assigned to Fe3O4. It is worth noting that when the amount of Fe was constant, the relative intensity increased with increasing pH value. This result was attributed to the increased crystal size and corresponding crystallinity (Table 1). The crystallinity increased with increasing pH value. Figure 2 shows the XRD patterns of the products with different quantities of Fe at the same pH value. The intensity of the peaks for the products prepared at pH values of 8·0 and 12·0 decreased with increasing XFe. This result is attributable to a reduction in crystal size (and hence crystallinity) of Fe-HAp. As the pH value was increased to 14·0 and XFe was increased to over 0·1, the intensity of HAp was enhanced. An overdose of Fe2+/3+ reacts with abundant OH− ions to form Fe3O4 preferentially, which may reduce the release of Ca ions and thus change the crystallinity.
X-ray diffraction patterns of samples prepared with different Fe contents: a XFe = 0·025; b XFe = 0·05; c XFe = 0·1; d XFe = 0·2
X-ray diffraction patterns of samples prepared at different pH values: a pH = 8·0; b pH = 12·0; c pH = 14·0
Crystal size and crystallinity of Fe-HAp prepared with different Fe contents
Chemical compositions
The constituents of the synthesised Fe-HAp, as determined by ICP, are shown in Fig. 3. Figure 3a shows the contents of Ca and P in the final powder sample with various XFe. As XFe was increased, the content of Ca ions decreases, and the content of Fe increased. The result suggested that the calcium ions were substituted by iron during the hydrothermal preparation process.
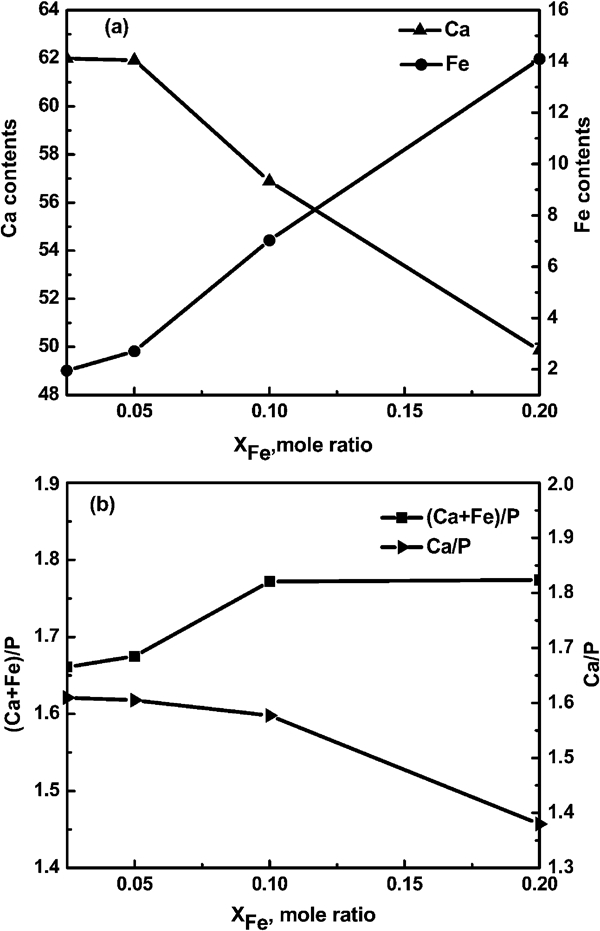
Ratios of a Ca and Fe and b (Ca +Fe)/P and Ca/P with increasing XFe obtained by ICP (pH = 14·0)
Figure 3b shows the ratios of Ca/(Fe+P) and Ca/P in the particles as a function of XFe at pH = 14·0. When XFe⩽0·05, the (Ca+Fe)/P ratios are almost equal to 1·67, the ratio that would be expected for stoichiometric HAp [Ca10(PO4)6OH2]. The total amount of Fe and Ca in the particles remained almost constant, once again indicating that Ca ions were replaced by Fe ions. By increasing XFe from 0·05 to 0·2, the (Ca+Fe)/P ratio increased from 1·66 to 1·83, indicating the highest level of Fe substitution before Fe3O4 formation.
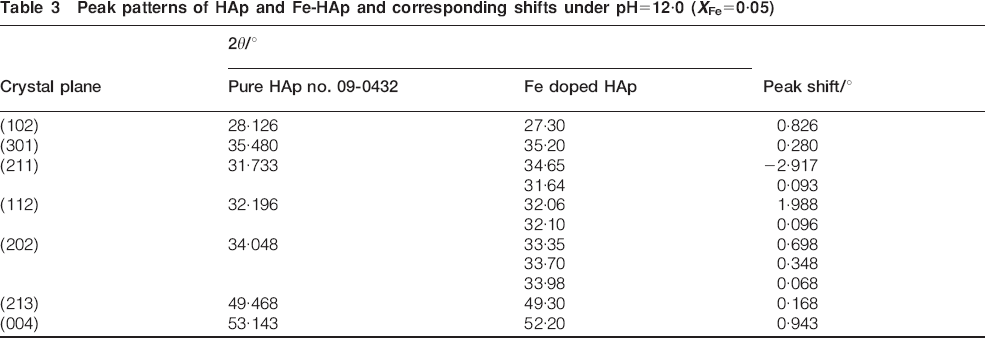
The unit cell parameters of the samples are shown in Table 2. The values for a and c slightly decrease with an increase in XFe. The ionic substitution was supported by the change in lattice parameters, which were determined by measuring the shift in peak positions (Table 3).
Lattice parameters of Fe-HA prepared under pH = 12·0 (XFe = 0·05)

Peak patterns of HAp and Fe-HAp and corresponding shifts under pH = 12·0 (XFe = 0·05)
Morphology of synthesised HAp particles
Figure 4 shows the TEM images together with high resolution TEM patterns for the HAp crystals prepared at pH = 12·0. Figure 4a shows that the pure HAp is rod-like in the range of 50–70 nm, and the regular spacing of the observed lattice phases is ∼0·35 nm, which is consistent with the (002) lattice spacing of HAp.
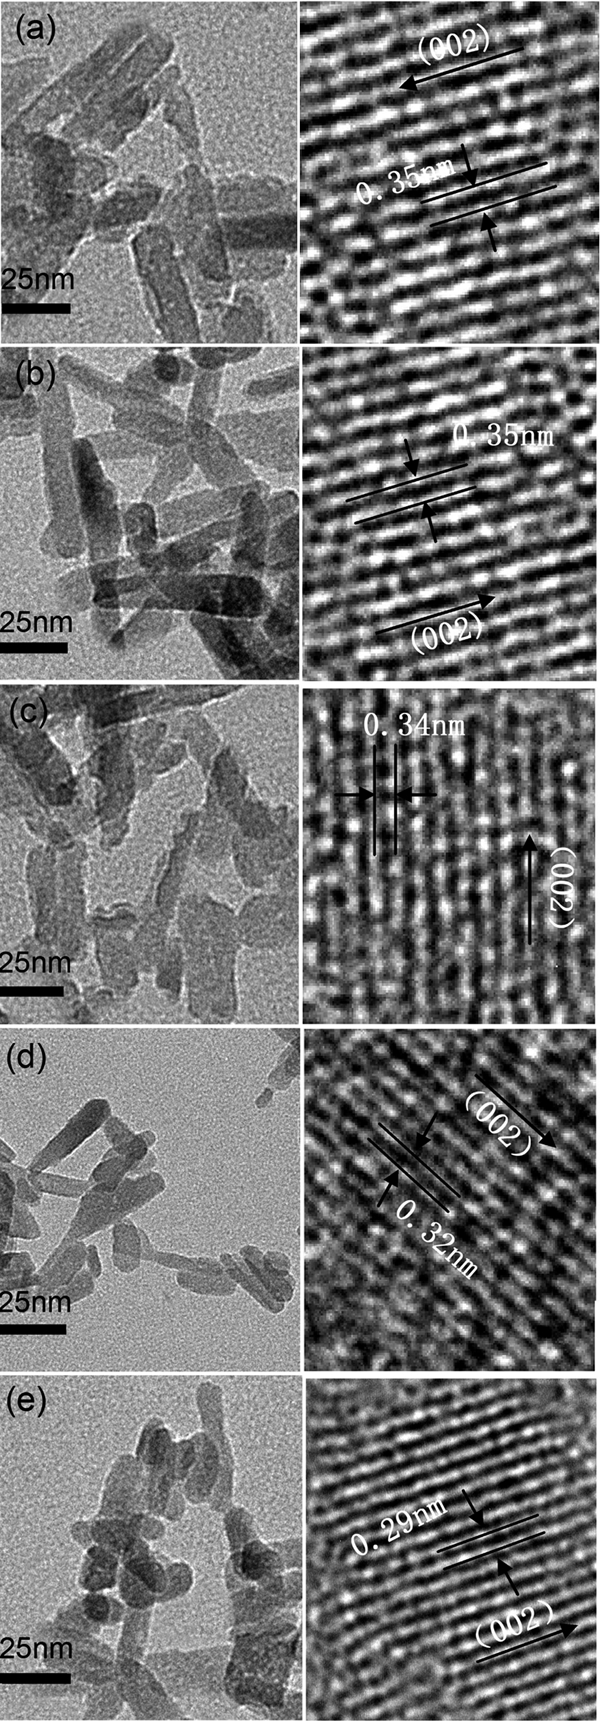
Images (TEM) of HAp particles under pH = 12·0
Below XFe = 0·1, the HAp crystals are rod-like and have a size of 15–60 nm, as shown in Fig. 4b–d. Upon an increase in Fe concentration to 0·2, the HAp particles had a uniform size of about 10–30 nm and were rod-like and spherical in shape (Fig. 4e). It could be observed that increasing the Fe content inhibited the crystallite growth. The regular spacing of the observed lattice planes decreased from 0·35 to 0·29 nm with increasing Fe content, which indicates a reduction in crystallinity, confirming the results of the XRD pattern evaluation.
Discussion
In this study, Fe-HAp was synthesised, which may have broad application as an implant material, a separation medium or an MRI contrast agent. As shown in Fig. 3, the Fe content in the synthesised Fe-HAp particles increased with a reduction in Ca2+, and the total amount of Fe and Ca in the lattice was kept constant before the sites for substitution were saturated. This suggested that Ca in the HAp lattice was replaced by Fe. The ionic radii of Fe2+ (0·76 Å) and Fe3+ (0·76 Å) are smaller than that of Ca (0·99 Å), which is in agreement with the reduction in lattice parameters for Fe-HAp. The change of the lattice parameters of Fe-HAp clearly demonstrated that the Fe ion was structurally incorporated and not just covering the surface of the crystal.
The XRD results indicated that both Fe content and pH values had a marked influence on the crystallinity of HAp particles. Ca10(PO4)6(OH)2 contains OH−; thus, the adsorption of OH− ions on the surface is essential for the crystallisation of Ca10(PO4)6(OH)2. Therefore, a higher pH value enhanced the crystallinity of HAp when adding iron content was maintained. At lower pH values (pH = 0, 8·0 and 12·0), the crystallinity decreased with increasing XFe; however, at a higher pH value of 14·0, the variation in crystallinity seemed to be complex. When the system had a lower content of Fe in the initial reaction solution, Fe2+/3+ occupied the position of Ca2+ and changed the crystal structure, resulting in the crystallinity of products decreased with increasing XFe. Nevertheless, when XFe increased over 0·1, the crystallinity was enhanced. This may have been caused by the formation of the second phase (Fe3O4) within the powder.19
The Fe-HAp particles with a lower Fe content were rod-like in shape and smaller than the size of the pure HAp. One possible explanation of this is the altering of the crystal growth phase by the iron. The reduction in crystal size suggested that the adsorption of the additives to the precipitation reaction leads to the inhibition of the crystal growth rate. Fe2+/3+ would enter the channel containing
 and substitute Ca2+. The crystal growth along the long axis, therefore, might have been strongly inhibited in the presence of Fe ions. When Fe incorporation increased to 0·2, the Fe-HAp crystals were rod-like and surrounded by spherical particles. The distortion of the lattice and the poor crystallinity of the structure might have caused an increase in the surface energy of the rod-like products. The transformation of the rod-like HAp to the spherical morphology would lower the surface energy and so be energetically favourable.
The present structural differences of HAp were predominantly due to the varying Fe amounts, but the addition of PVP and citrate ions may have slight influence on the morphology of the iron substituted material by selectively attaching to specific crystal planes during crystal growth. Citric acid could inhibit both the nucleation and the growth of HAp, and the growths along a and b axes were also suppressed.20 This may have resulted in the formation of crystallites of spherical morphology.
The changes in crystal size and crystallinity of Fe-HAp may be due to the type of substitution between Fe and Ca. According to the crystal structure of HAp, Ca ions have two different binding sites: Ca(I) sites that lie in the (300) plane and Ca(II) sites that lie in the (004) planes. Smaller ions (such as Cd2+, Zn2+ and Mg2+) can be incorporated preferentially in the HAp structure at Ca(I), while larger cations (such as Sr2+, Ba2+ and Pb2+) would first replace Ca2+ at Ca(II).20 In this case, Fe ions were substituted preferentially at the Ca(I) site since both ionic radii of Fe2+ (0·76 Å) and Fe3+ (0·76 Å) are smaller than that of Ca (0·99 Å). The incorporation of Fe reduces the structural size of Fe-HAp, which induced the decrease in length and width of Fe-HAp. With increasing incorporation of Fe, the symmetry could be destroyed, resulting in the decrease of crystallinity.
Conclusion
Both the crystal size and the crystallinity of the HAp are influenced by pH and Fe contents. A higher pH will increase the crystal size and so produce HAp of higher crystallinity. The incorporation of Fe, however, will lead to a small crystal size and hence poor crystallinity of HAp. The Fe-HAp crystals are short rod shaped and nearly spherical in shape, with a size of about 10–60 nm. The influence of Fe on the formation of HAp has been discussed in detail, and it will provide a basis for the further research in biological systems. This newly synthesised Fe-HAp nanoparticle has great potential to be applied for biomedical applications, as bioseparation devices and as non-toxic MRI contrast agents in the future.
Footnotes
Acknowledgements
The authors would like to acknowledge financial support from the National Natural Science Funds (Grand No.51150110156).