
Abstract
Impact damage was introduced into C/SiC composites by a quasi-static indentation method. Damages with different indentation depths were detected by non-destructive testing (NDT) technologies of thermography, X-ray radiography and ultrasonic C scan, and then the detection resolutions were compared. Effects of the impact damages on the retained compressive strengths of the C/SiCs were investigated. Results indicate that when the indentation depth is <0·5 mm, the C/SiCs reveal the linear elastic behaviour with invisible damage for three NDT methods. Once the indentation depth is >0·75 mm, thermal images and ultrasonic C scan are able to detect the obvious damage, while X-ray radiography did not detect any damage up to the indentation depth of 1·5 mm. The retained compressive strengths decreased gradually with increasing indentation depth, and the descent rate of the compressive strength suddenly increased when the indentation depth is >1·5 mm.
Introduction
Since composites have been applied to aircraft structures, impact damage is always one of the key points for designers and airplane users and the focus of new materials’ development. Fibre reinforced ceramic matrix composite, especially fibre reinforced SiC matrix composites (C/SiCs), has an increasingly important application prospects in aeronautic and astronautic fields.1 From the view of utilisation, engine materials need to have not only good mechanical properties and oxidation resistance2–6 but also excellent capacity resistant to impact of foreign object.7–9 At the beginning of the 1990s, researchers10–12 pointed out that the composites’ capacities resistant to impact included damage resistance and damage tolerance: the former is the resistance of the materials to impact events, and the latter is the effect of the damaged structures on the mechanical properties. So far, however, the impact related problems with respect to different material systems have not yet been solved.13
In this article, non-destructive testing (NDT) methods such as thermography, X-ray radiography, and ultrasonic and acoustic emission are used to detect the static force indentation damage of C/SiCs. The relation between damage parameters and relevant detection signals was investigated for non-destructive characterisation, and the effect of damage on compressive properties was a concern for the evaluation of impact damage.
Experimental
Material preparation
T300 carbon fibre (Toray industries Inc., Tokyo, Japan) was used to prepare two-dimensional (2D) carbon fabric; thus, 2D preform was obtained by laminating the fabric layers. PyC interface layer was deposited on the fibres in the 2D preform by chemical vapour deposition methods, and then SiC matrix was infiltrated into the preform by chemical vapour infiltration methods. Finally, 2D C/SiC composite plates with dimensions of 80×65×4 mm were prepared for indentation tests, and volume content of carbon fibre in the composites was ∼40%.
Indentation test
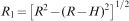
An electric universal testing machine (ZG-CSS-4 type) was used to conduct the static indentation test. The indenter is a no. 45 steel with a diameter of 12·7 mm according to ASTM standard.14 The maximum load of the tester is 10 tons. Indentation test was carried out in the displacement controlled mode with a load rate of 0·3 mm min−1. When the displacements reached d = 0·75, 1, 2 and 2·5 mm, the testing was interrupted immediately to measure the indentation damage and retained compressive strengths. The depth of indentation damage was measured by a laser distance meter (Keyence LK-G30 type), while the diameter of the indentation damage was calculated by
A servohydraulic universal testing machine (Model 8801, Instron Ltd, High Wycombe, UK) was used to test the retained compressive strengths of the C/SiCs with different indentation damages. The compressive tests were carried out in the displacement controlled mode with a load rate of 0·02 mm s−1. Meanwhile, an acoustic emission detector (Model MICRO-80D, Physical Acoustic Corp., NJ, USA) was utilised to collect acoustic signals during compression.
Non-destructive testing methods
An infrared thermography system (EchoTherm, TWI Corporation, USA) was utilised to detect the indentation damage. The infrared imager is a commercial radiometer with a cooled 240 H×320 V element GaAs focal plane array detector. The expanded field of view of the lens is 20° horizontally and 15° vertically. Heat application is achieved by directing the output of two 2·4 kJ xenon flash lamps.
A digital X-ray radiography (Philips MG320) was used to detect the indentation damage in this investigation. The C/SiC composite plates with indentation damage are placed between the X-ray source and a digital detector, and the source is enabled for a set time and energy to expose the detector. X-rays are absorbed increasingly by more atoms with increasing volume density, so the resulting images on the detector show changes in intact and damaged material as changes in intensity.
An ultrasonic C scan system (ULTRAPAC II, PAC, USA) was also applied to detect the indentation damage at frequency of 10 MHz.
Results and discussion
Indentation damage behaviour
Figure 1 presents typical load–displacement curve of 2D C/SiC under the static indentation test. It can be seen that four typical stages of damages from foreign impact appear from this load–displacement curve. The associated damage micrographs of the C/SiC composites are presented in Fig. 2 for showing the (i) matrix cracking, (ii) interfacial debonding, (iii) fibre fracture and (iv) fibre pullout with increase in the indentation displacement. The first stage OA of dOA⩽0·5 mm is termed the linear elastic stage associated with linear increase in the load with displacement. SiC matrix is considered to provide the main contribution of the linear elastic behaviour of OA. The deformation or damage in the form of the fabrication induced microcrack reopen is nearly recoverable during the linear elastic stage. The second stage AB of 0·5 mm⩽dAB⩽0·75 mm is termed the yield stage, in which the SiC matrix damage apparently appears in the form of cracking due to the brittle nature of the ceramic (Fig. 2a). During this stage, the load suddenly decreases with increasing displacement because the SiC matrix cracks propagate not bearing the high load until encountering the reinforcing fibres. The third stage BC of 0·75 mm⩽dBC⩽1·5 mm turns to the fibre bearing the load, revealing the linear increase with indentation displacement at a lower slope in contrast to the OA stage because the modulus of the C fibre is lower than that of the SiC matrix. The contact area between the indenter and the composite gradually increases; thus, the increasing effective load bearing area leads to increase in load with displacement. At the end of the BC stage, high load results in occurrence of the fibre/matrix interfacial debonding (Fig. 2b). Approaching the point of C with dC = 1·5 mm, the reinforcing fibres start to fracture (Fig. 2c) from the maximum debonding with the SiC matrix, leading to decrease in the load with further displacement. The fourth stage CD of 1·5 mm⩽dCD⩽2·5 indicates the fibre pullout (Fig. 2d) accompanied with the previous fibre debonding and fracture, which means the interface sliding in the matrix along with larger increase in displacement and less decrease in load. As a result, the static indentation damage behaviour completely indicates the whole process of the impact damage to the C/SiC composites: (i) the first stage of linear elastic SiC matrix compression, (ii) the second stage of matrix yield to cracking, (iii) the third stage of fibre bearing load and (iv) the fourth stage of fibre fracture and pullout. Finally, the C/SiC material is seriously damaged and thus loses the ability to bear the load because the indentation damage reaches the maximum toleration of the materials.
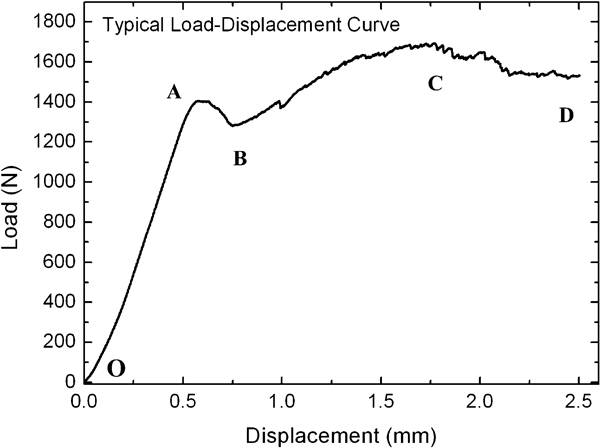
Typical load–displacement curve of 2D C/SiC composites during the static indentation test
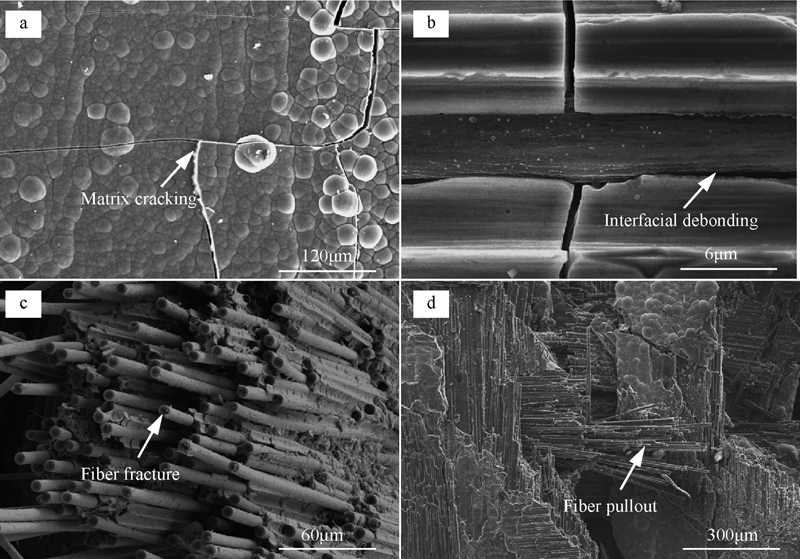
Micrographs showing typical damages of a matrix cracking, b interfacial debonding, c fibre fracture and d fibre pullout with indentation displacement
According to the above loading features, four loading displacements of 0·75, 1, 2 and 2·5 mm were selected to introduce the indentation damage. In the following, they were numbered as group I (d1 = 2·5 mm), group II (d2 = 1·5 mm), group III (d3 = 1 mm) and group IV (d4 = 0·75 mm) according to the indentation damage from large to small. The depth of the indentation damage was measured, and the radius was calculated by equation (1). Figure 3 shows the indentation depth and radius of 2D C/SiC change with the loading displacement under static indentation test. It can be clearly seen that as the displacement increases, the damage energy increases as well resulting in increase in the depth and radius of the indentation damage. It is worth to be noted that the inner part of the material started damage to cause the residual indentation depth of 0·15 mm even if the indenter was withdrawn from the minimum displacement of 0·75 mm.
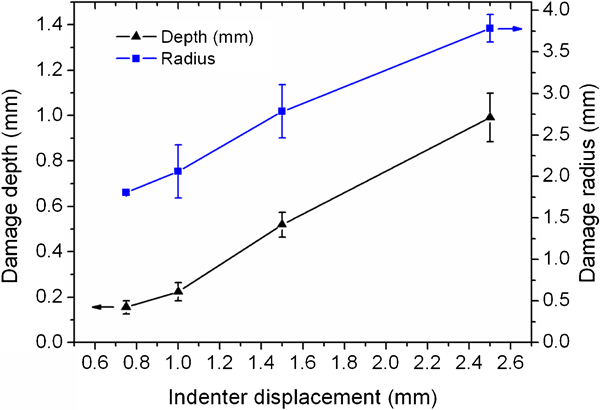
Depth and radius of indentation damage changes with indenter displacement
Thermal imaging investigation
Thermal images of the indentation damage in the C/SiC samples for groups I, II and III (i.e. d = 2·5, 1·5 and 1 mm) are shown in Fig. 4. It can be distinctly seen the size, shape and distribution features of the three groups of indentation damage. It is obvious that the larger the loading displacement, the more the damaged energy and the larger the damaged area. Figure 5 presents the enhanced thermal images for the relatively small damage samples III and IV (i.e. d = 1 and 0·75 mm respectively). The delamination induced by the indentation can be detected by thermography. More importantly, the indentation energy of 0·6 J can be able to cause the initial delamination when the indentation depth is 0·75 mm (accounting for 18·75% of the sample total thickness of 4 mm).
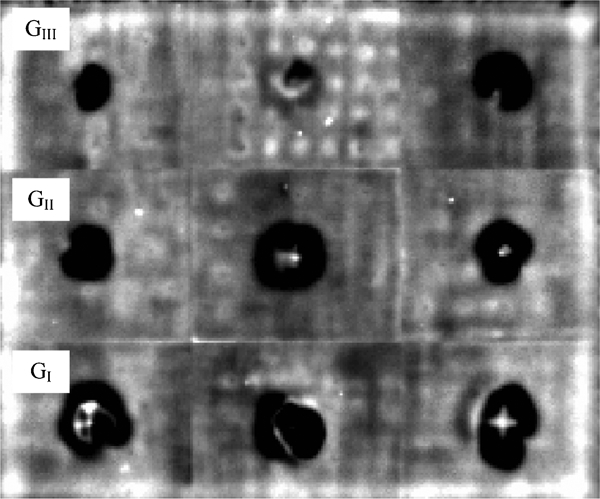
Thermal images of indentation damage in C/SiC composites for groups I (d = 2·5 mm), II (d = 1·5 mm) and III (d = 1 mm)
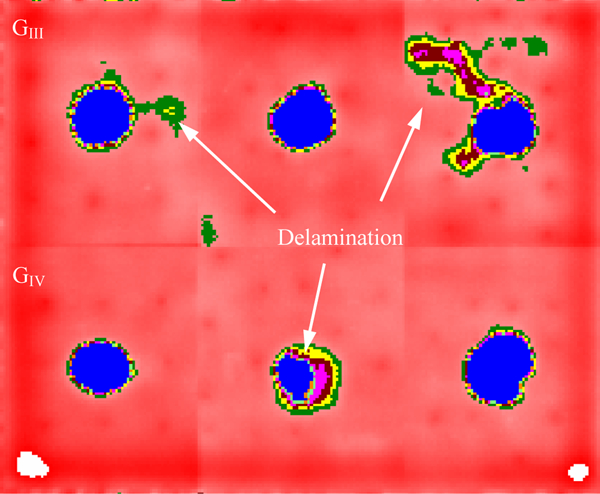
Enhanced thermal images of indentation damage in C/SiC composites for groups III (d = 1 mm) and IV (d = 0·75 mm)
Figure 6 indicates a comparision of the damage area change with the indenter displacement by thermographic and apparent measurements. As the indenter displacement increases, the damage area increases disregarding the apparent and thermographic measurements. This is because the increasing indenter displacement can obtain the more impact energy to cause the larger damage area. It also indicates that the indenter displacements reach 18·75, 25, 37·5 and 62·5% of the total thickness of the C/SiC composite plate; the curves from two methods form a close relationship in which the enclosed area represents the actual delamination area. More interestingly, the delamination area initiates at the indentation depth percentage of 18·75%, then enlarges at 25 and 37·5% and finally approximates to zero at 62·5%. This means that the impact will hardly produce the delamination when the indentation depth percentage is either <18·75% or >62·5%.
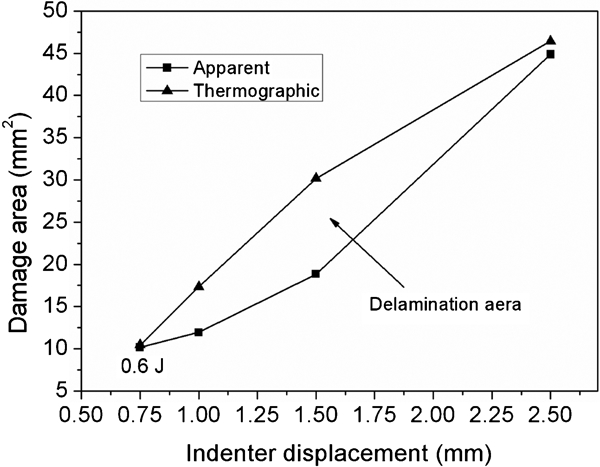
Damage area changes with indenter displacement for thermographic and apparent measurements
For safety reason, thermographic measured data of the damage area of the C/SiC composites is strongly recommended and can reflect the actual damage situation.
X-ray radiographic investigation
Figure 7 shows the radiographic images of the indentation damage of the C/SiC samples for groups I, II and III. For the radiography, as shown in Fig. 7, the indentation damage of GI (d = 2·5 mm) is visible, while the damage of GII (d = 1·5 mm) and GIII (d = 1 mm) are invisible. It indicates that the X-ray radiographic method can only detect the indentation damage when the indenter displacement is >1·5 mm (18·8 mm2) and not sensitive to the delamination induced during the indentation process because of the X-ray superposition effect. As described in the section on ‘Indentation damage behavior’ and in Fig. 1, the indentation with displacements <1·5 mm mainly caused the SiC matrix cracking and few fibres breaking, which is not a large enough change in the density of the materials to allow more X-rays through the materials onto the detector. However, the indentation damage with a displacement of 1·5 mm can be seen by the naked eyes. Compared with the thermography, the X-ray radiographic method is not suitable to accurately detect the indentation damage under the low loads or with the large delamination due to the superposition effect.
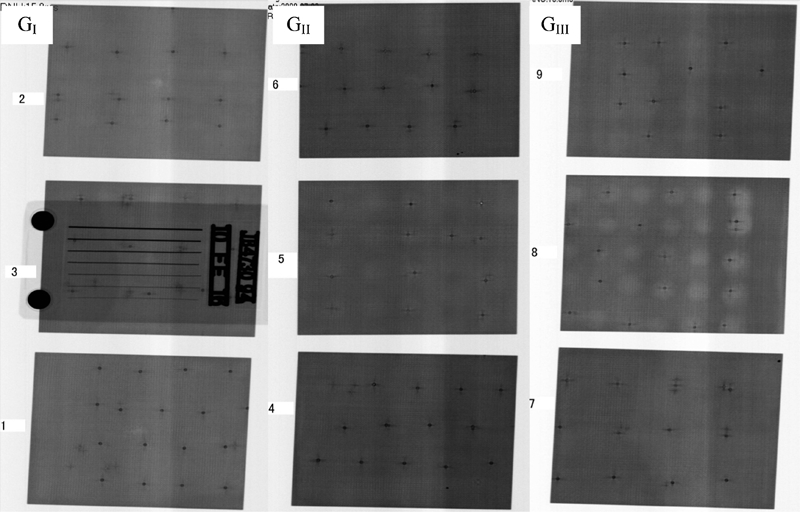
X-ray radiographic images of indentation damage of C/SiC composites for groups I (d = 2·5 mm), II (d = 1·5 mm) and III (d = 1 mm)
Ultrasonic C scan investigation
Figure 8 presents the ultrasonic C scan images of the four groups of the indentation damage of the C/SiC composite samples at displacement GI (d = 2·5 mm), GII (d = 1·5 mm), GIII (d = 1 mm) and GIV (d = 0·75 mm) respectively. Figure GI is the ultrasonic C scan image of the indentation damage with a displacement of 2·5 mm, in which the damage area is the largest among the four groups of samples. This damage zone shape approximates a circle, beside which no more affected zone (lamination) was found. It must be noticed that in the C scan image, the redder the damage region colour, the more serious the damage. Comparatively, the indentation damage area of GII is smaller than that of GI because of less indentation energy suffered. Apparently, the damage affected zone with large delamination is observed around the major circular damage zone. It can be seen from figures GI, GII, GIII and GIV that with decrease in the indenter displacement, the damage area diminishes and the colour of the damage region turns lighter. In addition, the damage affected zone beside the central circular damage region can be easily detected as the delamination induced during the indentation test, which indicates that the ultrasonic C scan method is sensitive to the delamination in the internal part of C/SiC sample. Figures GIII and GIV are the ultrasonic C scan images of the indentation damage with displacements of 1·0 and 0·75 mm. As the indentation displacements decrease, the damage energies decrease as well, and the damage area gradually decreases with less and less damage. The damage boundary images appear more and more unclear with decrease in displacement. As shown in figure GIV, the indentation damage can hardly be found at this moment for the displacement of 0·75 mm.
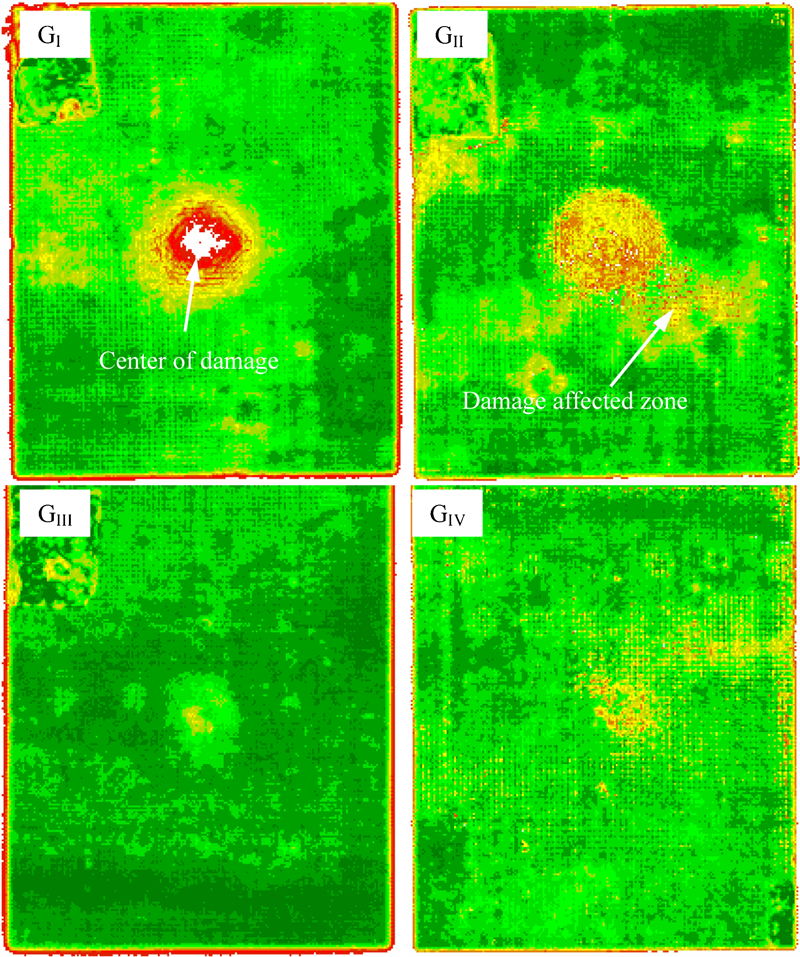
Ultrasonic C scan images of indentation damage of C/SiC composites for groups I (d = 2·5 mm), II (d = 1·5 mm), III (d = 1 mm) and IV (d = 0·75 mm)
Retained compressive strengths
Figure 9 presents the relationship between the retained compressive strengths and the indenter displacement. It is clear that with increasing indenter displacement, the C/SiC composite material's damage gets more serious and the corresponding retained compressive strengths decrease. It is worth to be noted that the retained compressive strengths severely decrease at the displacement of 1·5 mm. Referenced to Fig. 1, it can be found that the indenter displacement of 1·5 mm approximates to the summit point in the indentation load–displacement curve, at which a large quantity of fibres start to fracture. The material reaches the limit of the bearing indentation load at this moment; afterwards, it breaks rapidly and loses the ability to bear the load.
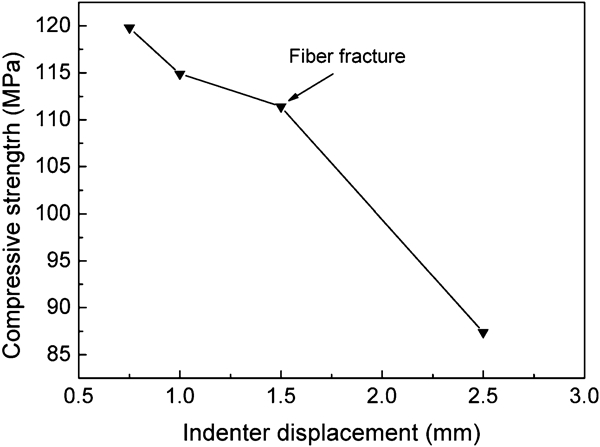
Relationship between retained compressive strengths and indenter displacement
Figure 10 is the typical compressive load versus time curve associated with acoustic emission response activities. As can be seen in this figure, the acoustic emission response of the C/SiC composites with the indentation damage is divided to two stages during the compression. When the compressive load is <20 kN on the first stage, few acoustic emission events appear and the load seems to increase linearly with no new damage. When the compressive load reaches 20 kN, the compressive load curve appears an inflexion, above which the acoustic emission signals increase rapidly indicating that the new damage occurs again in the inner part of the material aside from the indentation damage created previously. The few acoustic emission signals on the first stage indicate less damage occurrence in the internal part. This phenomenon for the ceramic matrix composites is reported as ‘damage memory’ effect or environmental stress self-adaptation in several published literature earlier.15, 16 It is not surprising that the external loads less than the previous damage level do not result in the new damage with less acoustic emission activities. Before the compression test, the sample has experienced a certain degree of damage in the form of matrix cracking, interfacial debonding and fibre breaking during the static indentation, so the new damage would not occur under the reloading lower than the maximum stress level produced by the indentation. Once the external load exceeds the maximum value of the previous damage, the new damage would occur again in the form of matrix crack propagation and fibre breaking with highly increasing acoustic emission signals up to the final failure of the materials.
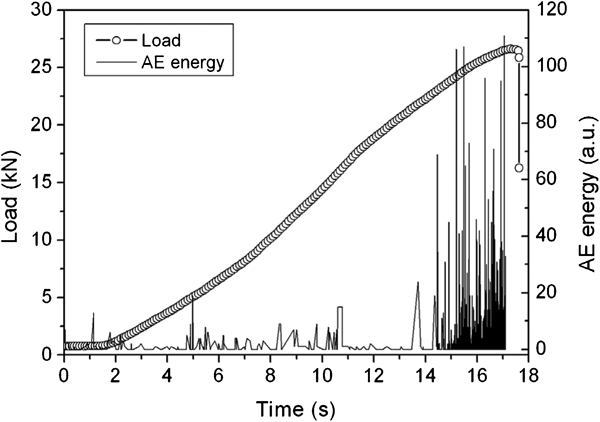
Typical compressive curve of 2D C/SiC composites with indentation damage of d = 2·5 mm associated with acoustic emission signals
Conclusion
Impact damage was introduced into the C/SiC composites by the quasi-static indentation method. Damages with different indentation depths were detected by the NDT technologies of thermography, X-ray radiography and ultrasonic C scans, and then their detection resolutions were compared. Effects of impact damages on the retained compressive strengths of the C/SiCs were investigated. The four stages impact damage mechanisms of the C/SiC composites were proposed relating to (i) the first stage of linear elastic SiC matrix compression, (ii) the second stage of matrix yield to cracking, (iii) the third stage of fibre bearing load linearly and (iv) the fourth stage of fibre fracture and pullout. It is found that the larger the indentation displacement, the larger the indentation damage depth and diameter, and thus the less the retained compressive strength. The indentation damage area measured by the thermographic method contains the inner invisible delamination induced during the indentation, which is more suitable for characterisation of the actual damage degree to reflect the decay of the compressive strength than the apparent area measured by traditional methods. When the indentation depth is <0·5 mm, the C/SiCs revealed the linear elastic behaviour with invisible damage for three NDT methods. Once the indentation depth is >0·75 mm, thermal images and ultrasonic C scan were able to detect the obvious damage, while X-ray radiography did not detect any damage up to indentation depth = 1·5 mm. The retained compressive strengths decreased gradually with increasing indentation depth, and the descent rate of the compressive strength suddenly increased when the indentation depth is >1·5 mm.
Footnotes
Acknowledgements
This work has been supported by the Natural Science Foundation of China (contract no. 50902112). The authors also gratefully acknowledge the financial support from the Northwestern Polytechnical University (NPU) Foundation for Fundamental Research (grant no. NPU-FFR-JC201135) and the NPU Foundation for Flying Star.