
Abstract
Two commercial 3 mol.-% yttria partially stabilised zirconia powders, 0·3 wt-%Al2O3 doped (Al doped Y-PSZ) and without Al2O3 (Y-PSZ), were used to produce alumina (Al2O3)–zirconia (ZrO2) slip cast composites. The effect of the substitution of Al2O3 and/or Y-PSZ by Al doped Y-PSZ on the rheological properties of concentrated aqueous Al2O3–ZrO2 slips was studied. In addition, the density of green cast samples was studied and related to the degree of slip dispersion. The viscosity and yield stress values of Al2O3 Al doped Y-PSZ suspensions were higher than those of Al2O3 Y-PSZ ones for all the compositions and solid loading studied. This behaviour could be explained by a larger effective size of the Al doped Y-PSZ particles, which resulted in a higher effective solid volume fraction and a lower amount of free liquid available for flow. The substitution of Y-PSZ by Al doped Y-PSZ in the Al2O3–ZrO2 mixtures resulted in a less dense packing of cast samples.
Introduction
Recently, zirconia toughened alumina ceramics have received considerable attention due to their attractive properties, including high temperature mechanical strength, good thermal shock resistance, wear and oxidation resistance, low thermal conductivity and the close match between their thermal expansion coefficients and those of metals.1, 2 These properties make zirconia–alumina ceramics suitable for a variety of high demanding applications including dental screws, cutting blades, electrosurgical insulators, valve seals, body armour, pump components, oxygen sensors, dies and prosthesis components such as hip joints.3, 4 The zirconia grains embedded in an alumina matrix enhance the flexural strength, fracture toughness and fatigue resistance.5 The toughening mechanisms identified in zirconia reinforced alumina ceramics are attributed to the stress induced phase transformation of metastable tetragonal grains towards the monoclinic symmetry ahead of a propagating crack, leading to an increase in the work of fracture.5 This phenomenon of transformation toughening relies on the volume expansion of 3–5%, and a shear strain ∼7% develops when tetragonal zirconia transforms to the monoclinic form.6, 7 Besides, microcracks extending in the stress field of a propagating crack can absorb the fracture energy, increasing the material toughness by the microcrack toughening mechanism.2 However, studies on the application of these materials in humid environment at low temperature have shown that the tetragonal→monoclinic transformation can also be induced at the surface of ZrO2 grains, leading to the so called hydrothermal transformation,3 which produces a slow degradation of the composite mechanical properties. In order to reduce the ZrO2 susceptibility to the hydrothermal instability, 3 mol.-% yttria partially stabilised zirconia powder doped with 0·3 wt-%Al2O3 can be used.6
Colloidal shaping methods enable to achieve high microstructural homogeneity in green and sintered parts and offer near net shaping capabilities that reduce post-sintering machining operations and production costs.2, 8 The first step in the colloidal process is the preparation of stable concentrated aqueous suspensions of the ceramic powders. At high solid loading, relatively low slip viscosity can only be achieved in the presence of an optimum dispersion state of particles. Anionic polyelectrolytes, such as NH4PA, are commonly used as dispersant of ceramic powders in aqueous media.9 The polyelectrolyte adsorbs at the solid/liquid interface and infers repulsive forces between the particles, which keeps them well dispersed; the repulsive interactions are caused by electrostatic and steric effects.10 Two commercial 3 mol.-% yttria partially stabilised zirconia powders, 0·3 wt-%Al2O3 doped (Al doped Y-PSZ) and without Al2O3 (Y-PSZ), were used to produce concentrated aqueous Al2O3–ZrO2 suspensions for slip casting. The different textural characteristics and interfacial charge properties of the two zirconia powders were believed to strongly affect the dispersion properties of Al2O3–ZrO2 suspensions. In this study, the effect of the substitution of Al2O3 and/or Y-PSZ by Al doped Y-PSZ on the rheological properties of concentrated aqueous Al2O3–ZrO2 slips was studied. In addition, the density of green cast samples was studied and related to the degree of slip dispersion.
Experimental
Raw materials and powder processing
Alumina (A16 SG; Alcoa Chemicals, USA; d50 = 0·40 μm), 3 mol.-% yttria partially stabilised zirconia with 0·3wt-%Al2O3 (CY3Z-MA; Saint-Gobain ZirPro, China; d50 = 0·23 μm) and without Al2O3 (CY3Z-NS; Saint-Gobain ZirPro, China; d50 = 0·64 μm) powders were used in this study. The compositions used to prepare Al2O3–ZrO2 composites are summarised in Table 1. The numbers 10·5, 22 and 50 in the sample codes indicate the volume per cent of zirconia in the composite.
Compositions used for preparation of Al2O3–ZrO2 composites/vol.-%
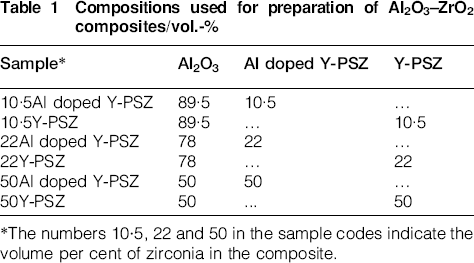
*The numbers 10·5, 22 and 50 in the sample codes indicate the volume per cent of zirconia in the composite.
A commercial ammonium polyacrylate solution (Duramax D 3500; Rohm & Haas, Philadelphia, PA, USA) was used as deflocculant. Aqueous Al2O3–ZrO2 suspensions (35 vol.-%) with different compositions (Table 1) and various amounts of deflocculant were prepared by suspending particles in deionised water via 40 min of ultrasound; the pH was manually adjusted to be maintained at 9 with ammonia (25%). In addition, slips with the optimum NH4PA concentration and different solid contents were prepared at pH 9 to study the influence of the solid loading on the rheological properties.
Slips were cast in plaster moulds into discs of 2·61 cm diameter. The consolidated discs were dried slowly in air for 24 h at room temperature and for 24 h at 100°C.
Characterisation techniques
The specific surface area Sg and the particle size distribution of the powders were measured using a Micromeritics Accusorb and a Sedigraph (Micromeritics) respectively. The morphological features of the powders were examined by scanning electron microscopy (SEM) (JSM-6360; JEOL).
To determine the isoelectric point (IEP) of the powders, zeta potential measurements were carried out with the Zetasizer Nano ZS (Malvern Instruments, UK). Eight zeta potential measurements were performed by the equipment for each pH, and then, an average zeta potential value was automatically calculated. The pH was measured with a pH meter calibrated with buffer solutions (pH 4, 7 and 10; Merck, Germany). The zeta potentials against the pH curves were determined for 0·05 vol.-% slips of different powders: Al2O3, Y-PSZ and Al doped Y-PSZ in the pH range of 3–10. The pH adjustment was achieved with HCl or KOH solutions. Each curve was repeated three times. The dispersion of the Al2O3, Y-PSZ and Al doped Y-PSZ powders at different pH values was studied by measuring the mean particle diameter of 2 vol.-% suspensions as a function of pH.
In order to determine the amount of NH4PA adsorbed, different 35 vol.-% slips with the optimum NH4PA concentration were centrifuged for 30 min at 2500 rev min−1 and washed twice with distilled water. Then, the solid was dried at 100°C for 24 h and analysed by thermal gravimetric analysis (model STA 409; Netzsch, Inc., Germany) at a heating rate of 10°C min−1 in air. The thermal gravimetric analysis data showed a negligible water weight loss at temperatures up to 100°C and a weight loss due to the NH4PA decomposition in a temperature range from 300 to 600°C. This weight loss was used to determine the amount of NH4PA adsorbed on each sample. Although the adsorption data obtained with this technique were semiquantitative, they provided a relative measure of the amount of NH4PA adsorbed on the samples. Zeta potential versus pH curves were determined for 0·05 vol.-% slips of different powders: Al2O3, 50Y-PSZ and 50Al doped Y-PSZ with the optimum amount of NH4PA in the pH range of 3–10.
Steady state flow curves of the different Al2O3–ZrO2 slips were performed by measuring the steady shear stress value as a function of shear rate in the range of shear rates between 0·5 and 542 s−1 using a concentric cylinder viscometer (Haake VT550; Germany) at 25°C. A coaxial cylinder system with two gaps (sensor system NV Haake) was used. As soon as stationary conditions were reached at each shear rate, the shear rate increased in steps up to the maximum value and then decreased. The majority of the curves did not show the hysteresis area.
The slips were allowed to settle under gravity, and the volume fraction of the sediment was measured after 40 days; this value was used to calculate the maximum packing fraction. The density of the green compacts was determined by the Archimedes method using mercury displacement.
Results and discussion
Powder characterisation
The specific surface areas of Al2O3, Y-PSZ and Al doped Y-PSZ powders were 8·74, 7·84 and 12·25 m2 g−1 respectively. Figure 1 shows the particle size distribution curves of the different powders. The particle size distribution curves of the Al2O3 and Al doped Y-PSZ powders were similar. The alumina showed a unimodal distribution with particle diameters of >0·1 and <0·75 μm; the more frequent particle diameters were in the range of 0·15–0·3 μm. A slightly narrow particle size distribution was found for Al doped Y-PSZ; thus, a greater volume of finer particles (diameters between 0·10 and 0·20 μm) and a lesser volume of particles with diameters in the range of 0·20–0·55 μm were observed; the more frequent particle diameter was 0·15 μm. A bimodal distribution curve was found for Y-PSZ; the more frequent particle diameters (0·37 and 0·65 μm) were greater than those of Al2O3 and Al doped Y-PSZ powders. A lesser volume of finer particles (<0·40 μm) and a greater volume of particles with diameters in the range of 0·40–1·05 μm were observed.
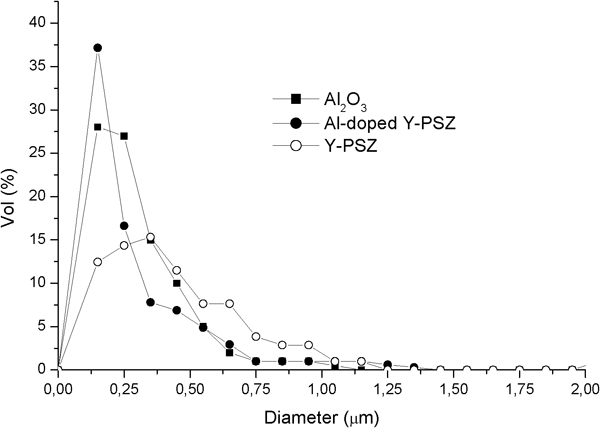
Particle size distribution curves of different powders: Al2O3, Y-PSZ and Al doped Y-PSZ
Figure 2a–c shows SEM images of Al2O3, Y-PSZ and Al doped Y-PSZ powders respectively. The shape of the Al doped Y-PSZ particle was different with respect to those of the Al2O3 and the Y-PSZ; the Al2O3 and Y-PSZ particles showed smooth and sharp edges, while the Al doped Y-PSZ presented round and rough ones. This last shape contributed to an increase in the Sg of the Al doped Y-PSZ powder. As we have mentioned, the Al doped Y-PSZ powder contained 0·3 wt-%Al2O3. Phase equilibrium studies have shown that Al2O3 and ZrO2 are compatible.11 Al2O3 does not form a solid solution with zirconia due to its low solubility; therefore, a surface coating of Al2O3 on ZrO2 is expected. The finer particles, the particle shape and the surface coating of Al doped Y-PSZ were responsible for its higher specific surface area with respect to that of both Al2O3 and Y-PSZ.
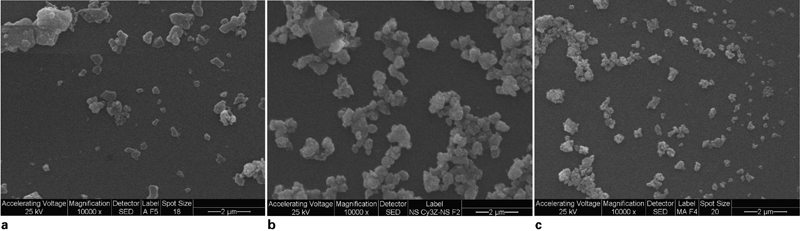
Images (SEM) of different powders:
Figure 3 shows the zeta potential versus pH curves of the different powders. The IEPs of the Y-PSZ, Al2O3 and Al doped Y-PSZ powders were found to be 7, 8·5 and 8·9 respectively. The Al2O3 and Y-PSZ IEPs were in agreement with those reported in the literature for these powders;2, 12 however, the IEP of the Al doped Y-PSZ powder was close to that of the Al2O3 and higher than that of the Y-PSZ. Thus, the Al2O3 surface coating shifted the pHIEP of the Y-PSZ from 7 to 8·9. The surface charge properties of the Al doped Y-PSZ particles changed from Y-PSZ-like to Al2O3-like. The magnitudes of the negative zeta potential at pH 9 were −35, −13 and −0·77 mV for Y-PSZ, Al2O3 and Al doped Y-PSZ respectively.
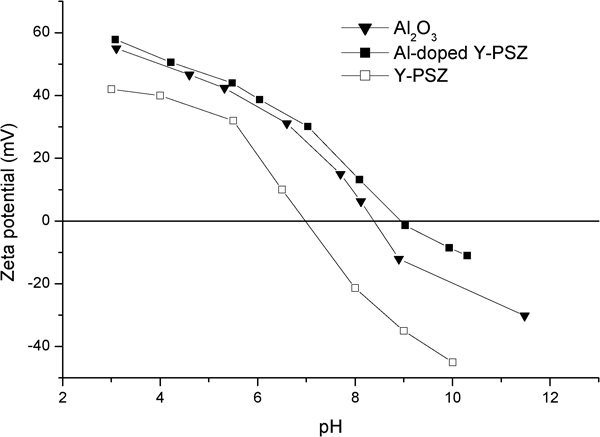
Zeta potential versus pH curves of Al2O3, Y-PSZ and Al doped Y-PSZ powders
Figure 4 shows the mean particle diameter d50 as a function of pH for the Al2O3, Y-PSZ and Al doped Y-PSZ powders. Al2O3 could be dispersed at pH values <6·5; the d50 increased with increasing pH from 6·5 to 7·5, and then it remained nearly constant with further increase in pH. In the pH range from 3 to 6, the particles became well dispersed, indicating an increase in electrostatic repulsion between particles. At pH >6, a reduction in the electrostatic repulsion between particles was expected due to the strong flocculation; the van der Waals attraction forces were dominant and caused aggregation of the particles. This aggregation still remained up to pH 9·6, indicating a low negative surface charge of the Al2O3 powder in that basic pH region.
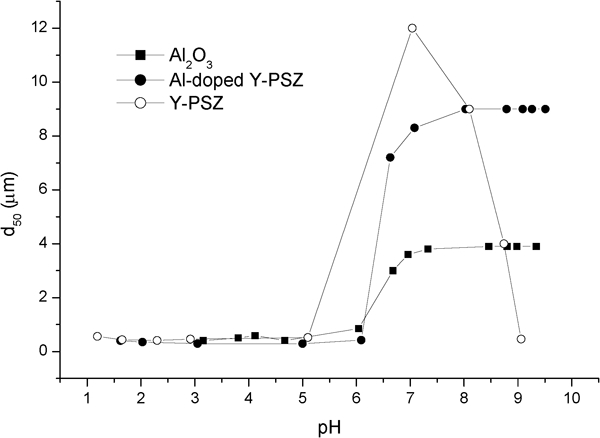
Mean particle diameter d50 as function of pH for Al2O3, Y-PSZ and Al doped Y-PSZ powders
The aqueous dispersion of the Al doped Y-PSZ was similar to that of the Al2O3; the Al doped Y-PSZ powder could be dispersed at pH <6·5; aggregation between particles occurred in the pH range of 7·5–9·6; within this pH range, the size of the Al doped Y-PSZ flocs was approximately twice larger than that of Al2O3. The aqueous dispersion of Y-PSZ was similar to that of Al doped Y-PSZ up to pH 8·1; at pH values >8·1, the Y-PSZ particles became well dispersed, indicating an increase in the electrostatic repulsion between particles. The Y-PSZ powder could be dispersed at pH 9; this behaviour was markedly different from that observed for Al2O3 and Al doped Y-PSZ powders. Thus, the magnitude of the negative surface charge of Y-PSZ at pH 9 was high enough to impart stability to the suspensions.
The d50 versus pH curves were consistent with the zeta potential measurements (Fig. 3):
Al2O3 and Al doped Y-PSZ powders could be dispersed at pH <6·5, while Y-PSZ powder at pH <5·5 due to its high positive zeta potential
the magnitude of Al2O3 and Al doped Y-PSZ powders’ zeta potential in the pH region 7·5–9·6 was not high enough to stabilise the suspensions
the higher negative zeta potential of Y-PSZ at pH 9 with respect to those of Al2O3 and Al doped Y-PSZ produces a well dispersed suspension.
The degree of particle aggregation in the aqueous dispersion was determined by the magnitude of the powder surface charge and the Hamaker constant. Since the magnitude of the surface charge in the pH range of 7–8 was low for the three powders, the stronger attraction between the Y-PSZ particles (with and without Al2O3) and, consequently, the larger size of their flocs with respect to Al2O3 could be attributed to the higher value of the Hamaker constant for Y-PSZ, which was about twice higher than that for Al2O3.13
Optimum NH4PA concentration, amount of NH4PA adsorbed and zeta potential for different compositions
The optimum NH4PA concentration, i.e. that which gave slips with the lowest viscosity, was determined by measuring the viscosity of 35 vol.-% slips at a shear rate γ of 542 s−1 as a function of the amount of NH4PA solution added at pH 9 for the slips with the different compositions. These results are presented in Table 2. The optimum NH4PA concentration decreased from 0·34 to 0·25 wt-%, from 0·4 to 0·21 wt-% and from 0·52 to 0·11 wt-% by substituting 10·5, 22 and 50 vol.-% of Al doped Y-PSZ by Y-PSZ in the mixtures respectively. For the mixtures with the same compositions, the viscosity values were lower for the slips prepared with Y-PSZ.
Optimum NH4PA concentration for different compositions of Al2O3–ZrO2 suspensions at pH 9
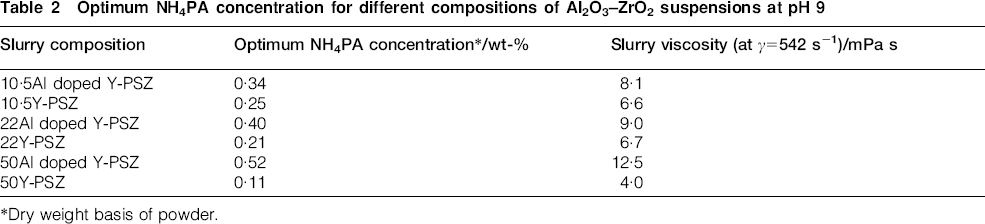
*Dry weight basis of powder.
Figure 5 shows the amount of NH4PA adsorbed for 35 vol.-% slips with the optimum NH4PA concentration at pH 9 as a function of zirconia content in the mixtures. The adsorption of the polyelectrolyte increased from 0·20 to 0·33 mg m−2 with increasing Al doped Y-PSZ concentration from 0 to 50 vol.-% respectively. As was previously shown in the zeta potential curves (Fig. 3), the substitution of Al2O3 by Al doped Y-PSZ in the mixtures decreased the magnitude of the negative zeta potential at pH 9; consequently, a high adsorption of the anionic polymer was expected. The electrostatic repulsion between the negatively charged powders and the anionic polymer decreased with increasing Al doped Y-PSZ content, thereby increasing the amount of NH4PA adsorbed. On the contrary, the polymer adsorption decreased with increasing Y-PSZ content in the mixtures; this could be attributed to the increase in the magnitude of the negative zeta potential by substituting Al2O3 for Y-PSZ in the mixtures (Fig. 3).
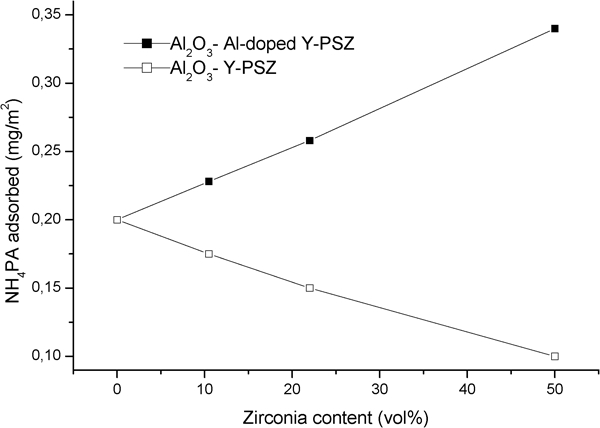
Amount of NH4PA adsorbed for 35 vol.-% slips with optimum NH4PA concentration as function of zirconia content in mixtures
The adsorption behaviour of the Al2O3–ZrO2 mixtures at pH 9 is not of ‘high affinity type’;14 the electrostatic repulsion at the surface imparts a barrier for adsorption, which limits adsorption to low amounts.10 However, the fact that adsorption occurred under these conditions indicated that there was a ‘specific’ or ‘chemical’ segment–surface interaction, which overcompensated the repulsive electrostatic forces. Previous studies on alumina15 and coated silicon nitride16 also found a detectable adsorption of anionic polyelectrolytes when the polyelectrolyte and the surface had the same charge sign. For the compositions with the same zirconia content, the NH4PA adsorption was higher for Al doped Y-PSZ compared with that of Y-PSZ; this adsorption difference tended to be more pronounced with increasing zirconia content.
Figure 6 shows the zeta potential versus pH curves of different slips: Al2O3, 50Al doped Y-PSZ and 50Y-PSZ with the optimum amount of NH4PA solution added. The adsorption of NH4PA shifted the pHIEP of Al2O3 (Fig. 3) from pH 8·5 to 3·14; the IEPs of the mixtures 50Y-PSZ and 50Al doped Y-PSZ were found to be 4·25 and <3 respectively. The strong adsorption of the polyelectrolyte on the mixture 50Al doped Y-PSZ (Fig. 5) resulted in an increase in the magnitude of the negative zeta potential in the pH range of 3·25–10·1. The higher pHIEP of the mixture 50Y-PSZ with respect to that of 50Al doped Y-PSZ and Al2O3 was a consequence of the lower adsorption of the polyelectrolyte (Fig. 5).
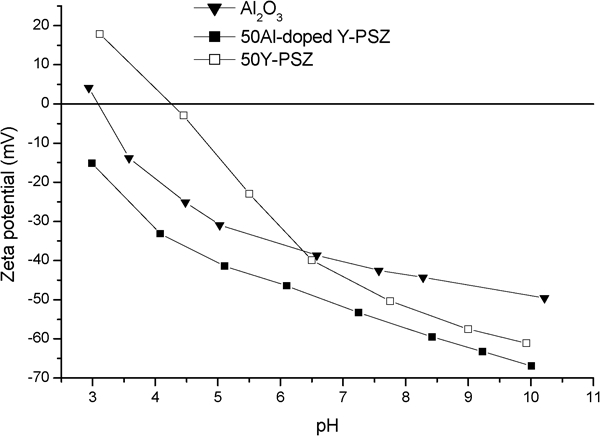
Zeta potential versus pH curves of different slips: Al2O3, 50Al doped Y-PSZ and 50Y-PSZ with optimum amount of NH4PA solution added
The zeta potential value at pH 9 was −45·5, −57·3 and −62·7 mV for Al2O3, 50Y-PSZ and 50Al doped Y-PSZ respectively. At pH 4·25–6·35, the negative zeta potential of the mixture 50Y-PSZ was lower than that of Al2O3; however, similar negative zeta potential values with respect to the mixture 50Al doped Y-PSZ were found in the pH range of 8–10. Since the NH4PA did not adsorb significantly on the mixture 50Y-PSZ at pH 9 (Fig. 5), the high negative zeta potential of the Y-PSZ powder (Fig. 3) contributed to the interfacial charge properties of the 50Y-PSZ mixture.
At pH 9, the suspensions with the optimum NH4PA concentration were dominated by repulsive forces; thus, they were stabilised. The adsorption of the negatively charged polyelectrolyte enhanced the negative surface charge of the powders. In addition, at pH 9, the electrostatic repulsion between the charged carboxylate groups prevents the accumulation of groups at the surface; the polyelectrolyte adsorbs in a stretched out configuration, which results in long range steric interactions of the NH4PA at the solid/liquid interface.14 Thus, the adsorbed molecules increased the electrosteric repulsion between particles; consequently, the slip viscosity attained the minimum value (Table 2).
Rheological properties
Figure 7a shows the apparent viscosity at 542 s−1 versus the zirconia content for stabilised Al2O3 Y-PSZ and Al2O3 Al doped Y-PSZ slips at pH 9 with different solid loadings. The measured flow curves were satisfactorily fitted with the Casson model (R = 0·99) throughout the whole range of shear rates tested (0·5–542 s−1; in the section on ‘Characterization techniques’). The Casson model equation is
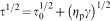
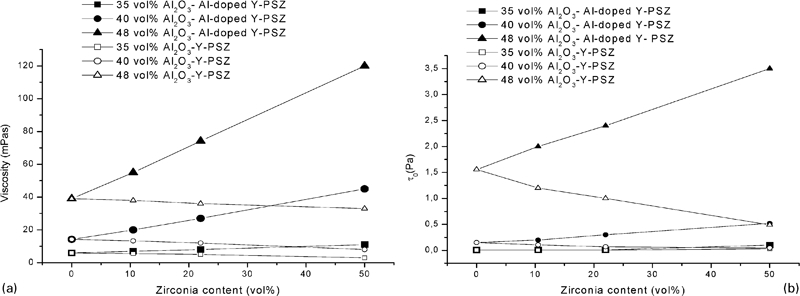
a viscosity at 542 s−1 and b τ0 versus zirconia content for stabilised Al2O3 Y-PSZ and Al2O3 Al doped Y-PSZ slips at pH 9 with different solid loadings
For Al2O3 Al doped Y-PSZ slips, the viscosity and τ0 values increased with increasing Al doped Y-PSZ content in the mixtures; while for Al2O3 Y-PSZ slips, a decrease in the viscosity and τ0 with increasing Y-PSZ content was found. For all the concentrations, the viscosity and τ0 values of Al2O3 Al doped Y-PSZ slips were higher than those of the Al2O3 Y-PSZ ones; these differences became larger as the zirconia content increased. The viscosity and τ0 values of 48 vol.-% slips prepared from 50Al doped Y-PSZ and 50Y-PSZ decreased from 118·8 mPa s and 3·42 Pa to 31·2 mPa s and 0·58 Pa respectively. Nevertheless, differences in the slopes of the viscosity curves between both slips for the different solid concentrations were observed. A greater slope of the viscosity curve with increasing solid loading was found for Al2O3 Al doped Y-PSZ slips, while the slopes of Al2O3 Y-PSZ viscosity curves were nearly the same for the different concentrations. As a consequence, for each zirconia content, the difference in the viscosity values between both slips became larger with increasing solid loading.
An increase in the slopes of the τ0 curves with increasing solid loading was found for both slips; thus, for Al2O3 Y-PSZ slips, the increase in the solid concentration had more effect on the τ0 values. As the solid content increases, particles are forced to approach each other and overlap their electrical double layers (electroviscous effect); as the repulsion between particles decreases, the number of flocs increases, as well as the quantity of entrapped liquid not available for flow.17 The increase in the yield stress with increasing solid loading was attributed to a higher frequency of the collisions between separate particles, increasing the resistance to flow. Therefore, the differences in the viscosity and τ0 values between the slips prepared from the different zirconia powders tended to be more pronounced with increasing both the zirconia content and the solid loading.
As was previously shown (Fig. 6), the negative zeta potentials at pH 9 for the slips with the same content of Y-PSZ and Al doped Y-PSZ were similar and high enough to impart stability to the suspensions. The higher viscosities and τ0 values of the suspensions prepared from Al doped Y-PSZ could be explained taking into account the particle effective size concept. The calculated volume fraction of solids corresponded to the solid loading of the slurries and did not consider hydrated and adsorbed layers around the particles. The distinction between size and effective size of the particles becomes important when high solid loading and/or particles with high specific surface area are used.17
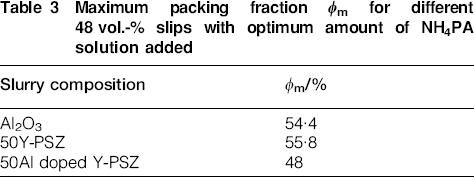
Table 3 lists the values of the maximum packing fraction φm for different 48 vol.-% slips: Al2O3, 50Al doped Y-PSZ and 50Y-PSZ with the optimum amount of NH4PA solution added. φm increased with decreasing the volume of solid sediment. Similar φm values were found for Al2O3 and 50Y-PSZ suspensions; however, significantly lower φm values were observed for 50Al doped Y-PSZ slips. This indicated that higher volumes of solid sediment were measured when the same content of Al2O3 or Y-PSZ was substituted by Al doped Y-PSZ, resulting in a reduction in the maximum particle packing. Consequently, the effective size of the Al doped Y-PSZ particles could be assumed to be larger than that of both Al2O3 and Y-PSZ. Since the specific surface area of the Al doped Y-PSZ particles was markedly higher than that of Al2O3 and Y-PSZ, a greater hydration surrounding the Al doped Y-PSZ particles was expected. Besides, the substitution of Al2O3 and/or Y-PSZ by Al doped Y-PSZ increased the polymer adsorption (Fig. 5). Therefore, the substitution of Al2O3 and/or Y-PSZ by Al doped Y-PSZ in the mixtures increased the effective solid volume fraction at a given solid loading and decreased the amount of free liquid available for flow, thereby increasing the viscosity and τ0 values. The differences in the viscosity and τ0 values tended to be more pronounced with increasing both the Al doped Y-PSZ content and the solid loading, confirming the hypothesis regarding the higher effective solid volume fraction of the Al doped Y-PSZ particles.
Maximum packing fraction φm for different 48 vol.-% slips with optimum amount of NH4PA solution added
Characterisation of green samples
Figure 8 shows the green density of cast samples prepared from 48 vol.-%Al2O3 Y-PSZ and Al2O3 Al doped Y-PSZ slips versus zirconia content in the mixtures. The green density curves for Al2O3–ZrO2 bodies were opposite to those of the viscosity versus zirconia content (Fig. 7a); as the slip viscosity decreased, a more dense packing of the samples could be obtained. The better slip dispersion of the Al2O3 Y-PSZ slips resulted in higher green density values for all the compositions. The difference in the green density values became greater as the zirconia content increased in accordance with the viscosity and yield stress results.
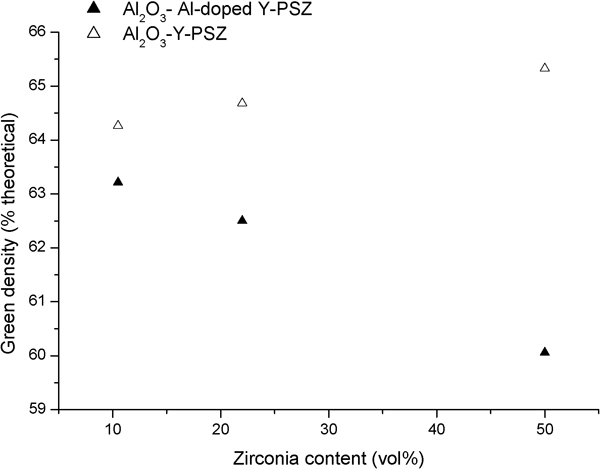
Green density of cast samples prepared from 48 vol.-%Al2O3 Y-PSZ and Al2O3 Al doped Y-PSZ slips versus zirconia content in mixtures
In the stable suspensions, the particles could pack in an ordered way due to the repulsive forces existing between them; the low deposition rate also enabled each particle to search for energetically favourable positions. In this condition, dense packing of particles could be obtained. As the slip viscosity increased, the mutual approach of the particles increased; hence, the searching of one particle for a low energy position was disturbed and hindered to achieve an optimum particle packing. Consequently, a less dense particle packing with increasing the slip viscosity could be expected. For Al2O3 Y-PSZ slips, green density values between 64·3% (10·5Y-PSZ) and 65·3% (50Y-PSZ) of theoretical density were found; while for Al2O3 Al doped Y-PSZ slips, the green density had values between 63·2% (10·5Al doped Y-PSZ) and 60·0% (50Al doped Y-PSZ) of theoretical density. Thus, the substitution of Y-PSZ by Al doped Y-PSZ in the Al2O3–ZrO2 mixtures increased the slip viscosity with NH4PA resulting in a less dense packing of cast samples.
Conclusion
The rheological properties of Al2O3–ZrO2 suspensions prepared with two different zirconia powders (Y-PSZ and Al doped Y-PSZ) and the particle packing behaviour during slip casting were compared. The substitution of Al2O3 and/or Y-PSZ by Al doped Y-PSZ in the mixtures resulted in significantly greater adsorption of NH4PA dispersant. However, the viscosity and yield stress values of Al2O3 Al doped Y-PSZ slips were higher than those of Al2O3 Y-PSZ slips for all the compositions and solid loading studied. This behaviour could be explained by a larger effective size of the Al doped Y-PSZ particles, which resulted in a higher effective solid volume fraction and a lower amount of free liquid available for flow. The substitution of Al2O3 and/or Y-PSZ by Al doped Y-PSZ in the mixtures resulted in a less dense packing of cast samples.