
Abstract
The polycrystalline Ba1–xBixFe0·9Sn0·1O3 (x = 0·1, 0·2, 0·3, 0·4 and 0·5) ceramics were prepared using a solid state reaction process, and the effect of Bi substitution on the microstructures and the electrical properties is investigated. The as sintered Ba1–xBixFe0·9Sn0·1O3 ceramics showed the cubic perovskite structure with small amount of spinel BaFe2O4 and some residual Fe2O3. As the Bi concentration increased, the ceramic grain size decreased and the pores or holes were reduced for the ceramics. The values of room temperature resistivity, thermistor constant and activation energy of the Ba1–xBi x Fe0·9Sn0·1O3 thermistor ceramics, increasing with the rise of Bi content, were in the range of 1–1290 kΩ cm, 4469–7328 K and 0·385–0·632 eV respectively. The electrical properties of Ba1–xBixFe0·9Sn0·1O3 thermistor ceramics are mainly attributed to the contribution of grains, grain shells and grain boundaries by the impedance analysis.
Introduction
Most of negative temperature coefficient (NTC) thermistor ceramics are composed of the solid solutions of transition metal oxides, such as Mn3O4, Co3O4, NiO, CuO, Cr2O3 and Fe2O3, with the spinel type structure of the general formula AB2O4.1–6 The spinel structural thermistors are extensively used in the field of circuit compensation, aerospace, cryogenic, automotive, temperature measurement and control applications.7,8 Furthermore, the metal oxides such as ZnO, MgO, ZrO2 and SiO29–12 are also added into the spinel thermistors for the improvement of electrical properties and aging behaviour. Besides the spinel type ceramics, the other few used materials for thermistor applications are perovskite structural ceramics.13,14 It is well known that thermistor materials from spinel system can have very attractive thermistor constant values, good thermal stability and the steady sintering process. For the spinel type materials, the thermistor constant (β) at the temperature region of 25–300°C is commonly in the range of 3000–4500 K, and it is very difficult to improve the β value by modification. However, it is interesting that the perovskite structural thermistors can achieve the higher thermistor constant, and some of the perovskite ceramics can even obtain the β value of 6500 K at the room temperature resistivity of 8 MΩ cm.13 This means that the perovskite type NTC ceramics can be one of the potential candidates for the use of high β value devices. In a previous study, the BaFexSn1−xO3 compound was found to be one excellent thermistor ceramic. For the thermistor materials, however, the β value is still below 5000 K in the room temperature resistivity of 217 kΩ cm.15 In the present work, it is proposed that the β value is improved dramatically by the addition of Bi into BaFe0·9Sn0·1O3 compound. Then, the microstructures and electrical properties of Ba1–xBixFe0·9Sn0·1O3 ceramics are systematically investigated.
Experimental
The ceramic phases of BixBa1−xFe0·9Sn0·1O3 (x = 0·1, 0·2, 0·3, 0·4 and 0·5) were prepared in two steps. High purity BaCO3, Bi2O3, Fe2O3 and SnO2 powders were weighed in appropriate proportions, as shown in Table 1. The weighed powders and alcohol were ball milled for 12 h in black agate jar using agate ball as grinding media. The ball milled slurries were dried at 120°C in an oven for 2 h. The dried powders were ground carefully in an agate mortar and passed through a 250 mesh sieve. The granulated powders were calcined in high alumina crucibles at 900°C for 6 h. Ten millilitre of 5 wt-% polyvinyl alcohol solution was added into the calcined powders of 20 g. After drying, the mixtures were ground in mortar and pressed into cylindrical disc with an 18 mm diameter and 1·5 mm thickness at 150 MPa. The discs were sintered in an air at 1020–1150°C for 2 h and then polished with fine emery paper to make their faces flat and parallel. The discs were finally coated with conductive silver paint and dried at 550°C for 40 min before carrying out resistivity temperature measurements.
Compositions, sintered temperatures and values of ρ25, β25/85 and Ea from BixBa1−xFe0·9Sn0·1O3 NTC ceramics
Room temperature X-ray diffraction (XRD) was performed on a D8 Bruker diffractometer using Cu Kα (λ = 1·540598 Å) radiation to examine the phase purity of the system. Microstructures of sintered samples were observed using scanning electron microscopy (JSM-5610LV/Noran-Vantage) at 20 kV. The DC electrical resistance of thermistor ceramics was measured using a digital multimeter (Fluke 45) from 25 to 200°C with a step of 5°C. The |Z|–f spectra of the thick films were measured using Agilent impedance Analyzer (Agilent 4294A) controlled by a personal computer over a frequency range of 40 Hz to 110 MHz. Initially, open and short circuit measurements were carried out in order to correct the data taken from the sample by subtracting parasitic contributions. The data were partly cut at high frequency ends where appropriate in order to not display and fit sample response dominated by noise. The impedance data were plotted in the complex plane, a plot of the real component Z′ versus the imaginary component Z″. The measured samples were placed in a sample holder with a two-electrode configuration.
Results and discussion
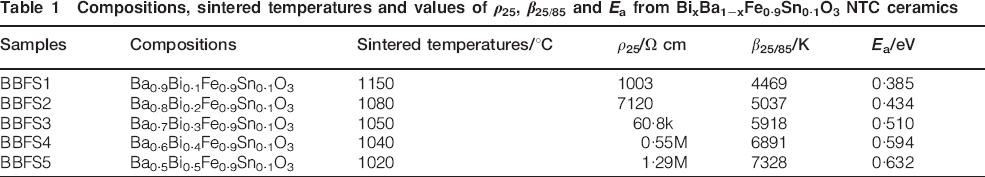
The XRD patterns of BixBa1−xFe0·9Sn0·1O3 (x = 0·1, 0·2, 0·3, 0·4 and 0·5) ceramics sintered at various temperatures are shown in Fig. 1. For all the thermistor ceramics, most peaks can be indexed to the cubic perovskite structure with the space group Fm-3m, which demonstrates that the majority phase of the samples is BixBa1−xFe0·9Sn0·1O3 compounds. However, some peaks (marked with inverted triangle and star in Fig. 1a) cannot be indexed to the BixBa1−xFe0·9Sn0·1O3 structures, whereas the impurity peaks can be indexed by BaFe2O4 and SnO2. From Fig. 1b, it is observed that the higher Bi introduction undergoes a small shift to the higher angles in the peak position when compared to that of BixBa1−xFe0·9Sn0·1O3 with the lower Bi content. For the slight change in peak position, it may be attributed to the effect of Ba replacement by Bi in BaFe0·9Sn0·1O3 arising as a result of relative difference in their ionic size. Owing to the fact that the ionic radius of Ba2+ is larger than that of Bi3+ (1·61 and 1·31 Å respectively), the Bi introduction in BaFe0·9Sn0·1O3 will induce a small decrease of the lattice parameter and leads to the occurrence of the small shift to high angles in peak position.
X-ray diffraction patterns of BixBa1−xFe0·9Sn0·1O3 (0·1≤x≤0·5) ceramics
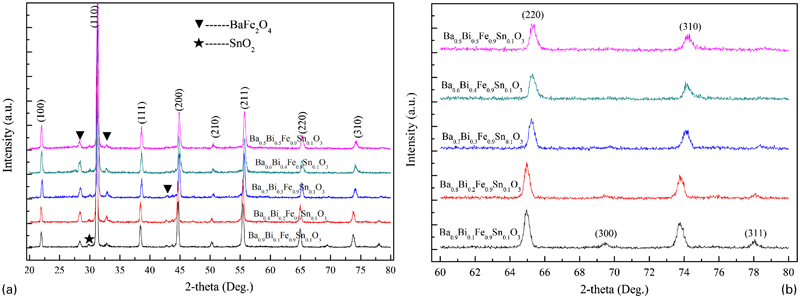
The SEM images of the sintered BixBa1−xFe0·9Sn0·1O3 ceramics (x = 0·1, 0·2, 0·3, 0·4 and 0·5) are shown in Fig. 2. For the sample of Bi0·1Ba0·9Fe0·9Sn0·1O3 ceramic sintered at 1150°C, the larger grains and more pores are observed, which denotes that the sintering temperature of the sample is still capable to optimise for the gaining of denser ceramic. With further increase of the Bi content in the ceramics, the small and dense grains occur. Simultaneously, it is found that for the ceramics at various compositions, the grain size decreases slightly with the increasing Bi contents due to the formation of liquid phase from the Bi compound at grain boundaries. It is well known that the driving force of grain growth can be induced by the elimination of grain boundary area and the increase of energy of the grain boundary.16 Thus, the occurrence of liquid phase sintering behaviour reduces the area and energy of grain boundary, and leads to the retardation of grain growth in the ceramics.17
Images (SEM) of BixBa1−xFe0·9Sn0·1O3 ceramics at various compositions
Figure 3a shows the relationship between the electrical resistivity ρ and celsius temperature for the BixBa1−xFe0·9Sn0·1O3 ceramics. It is obvious that the resistivity decreases exponentially with increasing temperature, and the substitution of Bi3+ for Ba2+ ions in the compounds leads to the increase of the room temperature resistivity. For the thermistor ceramics, the relationship between the electrical resistivity and the reciprocal of absolute temperature is shown in Fig. 3b. From the figure, a linear relation between the two parameters is observed, indicating typical NTC thermistor characteristics.
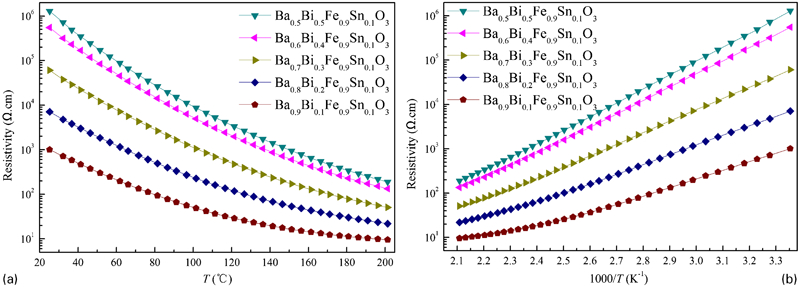
a relationship between electrical resistivity ρ and temperature for BixBa1−xFe0·9Sn0·1O3 NTC thermistors and b relationship between ρ and reciprocal of absolute temperature for BixBa1−xFe0·9Sn0·1O3 NTC thermistors
The calculated activation energy Ea and thermistor constant (β25/85) of the BixBa1−xFe0·9Sn0·1O3 (0·1≤x≤0·5) NTC thermistors are summarised in Table 1, together with the resistivity at 25°C (ρ25). The values of ρ25, β25/85 constant and Ea of the NTC thermistors with different compositions are in the range of 1–1290 kΩ cm, 4469–7328 K and 0·385–0·632 eV respectively. This indicates that the electrical properties of the NTC thermistors can be controlled by the change of the compositions. When the room temperature resistivity in the thermistors is <1·5 MΩ cm, particularly, the higher thermistor constant up to 7000 K is still obtained. For practical applications, such a high thermistor constant is very desirable because that its resistivity is more sensitive to accurate variation of temperature. The increasing room temperature resistivity with the Bi substitution can be elucidated by the following. As observed in Fig. 2, the increasing Bi content leads to the occurrence of smaller grains, which suggests that the large number of grain boundaries, acting as scattering centres for the flow of electrons, occurs and therefore increases the resistivity. The increase in Bi concentration in the BixBa1−xFe0·9Sn0·1O3 ceramics results in a decrease in the amount of Fe4+ ions, which are responsible for electronic conductivity,15 giving rise to the enhancement in the room temperature resistivity. Based on the foregoing electrical properties of the NTC thermistors, it is clear that the values of ρ25 and β25/85 constant are adjustable to the desired values for the thermistor application, depending on the Bi content. From the standpoint of industrial application, simultaneously, it is proposed that the BixBa1−xFe0·9Sn0·1O3 (0·1≤x≤0·5) ceramics are suitable for the fabrication of high performance NTC thermistors with high thermistor constant and moderate room temperature resistivity.
Impedance spectroscopy (IS) is a powerful tool of characterising the electrical properties of semiconductor materials.18 A well matching equivalent circuit based on impedance Z* and modulus M* spectra represents some important physical meaning occurring inside the ceramic samples.19 It is well known that most of the real ceramics contain grain, grain shell and grain boundary regions, which individually have very different physical properties.20 Especially for the PTC thermistor, the existence of grain boundary effect is crucial.21 However, for the NTC thermistor, there are more complex factors that can seriously affect the NTC thermistor behaviour. Thus, it is very necessary to analyse the electrical properties of NTC thermistors by IS.
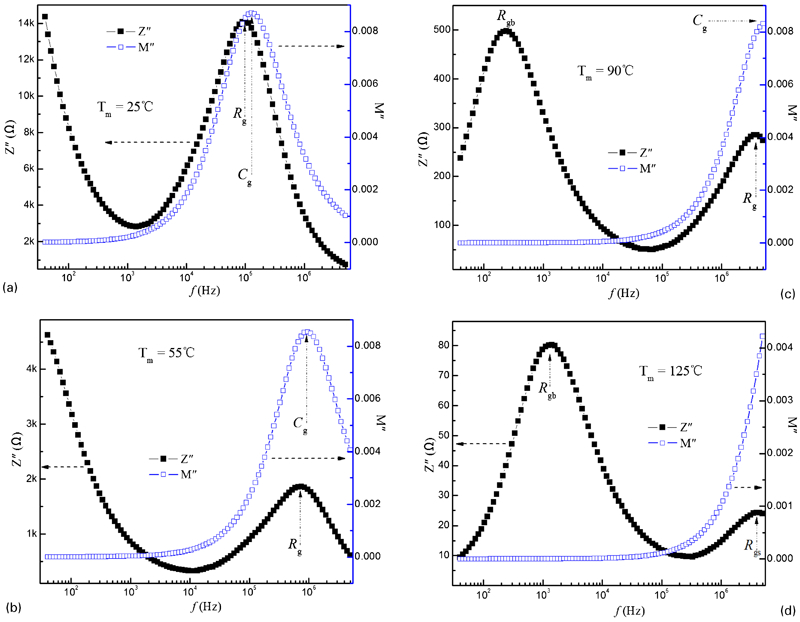
Representative impedance plane plots Z* for BBFS1 sample at 25°C are shown in Fig. 4a. BBFS1 sample exhibits three clear peaks in Z″–f spectrum and one peak associated with the contribution of grains at high frequency in M″–f spectrum. In Fig. 4b, simultaneously, it can be seen that the Cole–Cole plot shows three arcs: one for low frequency, which corresponds to grain boundary contribution of the BBFS1 sample; another one at intermediate frequencies, which is attributed to the contribution of grain shells; and the last one at high frequency, which depends on the grains of BBFS1 ceramic sample. In order to account for the characteristics from Fig. 4, an equivalent circuit used to fit the Cole–Cole plots is shown in the inset of Fig. 4b, where ‘gb’ stands for the grain boundaries, ‘g’ for the grains, ‘gs’ for the grain shells, ‘R’ for the electrical resistance and ‘Q’ for the non-ideal capacitor substituting for the ideal capacitor C. Q substitution for C is the reason that for most of the real semiconducting ceramics, it is often observed that most of impedance plane plots deviate from the idea Debye model and show the relaxation behaviour.22 Hence, the occurrence of deviation behaviour denotes that C should be replaced by Q. The fitted results by the equivalent circuit are displayed in Fig. 4b. It is seen that the fitting Cole–Cole plot of BBFS1 ceramic is almost in agreement with the experimental plot.
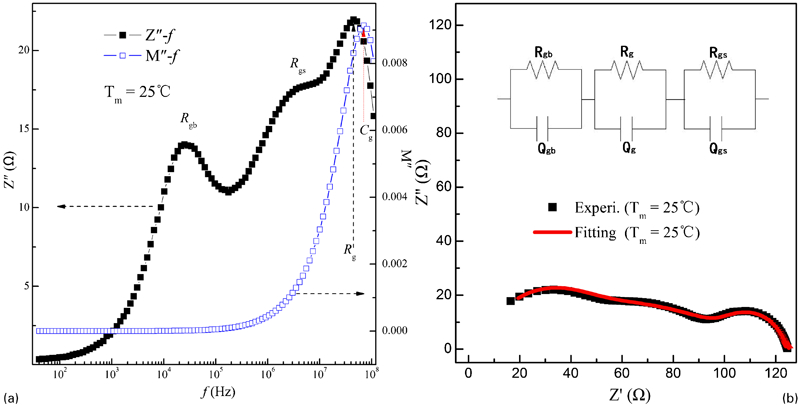
a frequency dependence of Z″ and M″ and b complex impedance plot for Ba0·9Bi0·1Fe0·9Sn0·1O3 ceramic: inset of b shows equivalent circuit used to model electroceramics
The Z″–f and M″–f spectra of BBFS2 sample are shown in Fig. 5. Three peaks in Z″–f spectrum and one peak in M″–f spectrum are observed at the measured temperature Tm = 25°C. As in Fig. 4a, the two peaks in the low and mid-frequency regions of Z″–f spectrum from Fig. 5 are associated with the contribution of grain boundaries and grain shells respectively. The peak at high frequency in Z″–f and M″–f spectra measured at 25°C is believed to the contribution of grains. When the measured temperature Tm = 65°C, the peaks in Z″–f and M″–f spectra shift to higher frequency regions and the peak to the grains is beyond the frequency limit. For the impedance plots of BBFS2 sample measured at 25 and 65°C, the Cole–Cole plots are fitted by the same equivalent circuit as the inset of Fig. 4b. From Fig. 6a and b, it is found that the fitting data are also well matched with the experimental data, which shows that the electrical properties of BBFS2 sample are surely composed of three electrical components.
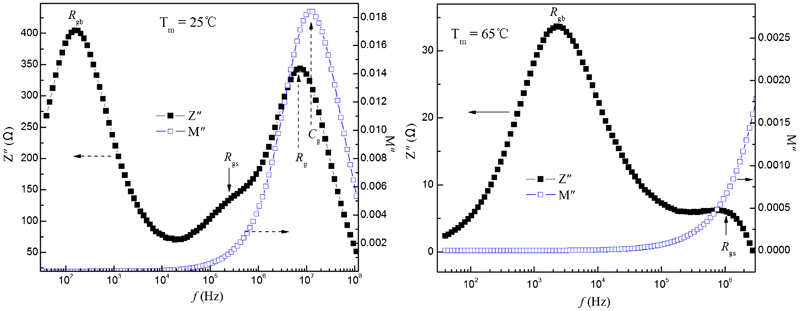
Combined (Z″, M″) spectroscopic plot for Ba0·8Bi0·2Fe0·9Sn0·1O3 ceramic
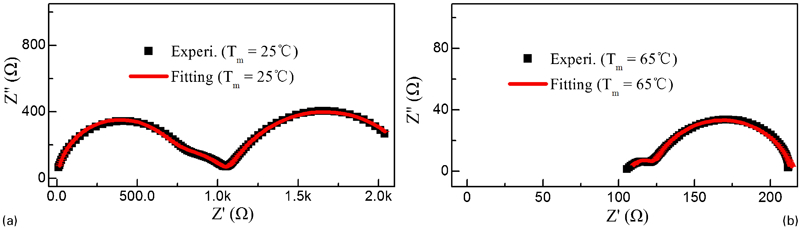
Complex impedance plots for Ba0·8Bi0·2Fe0·9Sn0·1O3 ceramic at two measured temperatures: a Tm=25°C; b Tm=65°C
Figure 7 shows the Z″–f and M″–f spectra of BBFS3 sample at various measured temperatures. From the Z″–f spectrum in Fig. 7a, one clear peak at high frequency and one incomplete peak at low frequency are observed at 25°C. With the increasing measured temperature up to 40°C, the incomplete peak is clearly displayed at lower frequency and one weak peak is also found at intermediate frequency in Fig. 7b and c. When the measured temperature Tm = 90°C, the weak peak at intermediate frequency in Fig. 7d is very apparent. Simultaneously, the impedance spectra of Fig. 8 exhibit three arcs except for that of Fig. 8d due to the frequency limit at lower frequency. These indicate that the electrical properties of Ba0·7Bi0·3Fe0·9Sn0·1O3 ceramic still contributed to three electrical components corresponding to grain boundaries, grain shells and grains. The peak frequencies at high frequency in M″–f and Z″–f spectra are basically in the same frequency region, which suggests that the electrical response at high frequency is undoubtedly attributed to the contribution of grains. Hence, it is believed that the equivalent circuit in the inset of Fig. 4b is also used to fit the impedance plots of Fig. 8. From Fig. 8, it is observed that all the fitted lines are well consistent with the experimental data at various measured temperatures.
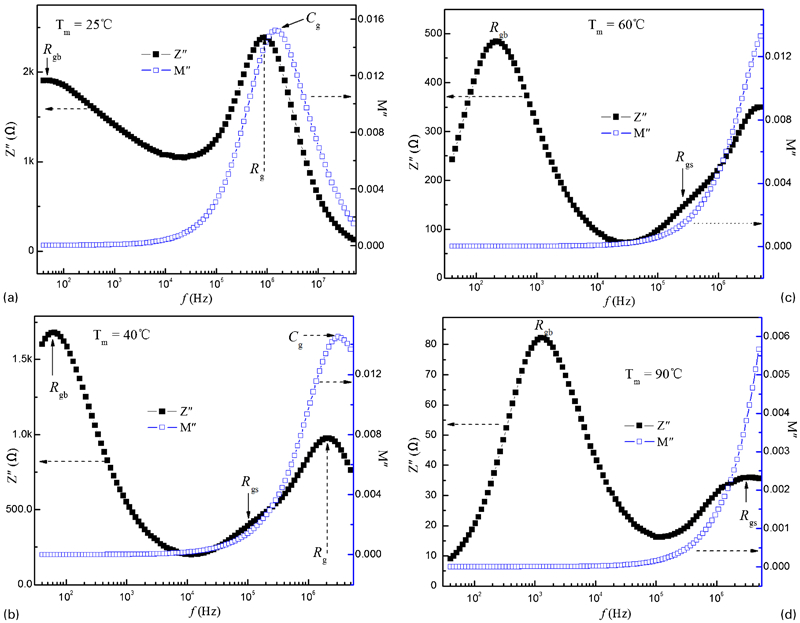
Impedance Z″ and modulus M″ spectroscopic plots for Ba0·7Bi0·3Fe0·9Sn0·1O3 ceramic at different measured temperatures: a Tm=25°C; b Tm=40°C; c Tm=60°C; d Tm=90°C
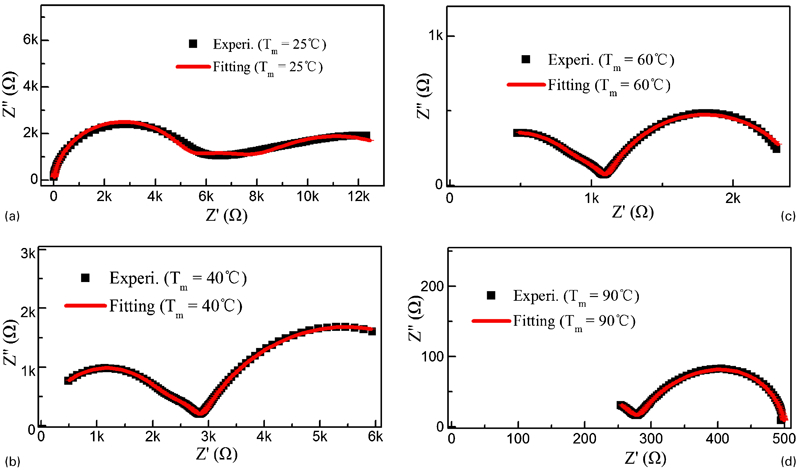
Complex impedance plane plots for experimental and fitted data at four temperatures in Ba0·7Bi0·3Fe0·9Sn0·1O3 ceramic: a Tm=25°C; b Tm=40°C; c Tm=60°C; d Tm=90°C
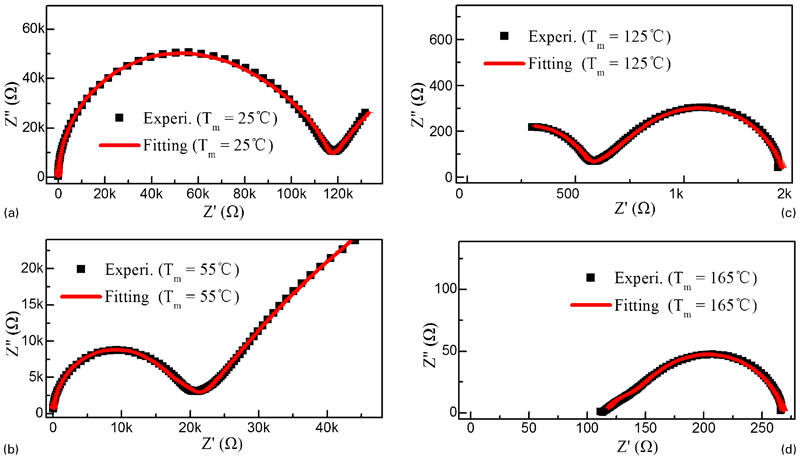
For the samples BBFS4 and BBFS5, the impedance spectra at different measured temperatures are plotted in Figs. 9– 12. In Z″–f spectra of Figs. 9 and 11, it is found that at lower measured temperatures, two peaks associated with the grains and grain boundaries are observed in Fig. 9(a–c) and in Fig. 11(a–c); however, when the measured temperature is increased to higher measured temperatures, the peaks representing the grain shell effect become visible at high frequencies and the representative arcs are also obtained in Figs. 10d and 12d. In addition, the impedance characteristics in other spectra of Figs. 9– 12 are similar to that in Figs. 4– 8. Hence, it is believed that the electrical properties of the BBFS4 and BBFS5 samples are still ascribed to the contribution of grain boundaries, grain shells and grains. Simultaneously, Figs. 10 and 12 show the well matching between the fitted and the experimental data, which again confirms the assumed constituent of three paralleled RQ elements in series from the BBFS4 and BBFS5 samples.
Frequency dependence of Z″ and M″ for Ba0·6Bi0·4Fe0·9Sn0·1O3 ceramic at four measured temperatures: a Tm=25°C; b Tm=55°C; c Tm=90°C; d Tm=125°C
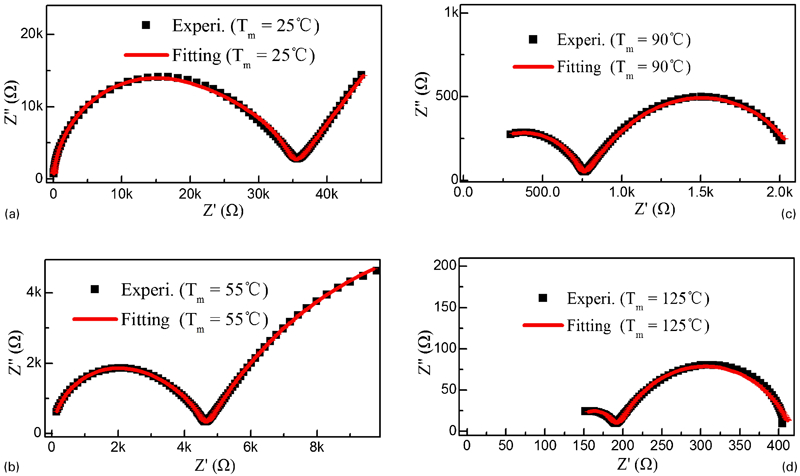
Complex impedance plots for Ba0·6Bi0·4Fe0·9Sn0·1O3 ceramic at four measured temperatures: a Tm=25°C; b Tm=40°C; c Tm=60°C; d Tm=90°C
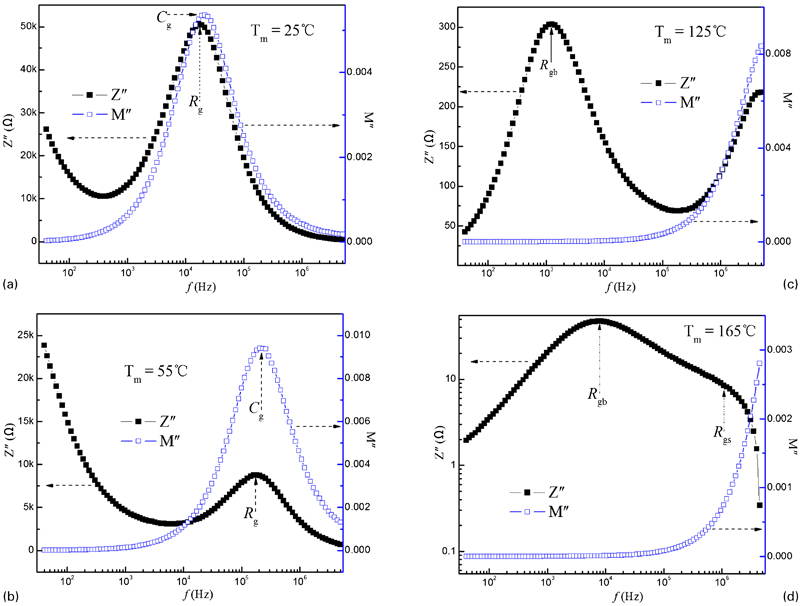
Variation Z″ and M″ of Ba0·5Bi0·5Fe0·9Sn0·1O3 ceramic as function of frequency at various temperatures: a Tm=25°C; b Tm=55°C; c Tm=125°C; d Tm=165°C
Complex impedance plane plots for Ba0·5Bi0·5Fe0·9Sn0·1O3 ceramic at four measured temperatures: a Tm=25°C; b Tm=40°C; c Tm=60°C; d Tm=90°C
Based on the above impedance analysis and the fitted results for the thermistor ceramics, the resistance values of extracted Rgb, Rgs and Rg as a function of compositions x are shown in Fig. 13. In Fig. 13, it is observed that, at lower Bi content, the resistance values of Rg are higher and Rgb are lower than those of the other electrical components; with the further increase of Bi content in Ba1–xBixFe0·9Sn0·1O3 ceramics, the resistance values of Rg are high and Rgs are low relative to those of the other electrical components, which indicates that the resistive magnitude of electrical components in the ceramics is seriously affected by the Bi content. From the Z″–f and M″–f spectra at different Bi content, furthermore, it is found that the peaks corresponding to grains at high frequency are in disaccord with the following order: τZ>τM, which shows that the present mismatch between the peaks of M″ and Z″ (τZ>τM) at high frequency is an evidence of localised conduction.23,24
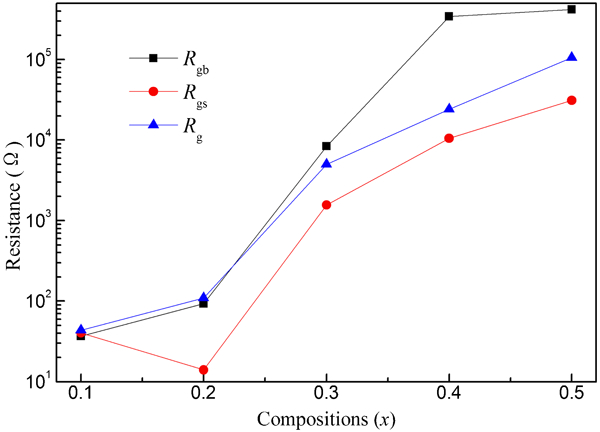
Compositions dependence of resistances Rgb, Rgs and Rg for BixBa1−xFe0·9Sn0·1O3 NTC ceramics at room temperature
Conclusion
Major phases present in the prepared ceramics were identified as the cubic perovskite type BixBa1−xFe0·9Sn0·1O3. With the increase of the Bi content, a small shift to high angles in peak position was found in the thermistor ceramics. The grain size decreased and the pores were reduced with an increase in the Bi content. The increasing values of ρ25, β25/85 constant and Ea of the NTC thermistors were 1–1290 kΩ cm, 4469–7328 K and 0·385–0·632 eV respectively. In particular, the substituted Bi led to the achievement of the higher β25/85 constant (∼7000 K), as well as the moderate room temperature resistivity (<1·5 MΩ cm). It is believed that the Bi substituted BixBa1−xFe0·9Sn0·1O3 ceramics are useful for industrial applications as high performance NTC thermistors over a wide temperature range. Impedance results demonstrate that the electrical properties of the novel thermistor ceramics are mainly attributed to the contribution of grains, grain shells and grain boundaries. Three paralleled RQ elements in series are used to fit the impedance data, and the fitted results are in good agreement with the experimental data.
Footnotes
Acknowledgements
Financial supports of the National Natural Science Foundation of China (grant no. 51102055) and the Natural Science Foundation of Guangxi (grant no. 2010GXNSFA013036) are acknowledged by the authors.