
Abstract
The cohesive crack model (CCM) is the most commonly accepted discrete crack approach for modelling concrete based materials. It is applied to ultra high performance fibre reinforced concrete (UHPFRC) in this study because it can be easily represented as cohesive interface elements in finite element modelling. Cohesive crack model using a bilinear traction–separation relationship is used to simulate the load–deflection behaviour of UHPFRC test specimens. Cohesive crack model based numerical simulation of three-point bend specimens are implemented using cohesive elements in ABAQUS FE software. Progressive crack propagation and failure mechanism of UHPFRC test specimens are simulated in order to predict their load capacities. Comparison of the simulation to existing experimental test results indicates that CCM with a bilinear traction–separation curve can provide predictions of both the load–deflection curves and peak load of 100 and 150 mm deep UHPFRC test specimens to = /−6% of the average for 50 and 100 mm wide beams and to = /+20% for 150 mm wide beams. Model predictions of the peak load for the 50 mm wide and 50 mm deep beams were to = /−25% of the average.
Keywords
Introduction
Cementitious materials are used extensively within the construction industry but their brittleness makes them prone to crack formation and propagation thus limiting the way in which they can be used.
Ultra high performance fibre reinforced concrete (UHPFRC) is a relatively recent category of cementitious materials whose fracture properties have been significantly enhanced by taking advantage of advances in material technology. Its mix design is mainly based on principles that aim to minimise defects such as microcracks and pore spaces in order to exploit a bigger proportion of the ultimate load carrying capacity provided by the constituents. 1 A UHPFRC mix is made more ductile by the addition of fibres which bridge microcracks within the mix and enable load transfer in cracked zones. The resulting UHPFRC material has significantly higher compressive and tensile strength compared to other concrete and much higher fracture energy and ductility.
Despite the many potential applications provided by these enhanced properties, the current use of UHPFRC is limited by both its high material and testing cost. The limited reliable test data available means that its mechanical behaviour is not fully understood.2,3
Numerical modelling and simulation has the potential to significantly reduce the number of experiment tests required for UHPFRC. Simulation can be used more cost effectively to investigate the influence on the mechanical response of specimens of varying factors such as test methods, specimen size and fibre content.
Fracture mechanics provides a logical theoretical framework for proposing models to explain the observed experimental facts and to provide additional insight into the behaviour of UHPFRC. For most concrete materials and structures, the relative size of the cohesive zone caused by microcracks is observed to be significant and hence requiring approaches other than linear elastic fracture mechanics that take the influence of this zone into consideration.
Therefore non-linear fracture mechanics and in particular cohesive zone models can be used to propose a theoretical framework for modelling of the cohesive zone and of its influence on the overall behaviour of materials such as UHPFRC. The development of the fracture (cohesive) zone at the microscale is extremely complex. However, on the macroscale, understanding of crack propagation can be enhanced by modelling the cohesive zone either as a discrete crack or as a smeared crack. 4
Cohesive crack model (CCM) is used in this study because of their ability to model discrete cracks at the macroscopic level by means of cohesive interface elements in finite element modelling. Cohesive crack model based numerical simulations of three point bend specimens are implemented using cohesive elements in ABAQUS FE software. The load–deflection curves and failure loads are determined by simulation. The predictions of this simulation are compared to available results for three point beam tests carried out on UHPFRC specimens.
Cohesive crack model
The CCM assumes that the stress–strain behaviour for concrete is isotropic linear elastic before cracking starts.
5
Cracks are initiated at a given point using criteria such as the maximum principle stress at that point reaching the tensile strength. The orientation of the crack at that point is perpendicular to the principle stress direction. The crack evolution is such that the cohesive stress (σ) is a function of the crack opening (w). For concrete, this function decreases with crack opening width (w) and is therefore called the softening curve. The function defining the curve can be written as
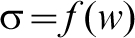
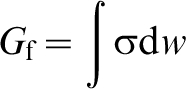
The area below the σ–w curve is equal to the fracture energy Gf such that
If the general shape of the σ–w curve for concrete based material is known, a good estimate of the curve for a specific mix can be made from a determination of fracture energy and tensile strength. 6 However, one of the limitations of the CCM is the difficulty in obtaining the parameters required as material inputs. While the difficulties of performing stable direct tensile test for concrete are well documented, 7 fracture energy values obtained by the commonly used three point test on notched specimens have been observed to be size dependent. 8
Unlike normal concrete where a bilinear softening curve is generally accepted as providing good results, there is still a lack of agreement as to which curve is best for UHPFRC. The ideal way to obtain the complete softening curve is via a stable direct tensile test which in practice has been found to be extremely difficult. 7 Inverse analysis from bending tests like three-point beam (TPB) has been adopted by several studies but differences still exist with suggestions including bilinear, 9 trilinear 10 and exponential 11 softening relations.
While CCM is very well suited to analysing failure by single or discrete cracks perpendicular to applied tensile loading, many materials have multiple cracks which are randomly distributed and oriented. The use of CCM is justified in this study where specimens are used in which the location of the predominant crack is known in advance to be in the notched section. Bilinear σ–w curve is adopted for the cohesive elements in ABAQUS whose formulation is based on the CCM. Values of tensile strength and fracture energy for mixes similar to that used in this study are obtained from literature.
Constitutive response of cohesive elements
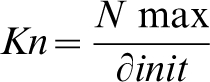
The cohesive elements in ABAQUS are formulated using a traction separation law that is typically characterized by peak strength (N) and fracture energy (GIC) (Fig. 1).It is also mode dependent. 12
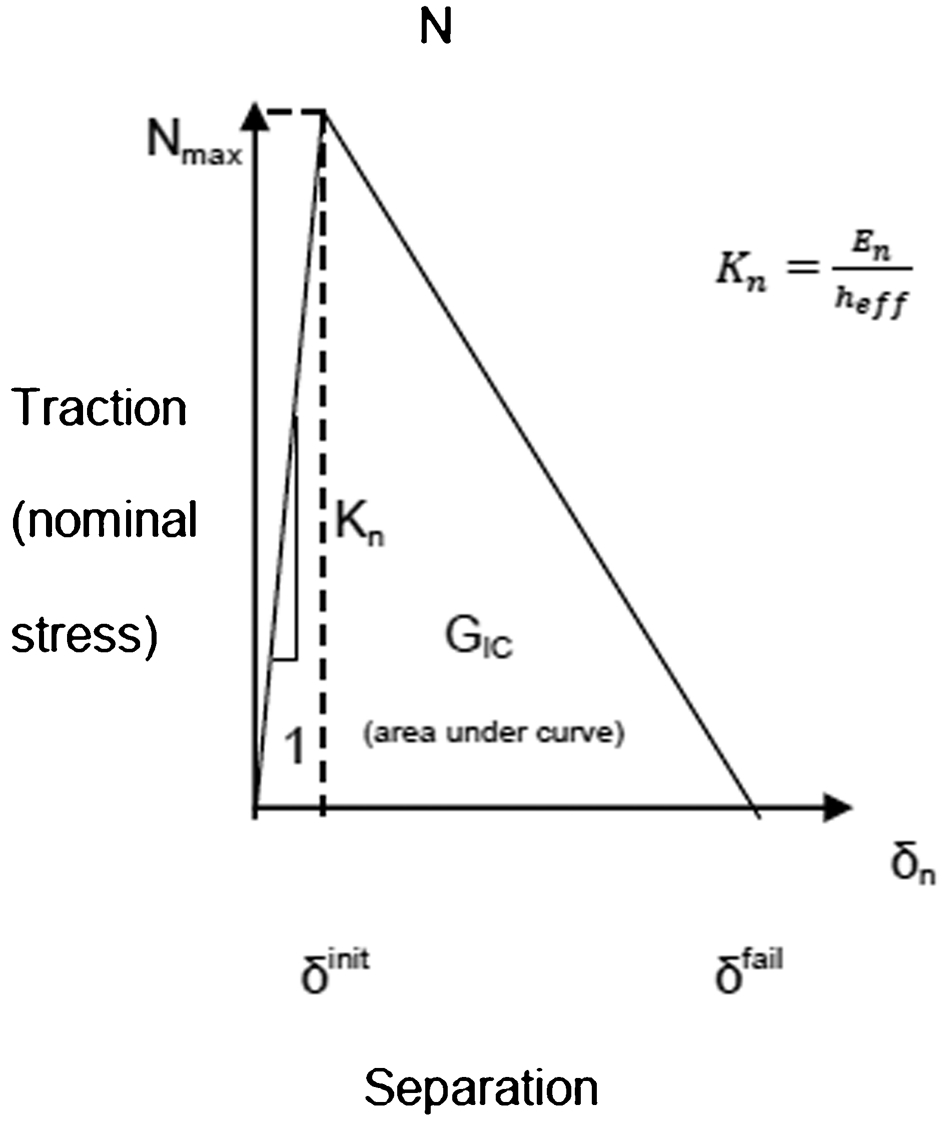
Bilinear traction–separation curve (Abaqus analysis users’ manual)
One of the options provided within ABAQUS/Standard for use with cohesive elements is based on an initial linearly elastic response followed by damage. This option was used and is described below.
Pre-damage response
Linear elasticity defines behaviour before initiation of damage. In ABAQUS, nominal stress and strain quantities are used for traction separation law. Hence if a unit thickness is specified for the element, then the nominal strain corresponds to the separation value. The elastic modulus for traction separation law is interpreted as a penalty stiffness. For example
Damage initiation
ABAQUS provides four damage initiation criteria which can be based on either traction or separation namely:
maximum nominal stress criterion
maximum nominal strain criterion
quadratic nominal stress criterion
quadratic nominal strain criterion.
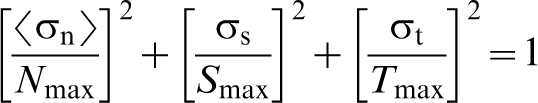
The quadratic nominal stress criterion was used and has the following formulation
Damage evolution
Post damage–initiation stress (σ) is related to stress without damage (σE) by
d = 0: material is undamaged;
d = 1: material is fully damaged.
Damage evolution can be based on either energy or displacement requiring specification of either the total fracture energy or the post damage-initiation effective displacement at failure. It may depend on mode mix which may be defined either in terms of energy or traction
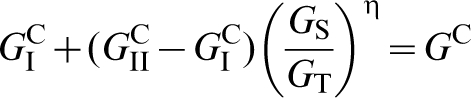
Energy based damage evolution was used whereby the fracture energy was defined as a function of mode mix using the Benzeggah–Kenane (BK) analytical form
 is the normal strain energy release rate,
 and
and
 are the shear strain energy release rates in two directions respectively and GS =
 +
+
 . The total strain energy release rate GT =
 + GS. The above BK law is suitable for the case when
 =
=
 .
.
Note: for isotropic failure the response is insensitive to the value of η.
Geometry, material properties and loading
Geometry
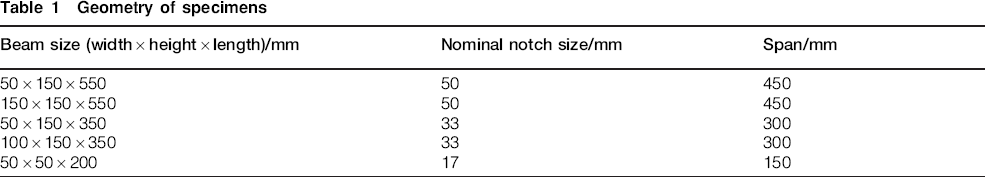
The geometry of beams to be modelled matched the specimens used in the TPB tests (Fig. 2) as shown in Table 1.
Three-point beam (TPB) test
Geometry of specimens
Smooth roller supports were used in the tests which minimised the influence of frictional resistance on the results. 13 Deformation was also controlled in the tests which ensured that stability was maintained further enhancing the reliability of load–displacements obtained. 7
Material properties
The specimens had a 2% fibre content by volume consisting of straight high tensile steel fibres 13 mm in length and 0·2 mm in diameter. Values of material properties used for modelling were adopted from literature for UHPFRC mixes similar to that used in this study (Table 2).
Modelling parameters
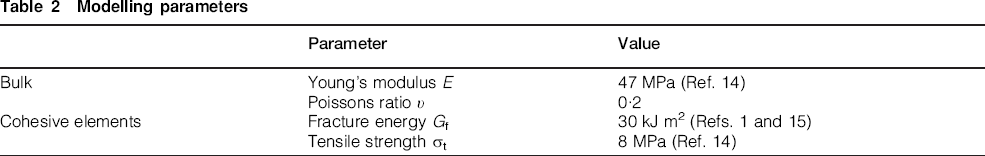
For the cohesive elements damage initiation was defined using the quadratic stress criterion using a tensile strength which is assumed to be equal for all the three modes.
Damage evolution was defined using the energy criterion. The fracture energy Gf was assumed to be equal for all the three modes
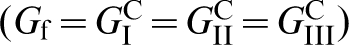 .
.
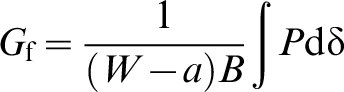
According to Abdalla and Karihaloo
8
the fracture energy Gf is calculated as the area under the load–deflection curves as follows
Linear elastic properties were defined using the Traction type where a penalty stiffness (k) of 1·98×108 was adopted. Benzeggah–Kenane (BK) analytical form was selected as the mixed mode behaviour with a power of 2·282.
Crack modelling
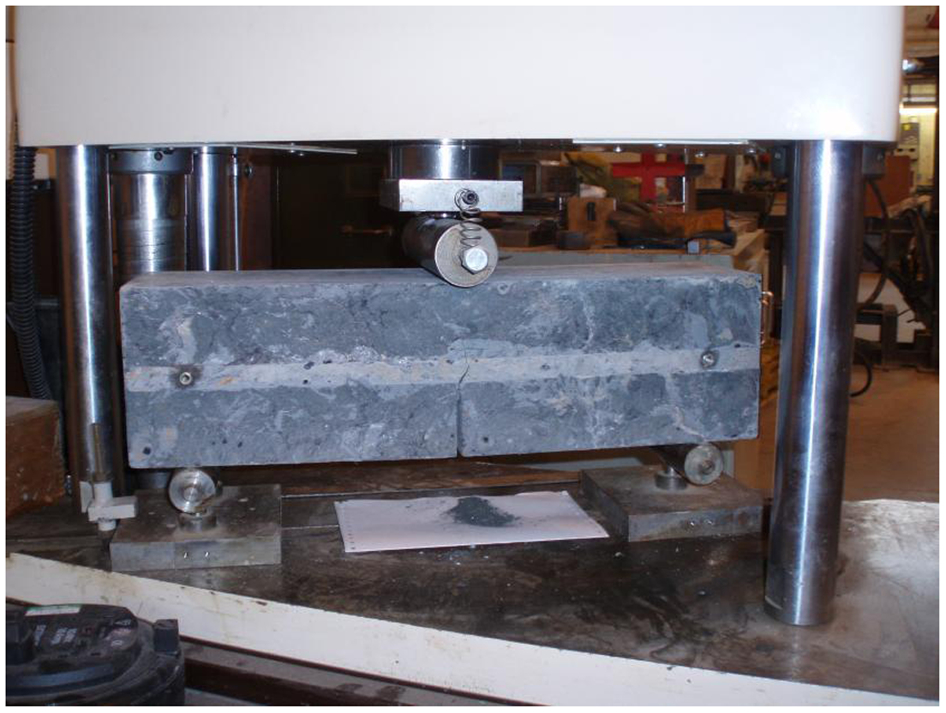
As confirmed by experimental observation (Fig. 3), the centreline of the specimen directly above the specimen was the dominant crack path into which cohesive interface elements were inserted (Fig. 4). Cohesive elements (COH2D4) were assigned to the interface using shared nodes.
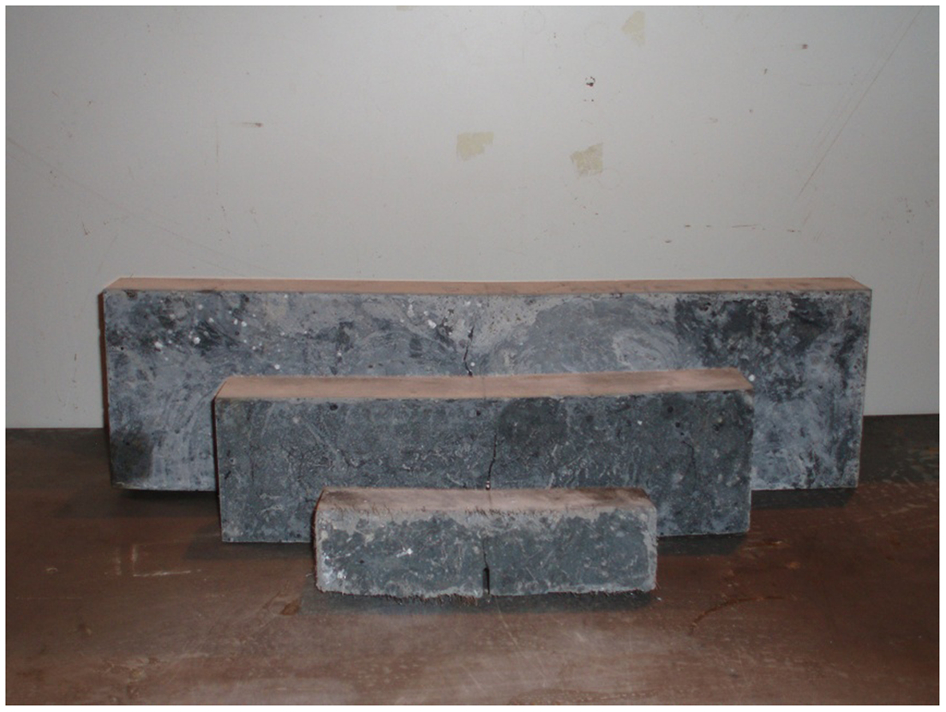
Cracked specimens from TPB test
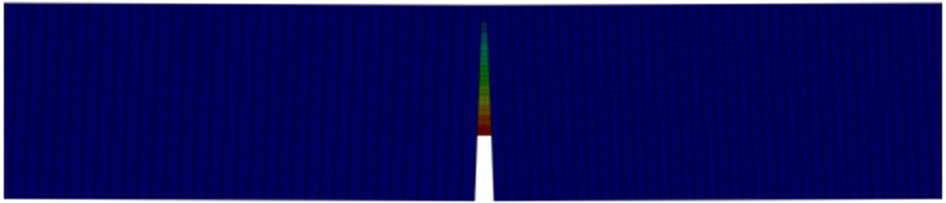
Simulation of cracked specimen
The bulk of the beam model was meshed with first order incompatible mode elements (CPE4I). These elements work well in bending and are compatible with cohesive elements when using shared nodes. 16
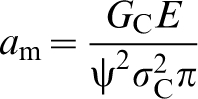
The critical crack length am is calculated as about 2·8 mm from the linear fracture mechanics based formula
Results and discussion
The CCM with a bi-linear σ–w curve has produced load–deflection curves whose shape closely matches those from test results in the elastic, hardening and softening phases (Figs. 5–9).
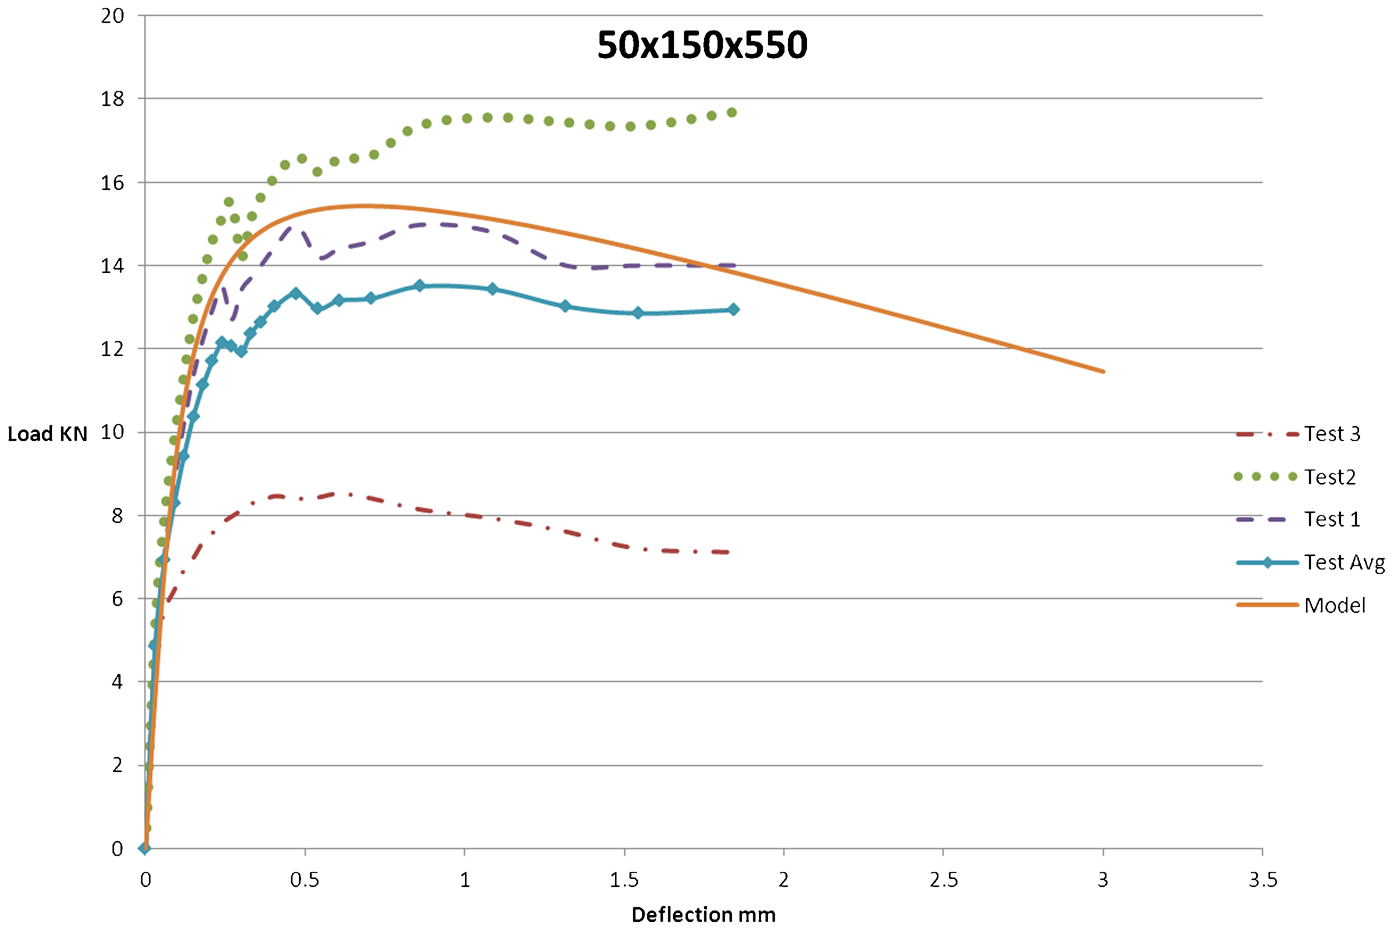
Load–deflection curve for 50×150×550 specimen
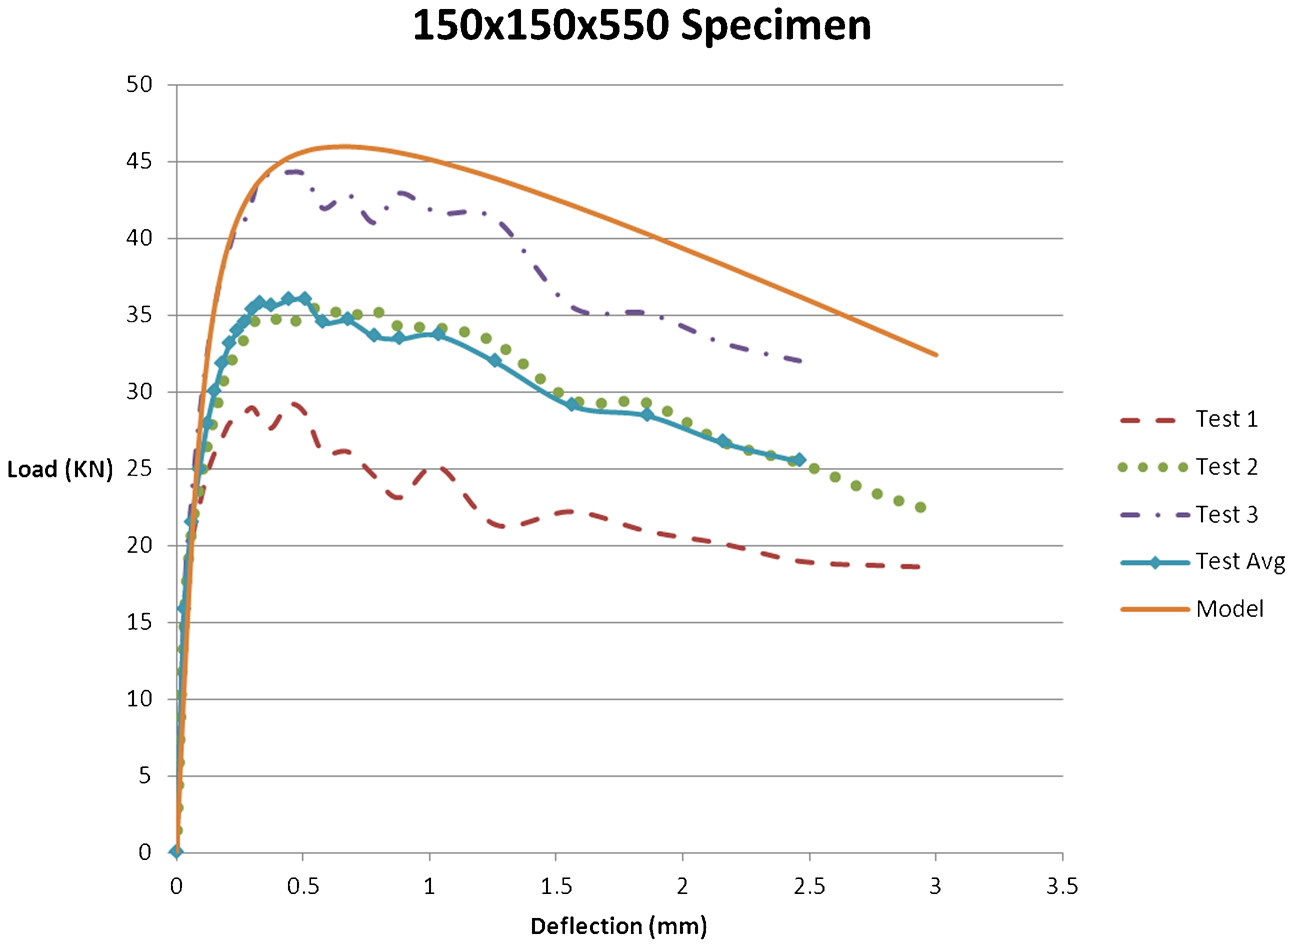
Load–deflection curve for 150×150×550 specimen
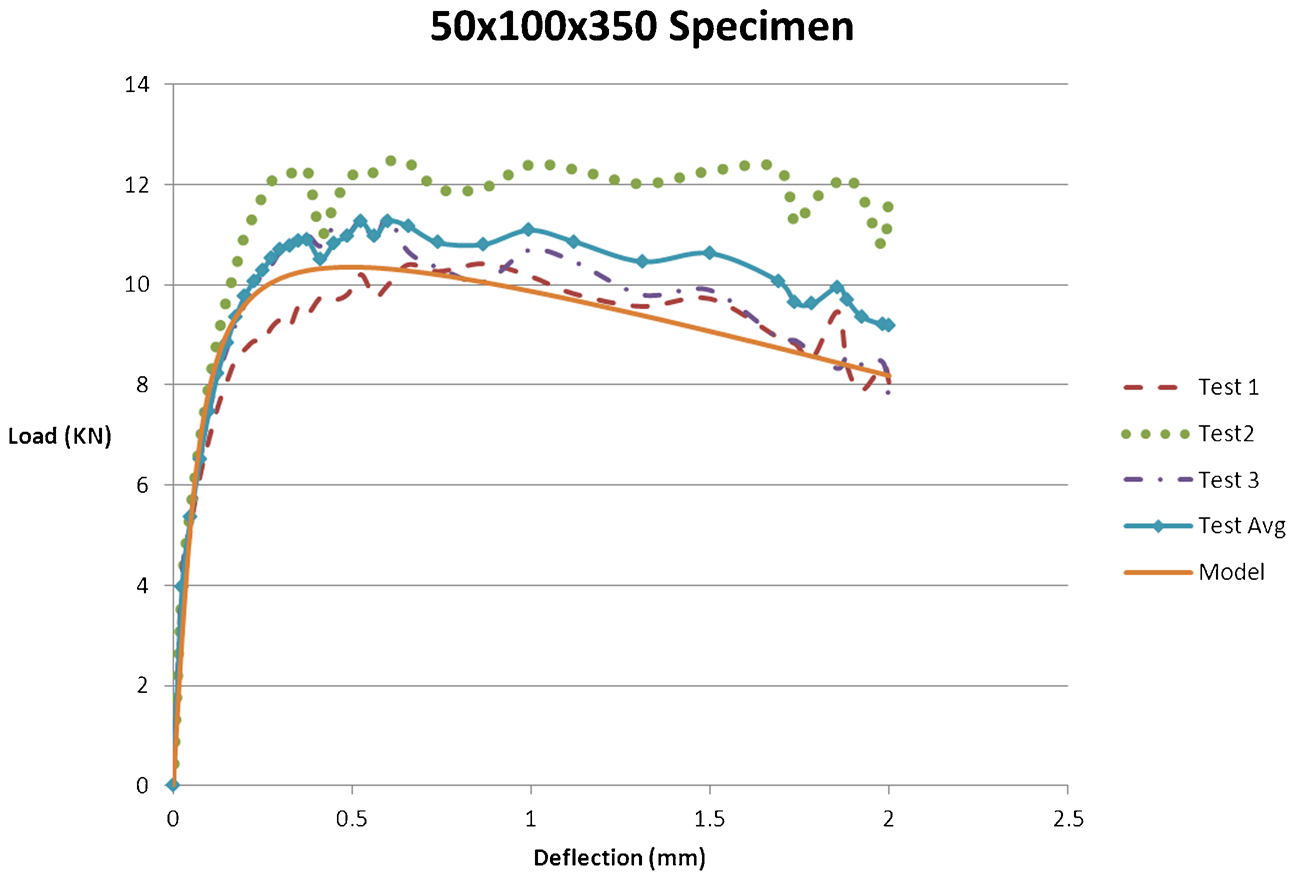
Load–deflection curve for 50×100×350 specimen
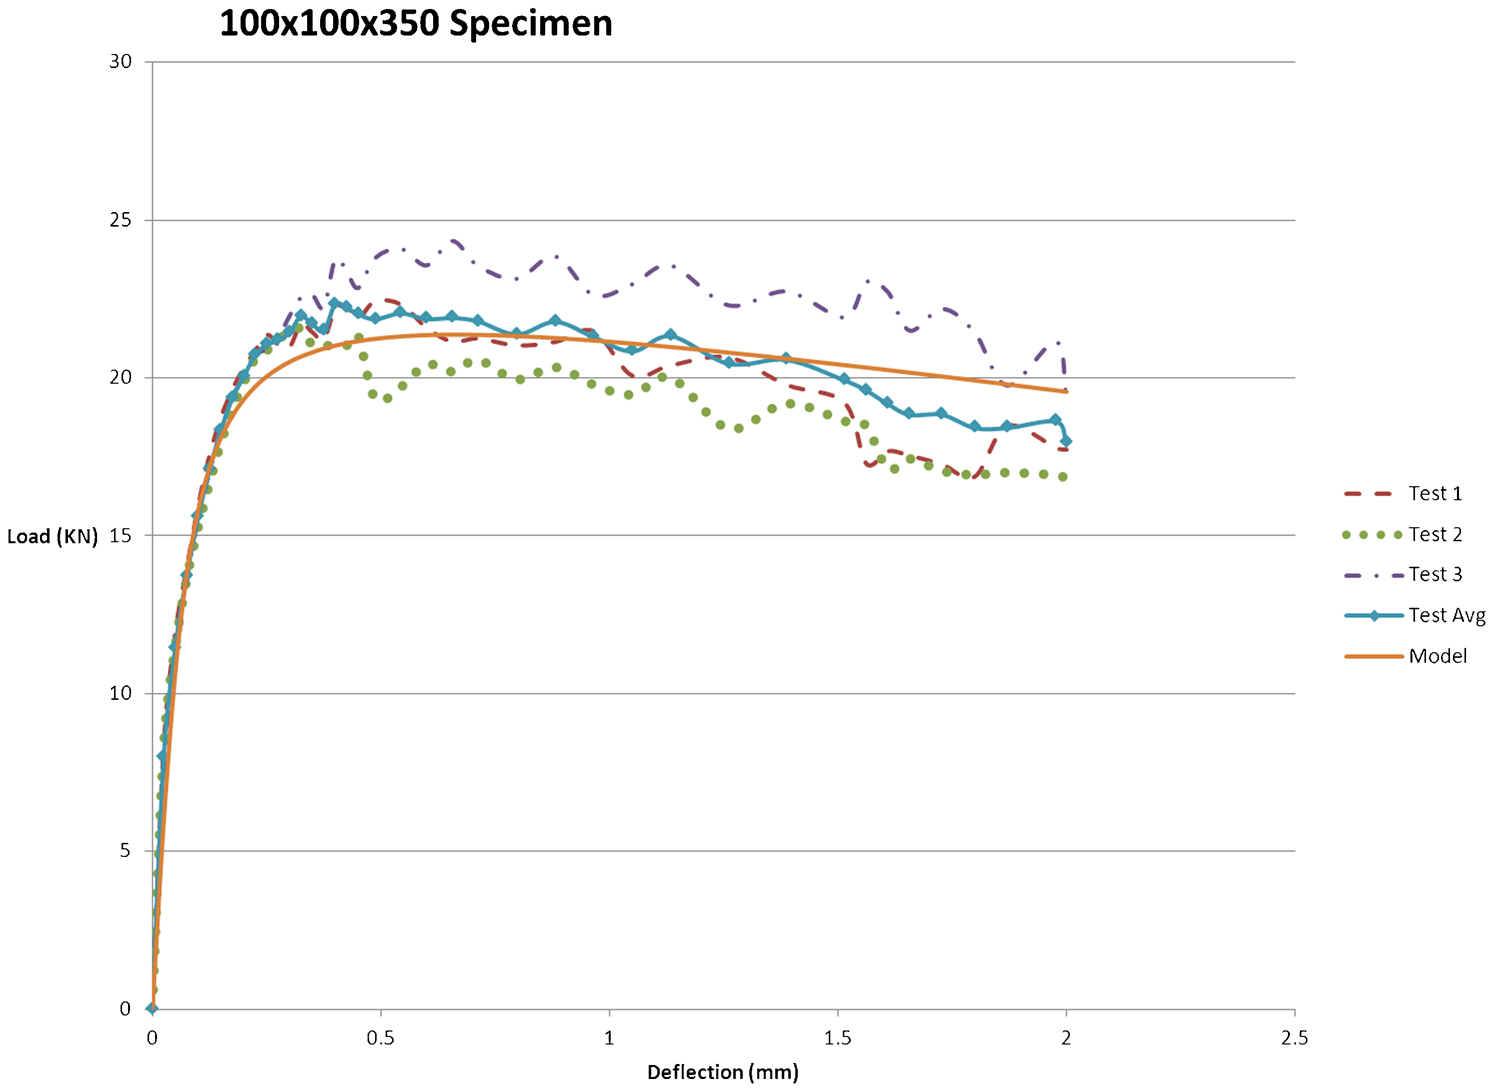
Load–deflection curve for 100×100×350 specimen
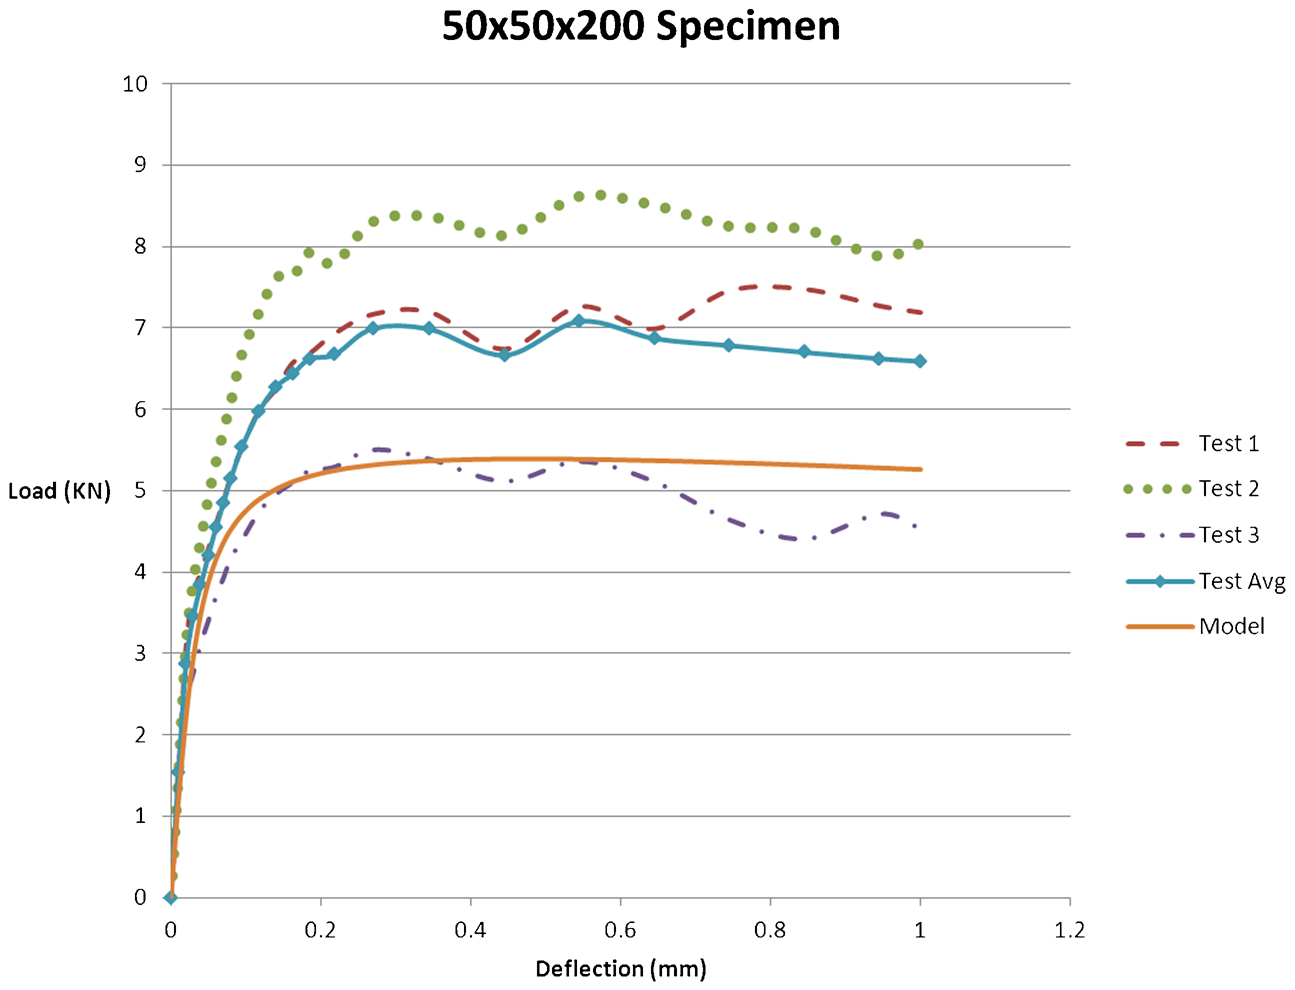
Load–deflection curve 50×50×200 specimen
Microstructural theory 8 has been used to explain each of the phases in terms of the gradual engagement of the fibres to bridge microcracks after the linear elastic stage. From this point to the peak load, the energy provided by the externally applied load is not enough to overcome the fibre bridging action resulting in the formation of more microcracks in the strain hardening phase. However, beyond peak load, the fibres de-bond from the matrix leading to the softening phase and finally to failure through complete pull-out.
While CCM assumes a homogeneous and isotropic material at the macrolevel, the scatter of the test results indicates the inherent heterogeneity of the material at the microlevel. The model also ignores the spread of cracks in the specimens and only simulates the dominant crack path. Attempts have been made by others 19 to simulate the complex crack patterns in concrete by pre-inserting cohesive elements within very fine and elaborate meshes. However, the approach adopted here is justified by the dominant crack path being known in advance and it accurately predicts the average curve with computational efficiency.
Sensitivity study (Figs. 10 and 11) shows that peak load is most influenced by tensile strength while shape of post peak curve is affected by both fracture energy and tensile strength.
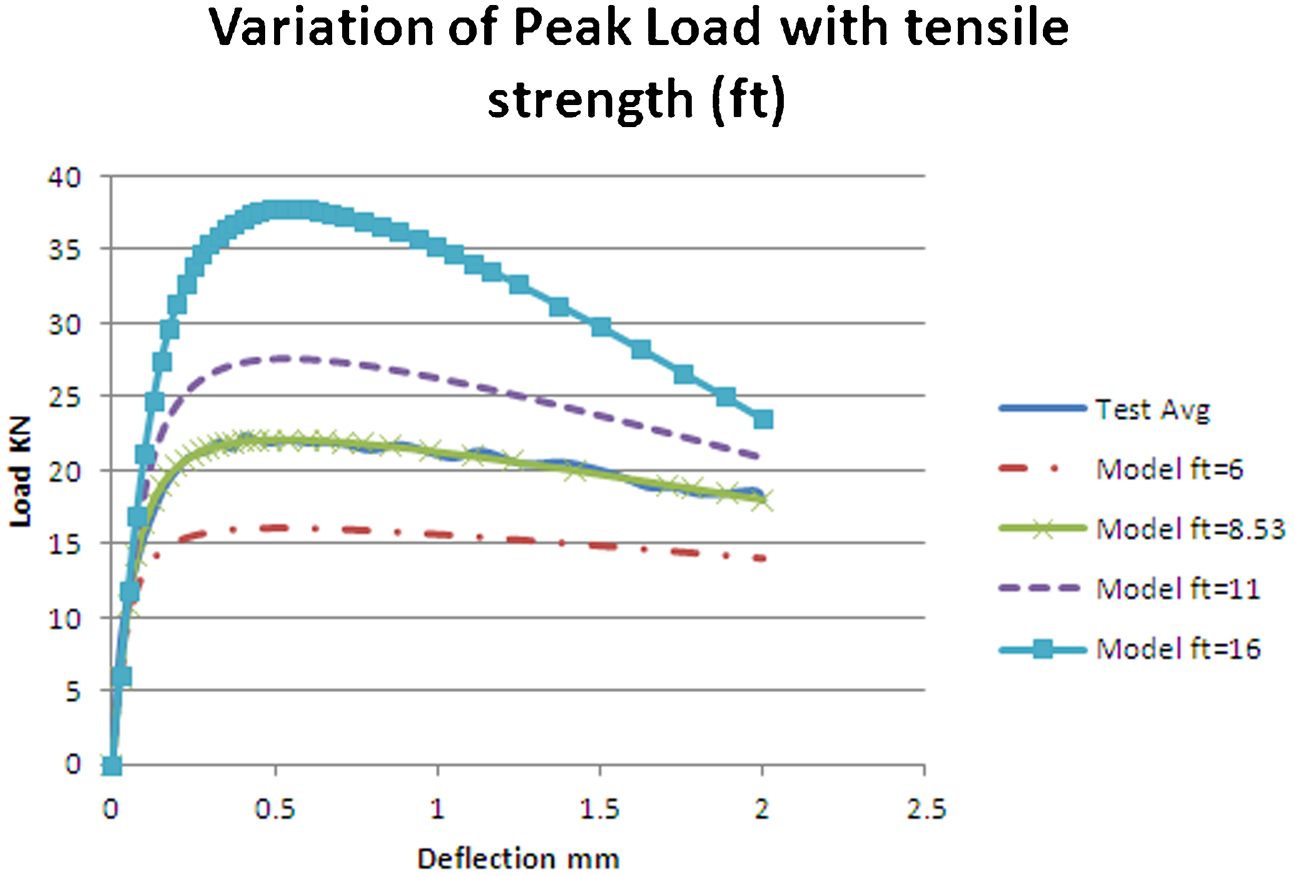
Effect of varying tensile strength
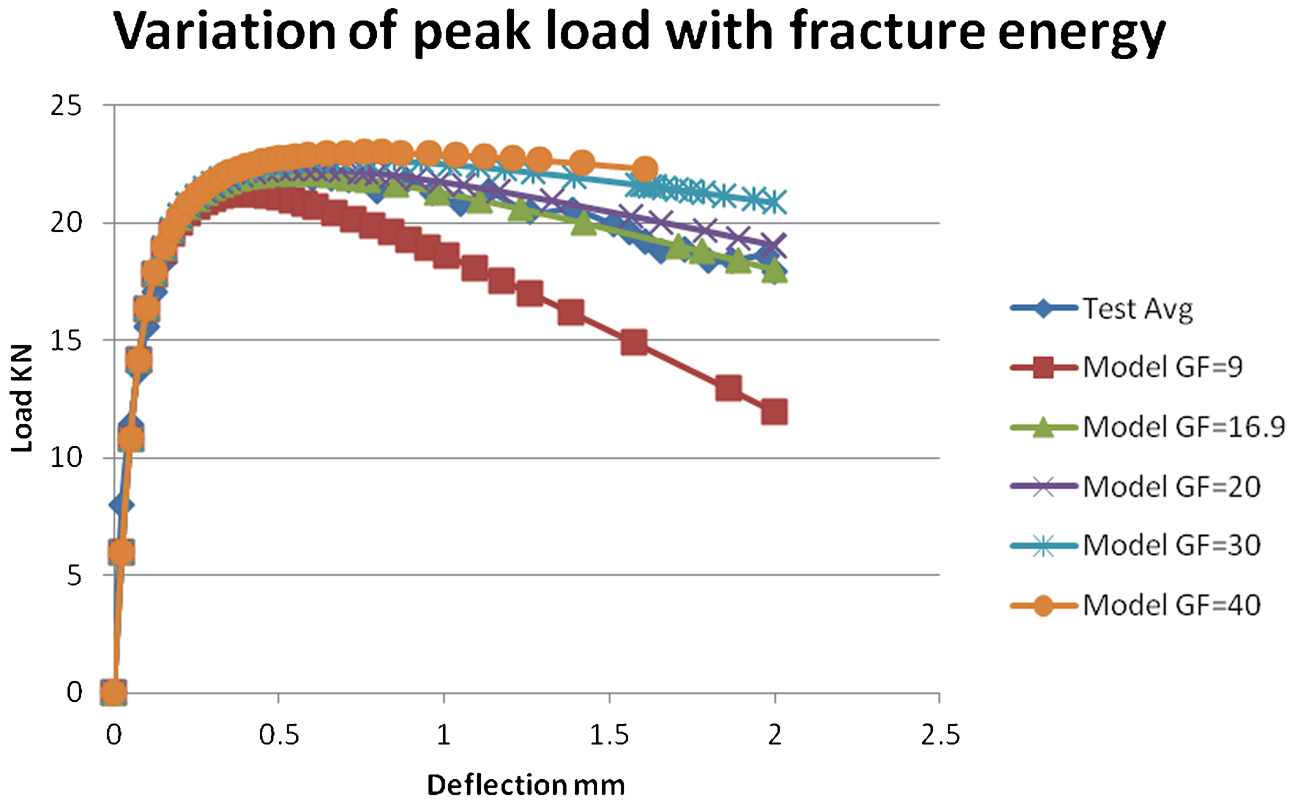
Effect of varying fracture energy
Using a tensile strength of 8 MPa adopted from literature with a bilinear traction separation curve (σ–w) curve and disregarding obvious outliers as in Fig. 5, the model has made predictions to = /−6% of the average peak load for the 50 mm wide medium (depth = 100 mm) and large (depth = 150 mm) specimens and to = /−25% for the small (depth = 50 mm) specimen (Table 3). Previous studies 20 have suggested that smaller UHPFRC specimens are subject to a size effect due to the influence of their surface layer (also called skin or wall effect). This surface layer (or skin) is stronger due to alignment of fibres parallel to it and is proportionately more influential in specimens of smaller cross-sectional area.
Peak load: test results compared to model predictions
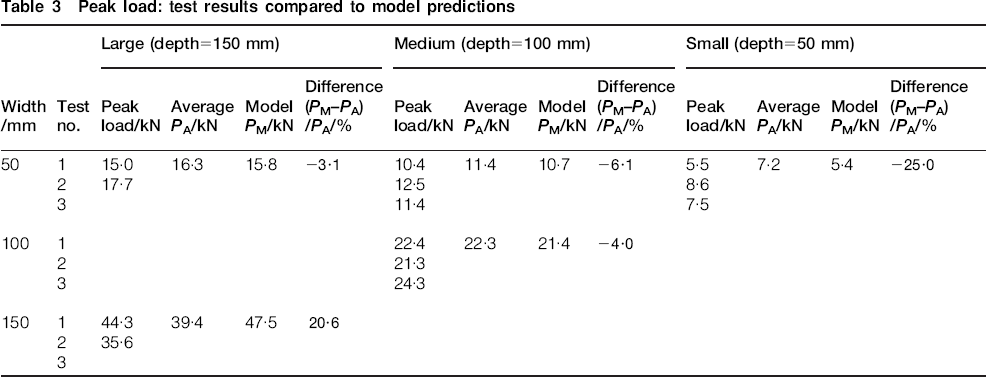
Model predictions of the 100 mm wide medium specimen are to = /−4% of the average. However, for the large 150 mm wide specimen, the model predicts the peak load to = /+ 20% of the average.
Conclusions
The CCM with a bi-linear traction separation response has predicted the peak load of 100 and 150 mm deep UHPFRC test specimens to = /−6% of the average for 50 and 100 mm wide beams and to = /+20% for 150 mm wide beams. Model predictions of the peak load for the smaller beams 50 mm wide and 50 mm deep were to = /−25% of the average. While a further study of the size effect of UHPFRC due to fracture mechanics is required, it is probable that the skin or wall effect for the smaller specimen is significant. Predictions of peak load are most sensitive to tensile strength values while the post-peak curve shape is influenced by both fracture energy and tensile strength values.