
Abstract
High aspect ratio 2M-wollastonite particles were prepared using a flux growth process, in which a unidirectional temperature gradient was established in the melt. The one-dimensional heat transfer caused the crystals to display clear cellular structure. The measured cellular growth rate decreased from ∼12 to 8 μm s− 1 within 20 min of crystallisation time. However, the primary arm spacing remained nearly constant at ∼7.5 μm. B2O3 can significantly lower the melting point of the mixture, which made the handling of the molten silicate mixtures easier. The cellular/dendritic structures were maintained up to a maximum B2O3 content of 20 wt-%. The primary arm spacing increased from ∼8 μm at 8 wt-% B2O3 to ∼40 μm at 20 wt-% B2O3. The corresponding mean aspect ratio of 2M-wollastonite particles decreased from ∼12:1 (a high aspect ratio grade) at 8 wt-% B2O3 to ∼4:1 (a low aspect ratio grade) at 20 wt-% B2O3.
Introduction
Wollastonite (CaSiO3) is a mineral having two polymorphs: α-wollastonite also called pseudo-wollastonite or cyclo-wollastonite that is stable at high temperatures, and β-wollastonite that is stable at low temperatures.1,2 Each polymorph is further divided into different polytypes.3,4 2M-wollastonite, also named para-wollastonite, belongs to one of the six polytypes of β-wollastonite.1–5 It has a unique structure because it has long chains of silicon tetrahedra [SiO4]4 − parallel to its b axis (monoclinic structure), which results in its fibrous nature. When crushed into powder, such fibrous nature leads the formation of acicular or high aspect ratio particles, which has many useful properties, for example, low thermal expansion, low water and oil adsorption, and chemical inertness. 8 These properties make it valuable in many industrial applications such as plastics, paints, coatings, rubbers, ceramics, refractories and adhesives. 6 However, natural wollastonite usually occurs only in small amounts and is often contaminated by other minerals such as diopside, calcite and garnet. 1 This explains why the synthesis of wollastonite or wollastonite containing glass ceramic materials has attracted research interests over the years.1,2,7–13
Previously, we have reported two different processes for the preparation of high aspect ratio wollastonite particles by the partial melting and recrystallisation process and the flux growth process.8,9 Both processes succeeded in achieving fine particles with mean aspect ratios of >8:1, including particles with aspect ratios of >15:1. The partial melting process grows larger crystals ( < 4 × 1 mm) with less preferred growth orientation, and it requires two-stage sintering process. The flux growth process grows needle shaped crystals of ∼10 μm diameter. Owing to the cellular growth pattern, this process directly forms 2M-wollastonite of long aspect ratios, including crystals having aspect ratio of 150:1 to 300:1 with a width of ∼10 μm and a length ranging from 1500 to 3000 μm. 9 Even though these extremely high aspect ratio crystals were destroyed during the subsequent crushing process, the final product still maintained relatively high aspect ratios. The flux growth process requires temperatures of ∼200°C higher than the partial melting process but takes place in a much shorter period. In this study, the focus was to quantitatively study the cellular and dendritic growth of 2M-wollastonite using the flux growth process under varying conditions, and how such growth behaviour affects the aspect ratios of 2M-wollastonite particles.
The mechanisms of cellular and dendritic growths in organic compounds and metal alloys have been extensively studied in the past by many researchers.14–19 Such growths exist commonly during casting and welding of metals and can significantly affect their mechanical properties. Their characteristic patterns include the primary, secondary and tertiary arms under certain conditions. 20 When only primary arms are well developed, the corresponding crystals have a cellular structure. When both primary and secondary arms are developed simultaneously, they form a dendritic structure. Tertiary arms either exist in small volume fraction or grow into primary arms.20,21 Two important parameters corresponding to the primary arms and secondary arms are the primary arm spacing and secondary arm spacing. Other parameters include dendrite tip radius and mush zone depth. These parameters are directly related to growth parameters: the temperature gradient ahead of the growth front and growth rate.17,22
Experiments on cellular and dendritic growths have been carried out in various systems. They can be classified into two general systems: The first system contains metal alloys, the examples of which are Pb–Sn, 23 Sn–Zn 24 and Al–Cu 25 binary alloys. The second system includes organic alloys such as succinonitrile–acetone, 15 succinonitrile–salol 26 and pivalic acid–ethanol. 27 A more detailed list of such organic compounds or their combinations is available in the literature. 14 Compared with metal alloys, those organic alloys have low melting points, making it easier to handle. Thus, such organic alloys were frequently used for modelling cellular and dendritic growths.14,15,17 Cellular and dendritic growths have also been observed in ceramic alloys.27–29 However, in most of those studies, a high aspect ratio was not of the main interest, the cellular and dendritic patterns did not show strong orientation dependence, they often formed locally, or the same phase is not continuous in extended scale, which is critical in 2M-wollastonite preparation. One of the main reasons causing the structural difference is the heat transfer mechanism. In those studies, the temperature was generally kept uniform within the sample; a temperature gradient along a specific direction was not maintained. However, in the flux growth, the temperature gradient is purposely maintained along a certain direction so that an oriented cellular growth was observed, leading to the formation of a long continuous 2M-wollastonite phase.
When we grew 2M-wollastonite crystals using the flux growth process, the solidification process clearly demonstrated cellular and dendritic growths. We observed the formation and growth of those dendrites at the initial period and how they transformed to a largely cellular structure under certain conditions. Samples of different cellular interspacing showed different mean aspect ratios. We thus designed experiments to systematically study the cellular and dendritic structures from this molten ceramic alloy. In this study, we quantitatively measured the growth rate and primary arm spacing, and how the two parameters varied with cooling–furnace temperature, cooling rate and content of B2O3. Lastly, we determined how the mean aspect ratios were affected by these parameters, which is essential in achieving high aspect ratio wollastonite particles.
Experimental
Mixtures of 1:1 molar ratio of SiO2 to CaO as the major components with the addition of small amounts of B2O3 (8 wt-% except when the effect of its content was tested) as the melting point depressing agent and Li2O as a catalyst 8 were prepared first. Detailed composition of each sample is provided in Table 1. About 20 g of a mixture was filled into a high alumina crucible of high purity (99.6%, AdValue Technology, Arizona, USA). The crucible had the dimensions of 4.2 cm depth and 2.9 cm inner diameter at the half depth (3.5 cm at the top and 2.4 cm at the bottom). The mixture along with the crucible was first preheated in a low temperature muffle furnace at a preheating temperature of TP for a preheating time of tP. Then, it was transferred to a high temperature melting furnace, which had been heated to a melting temperature, at which the mixture was completely melted. The crucible with the melt was transferred back to the lower temperature muffle furnace (cooling furnace) to solidify the melt. The complete experimental conditions for the samples used in this study are summarised in Table 1. The experimental set-up and an illustration of the operating procedure are shown in Fig. 1a and 1b respectively.
Raw material composition and heat treatments conditions
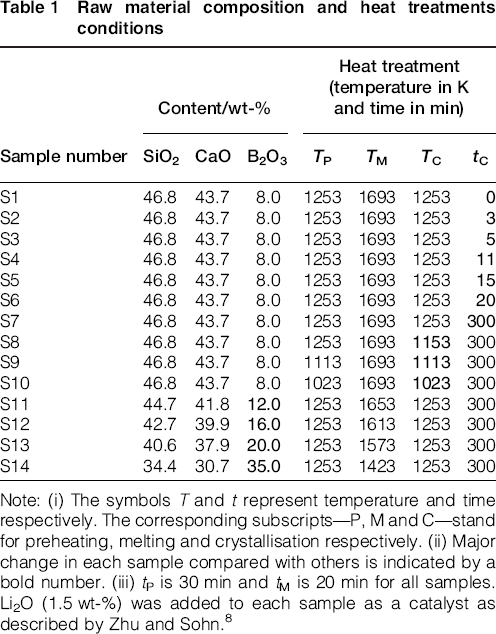
Note: (i) The symbols T and t represent temperature and time respectively. The corresponding subscripts—P, M and C—stand for preheating, melting and crystallisation respectively. (ii) Major change in each sample compared with others is indicated by a bold number. (iii) tP is 30 min and tM is 20 min for all samples. Li2O (1.5 wt-%) was added to each sample as a catalyst as described by Zhu and Sohn. 8
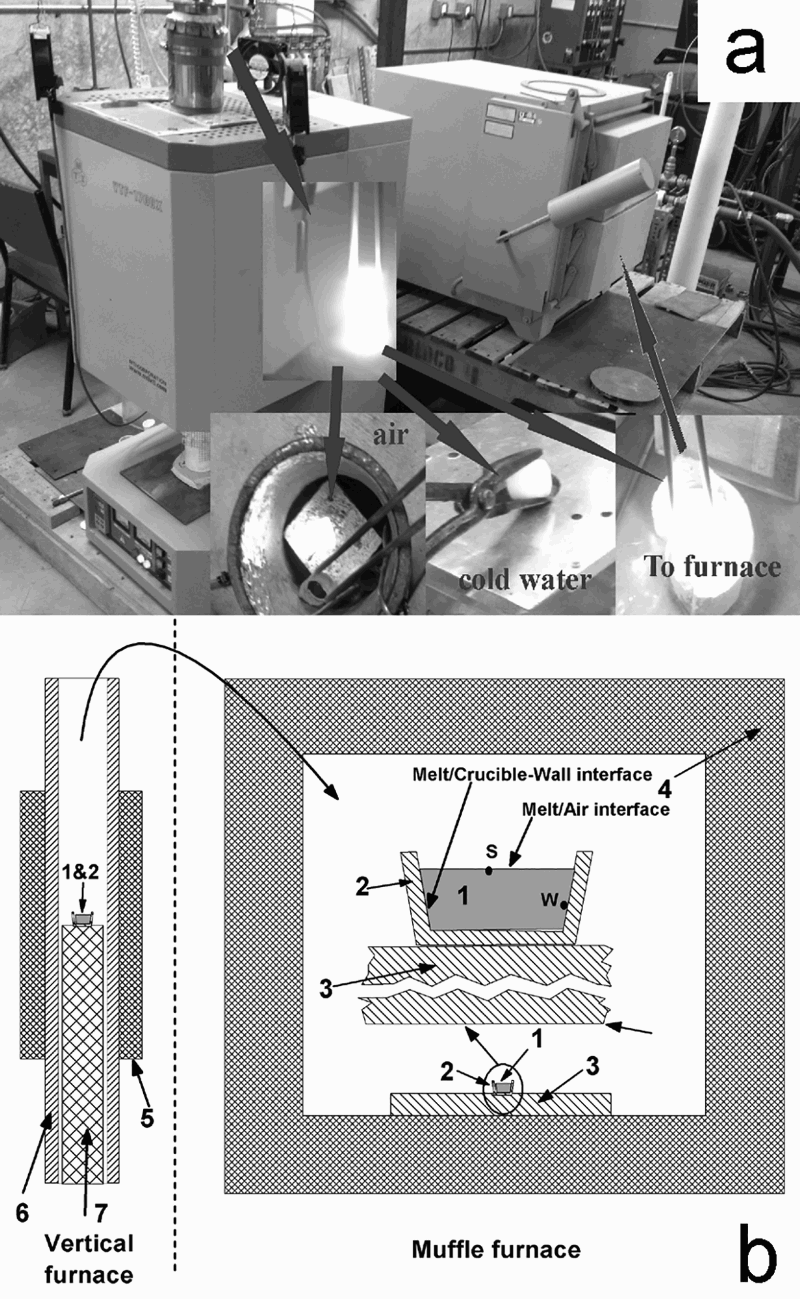
Experimental set-up: a for directional solidification, melting furnace (left) and muffle furnace (right); three types of cooling methods were used: water quenching, air quenching and furnace cooling; b schematic of operating process: (1) melt, (2) alumina crucible wall, (3) insulating brick, (4) furnace wall, (5) melting furnace, (6) alumina tube, (7) ceramic support; adapted from Zhu et al. 9
Once the crucible was transferred from the melting furnace to the cooling furnace, heat losses from the side (alumina wall) and bottom (alumina wall+porous ceramic brick) were much slower compared with that from the top of the melt. This provided a temperature gradient in the direction perpendicular to the melt/air interface with top melt being the coolest layer.
To measure the growth rate, samples S1–S6 were prepared and allowed to crystallise for a time, as indicated in Table 1. After a predetermined time, each sample was taken out of the cooling furnace and quenched in air, the cooling rate of which was enough to prevent further crystallisation. After being cooled to room temperature, each sample was broken into two parts. One part was mounted and polished to study the structures of the as solidified melts, and the other part was further crushed into powder for other analyses. Since the crystallised melt was opaque while the uncrystallised melt remained a transparent glass, the thickness of the crystallised layer could be measured directly. The ratio of the increased thickness of crystallised layer to the time interval gives the growth rate.
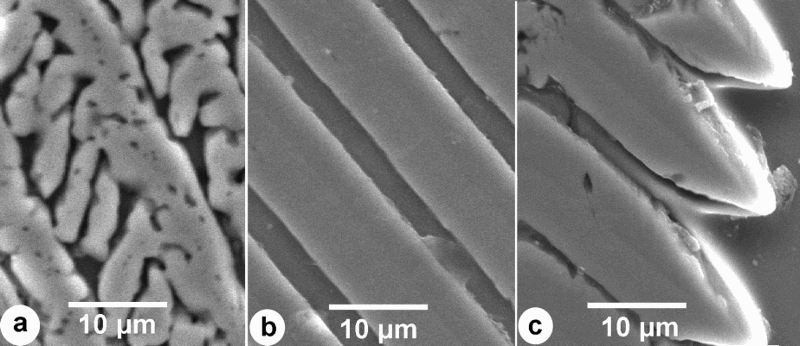
Even though dendrites can have primary arms and secondary arms, only the primary arm spacing (hereafter referred to as the primary spacing) was our major interest because it does not change with time while the secondary arm spacing may vary during the quenching of alloy. 17 Therefore, we shall use the primary spacing to compare the growth behaviours of the samples, which was measured typically from ∼100 columns. Figure 2a illustrates how the primary spacing was measured.
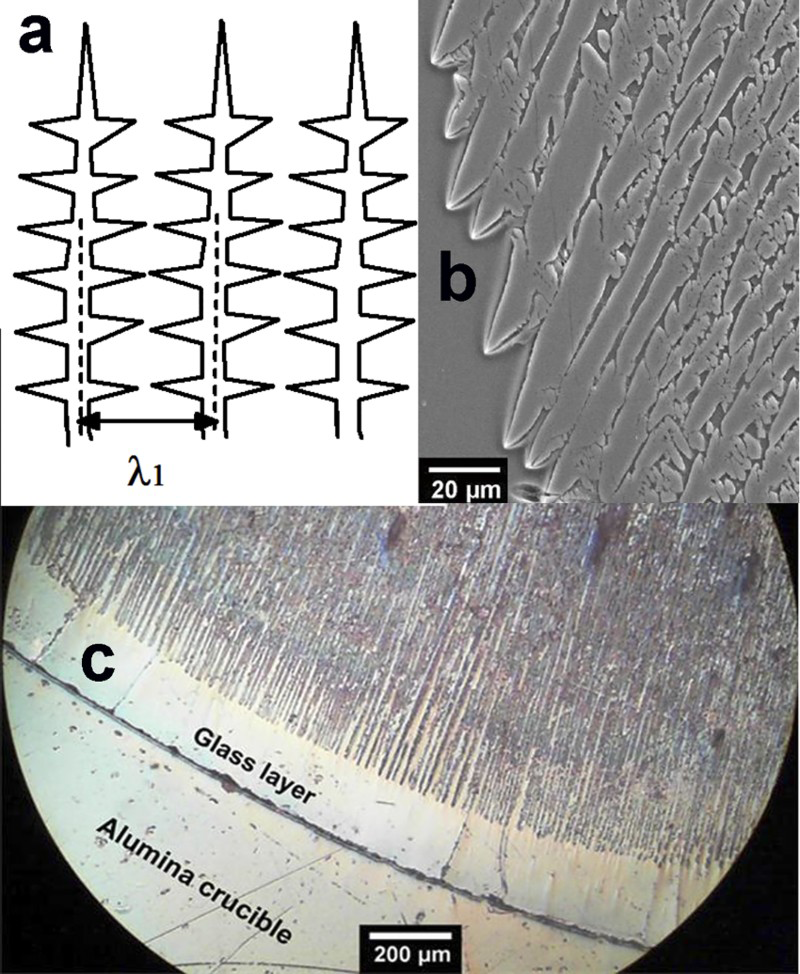
Illustration of measuring primary arm spacing a in cellular/dendritic structure, with experimental observations of b typical dendritic and c typical cellular structure from samples solidified under unidirectional heat transfer
Results and discussion
Depending on the temperature gradient, the cellular and dendritic structures can grow into columns in which only the primary arms are well developed or into dendrites when both the primary and secondary arms are well developed. In our case, both cellular structure and dendrites with the primary and secondary arms were observed, as seen in Fig. 2b and c respectively.
Growth rate
Figure 3 shows the appearance of samples that had the same composition but were quenched after different solidification times. The sample in Fig. 3a was quenched in air immediately after being completely melted, when it turned essentially to transparent glass. With a finite cooling rate in the cooling furnace, the cooled samples began to grow an opaque layer, as shown in Fig. 3b–d, and the thickness of this layer increased with increasing crystallisation time. As seen in Fig. 3d, the melt solidified completely after 20 min. X-ray diffraction (XRD) analysis confirmed that the opaque layer was 2M-wollastonite crystals, as seen in Fig. 4a.
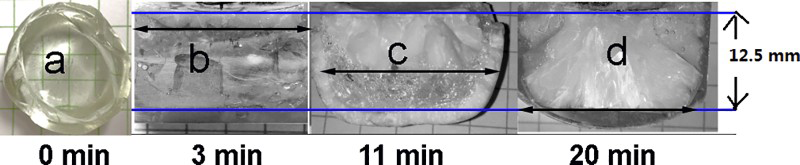
Photographs showing that a when quenched by air, melt from sample S1 remained as transparent glass after being cooled to room temperature; b–d photographs showing thicknesses of solidified layer of samples under various crystallisation times; double arrowed lines indicate growth front of each sample; it separates solidified layer (top layer) and remaining glass layer (bottom layer)
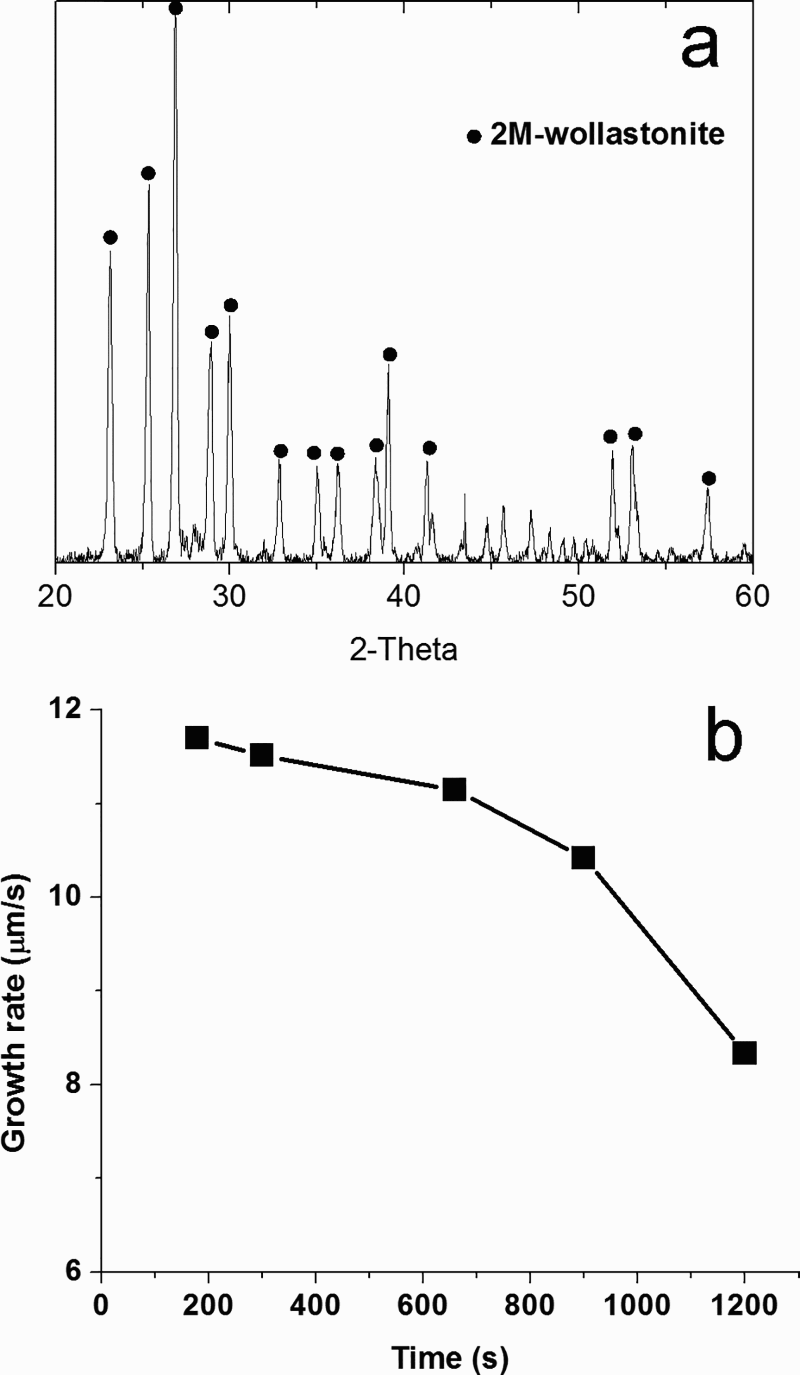
a XRD analysis confirming that opaque layer from Fig. 3 is 2M-wollastonite; b relationship between growth rate and crystallisation time
The growth rate during each time interval was then measured based on the thicknesses of solidified layers shown in Fig. 3, and the result is plotted in Fig. 4b. It is indicated that the growth rate slowly decreased with increasing crystallisation time possibly due to the decreasing temperature and increasing accumulation of B2O3 in the remaining melt. The low growth rate near the end of the crystallisation period may have been caused by two reasons: First, the temperature was the lowest, and second, the remaining unsolidified phase near the end of crystallisation period may have included a much higher B2O3 content than earlier, slowing down the growth rate.
Primary spacing
Even though the definition of the primary spacing is straightforward as indicated in Fig. 2a, the actual measurement was complicated due to the structural differences corresponding to different crystallisation periods. Figure 5 shows the representative regions of the crystal grown in the muffle furnace at 980°C. The first region is the top part, where the nucleation and growth start. In the actual experiments, the melt was just transferred from the melting furnace at a higher temperature to the cooling furnace at a lower temperature, so both radiation and convection heat transfer were most rapid; thus, the top of the melt began to cool very fast, and heat flow within this layer is also more complicated than further down. As a consequence, the structure of this region is much less ordered than those of the other two regions. After a while, the top melt solidified into crystals and formed a nearly opaque and more uniform main layer. The third layer is the tip part where new dendrite tips were developing, and the heat flow was more complicated again because of the existence of the liquid/solid interface.
SEM images showing representative structures from a top part (near top melt, 10 μm to several hundred micrometers thick), b main part (close to centre of solidified sample, up to 12.5 mm), and c tip part (interface between growing cellular tips and uncrystallised melt, 10 μm to several dozen micrometers thick) of samples having same initial raw material composition but were allowed to crystallised in muffle furnace at 980°C for 3–20 min
For a crystallisation time of 3 min, the main part had a volume fraction of ∼60%, this percentage increased rapidly with increasing time, and it reached >95% in sample S6, which was completely solidified. Meanwhile, due to the commonly existing defects at the growing tips, such as elimination, tip splitting and growth of tertiary arms, 14 as illustrated in Fig. 6, the primary spacing measured at the tips does not represent the main structure of a solidified sample. Thus, the primary arm spacing discussed below refers to the main part of each sample, as indicated in Fig. 2a.
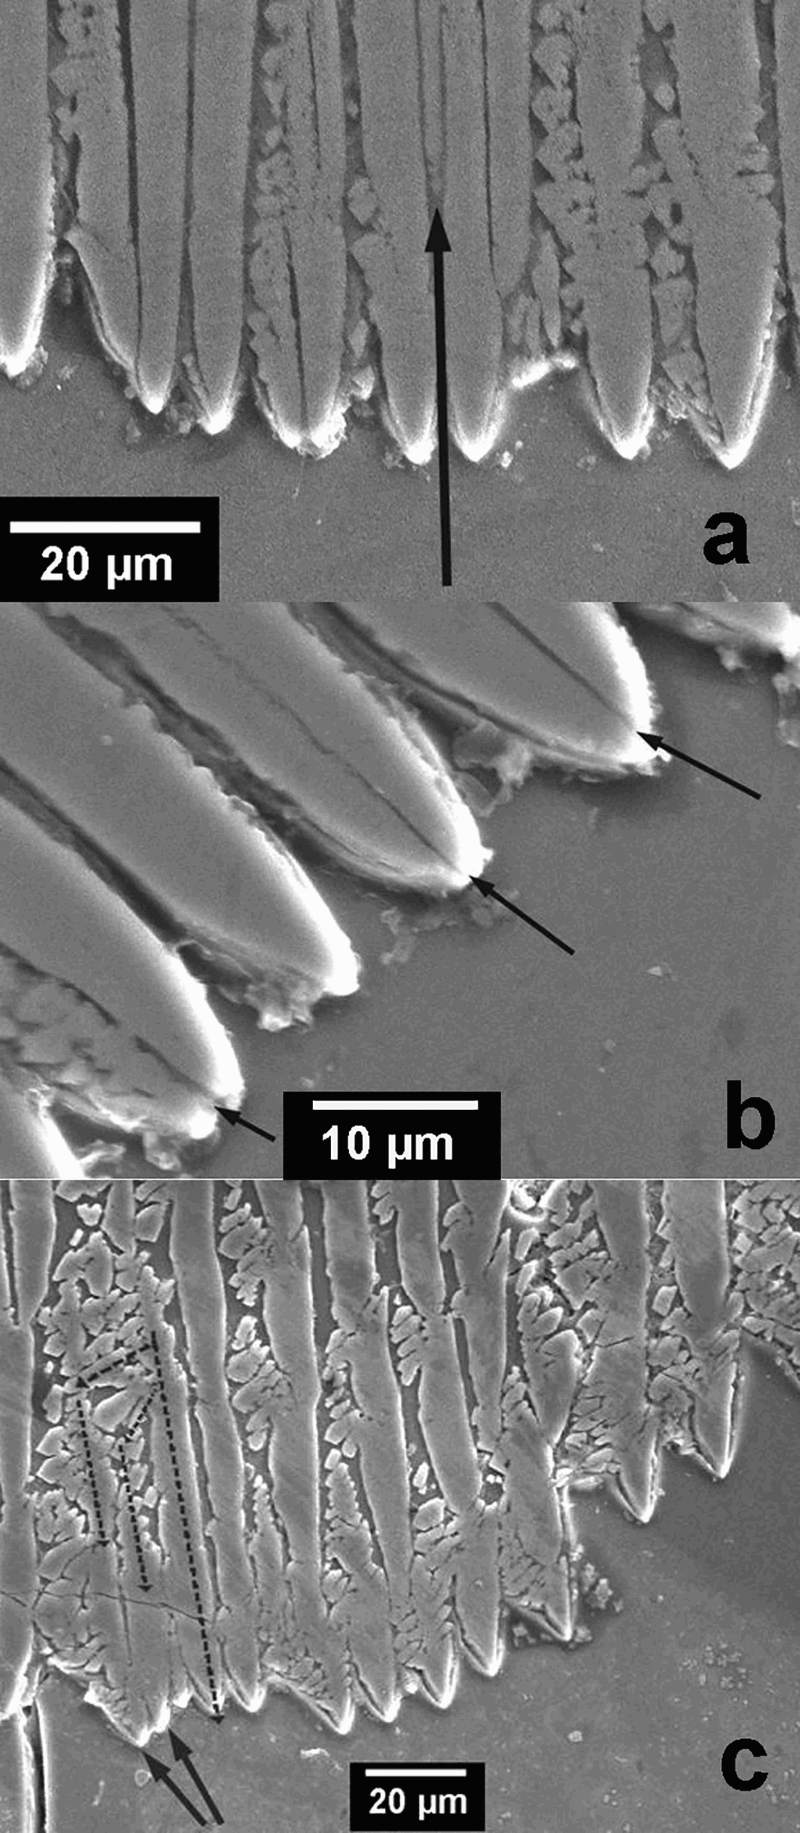
Illustration of cellular/dendritic structure defects: a elimination, b tip splitting, and c growth of tertiary arms
Figure 7 shows the structures from the main part of two samples that were quenched in air after being transferred from the melting furnace (1420°C) and allowed to crystallise for 3 and 11 min at 980°C. Even though the sample with shorter crystallisation time showed mainly dendritic structure, while the one with longer crystallisation time showed mainly cellular structure, the measured primary spacings of the two samples were very close to each other, and they are 8.1 and 7.3 μm for 3 and 11 min of crystallisation time respectively. Primary spacing at other selected crystallisation time is plotted in Fig. 8a. It is seen that within the whole crystallisation period, the primary spacing remained nearly a constant value ∼7.5 μm, excluding the values before ∼5 min, which represents the beginning top part in Fig. 5 where the growth is irregular compared with the growth in the main part.
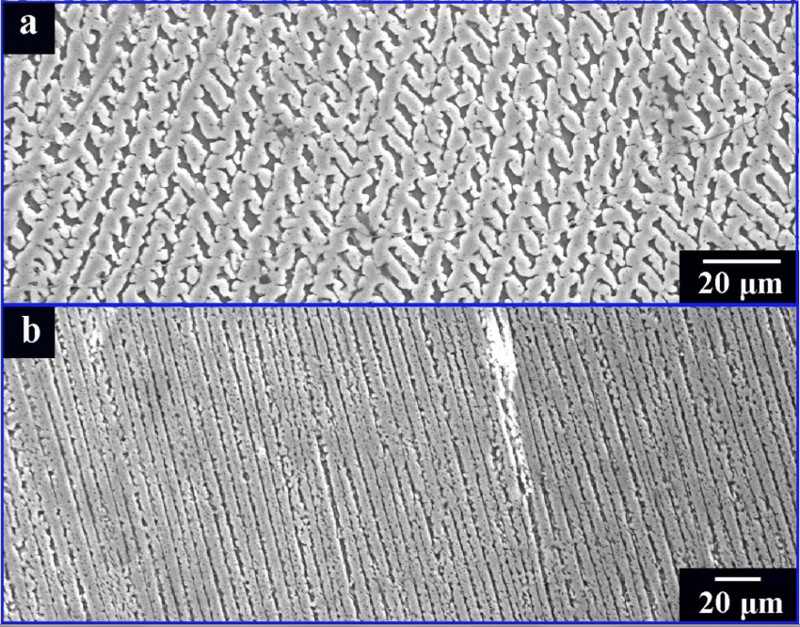
Representative microstructures of samples with crystallisation time of a 3 min (sample S2) and b 11 min (sample S4); see Table 1 for detailed experimental conditions
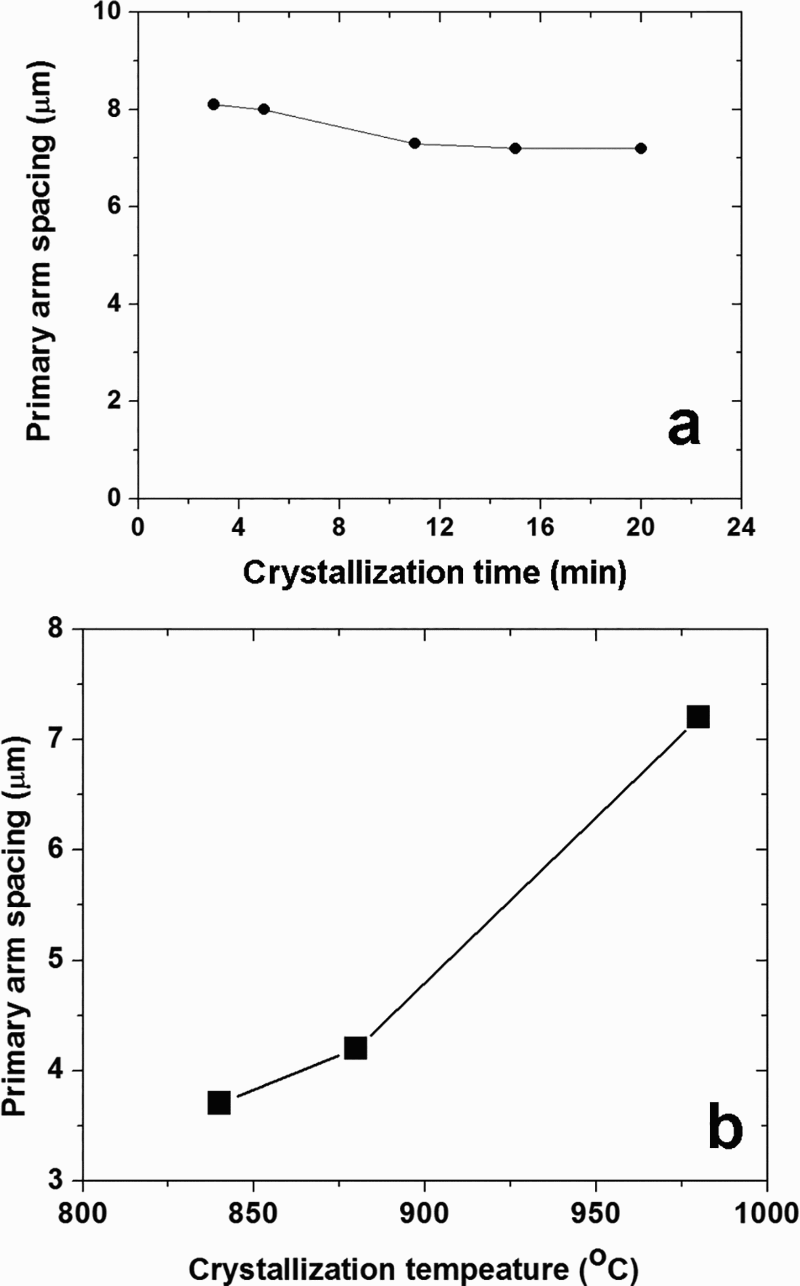
Plots of average primary spacing measured from main part of samples S2–S6 as function of a crystallisation time and b crystallisation temperature
In order to study the effects of cooling–furnace temperature on primary spacing, samples S8–S10 were prepared. The experiments showed the entire melt froze as glass when the cooling–furnace temperature was 750°C. When the cooling–furnace temperature was 840°C, the sample contained a layer of glass at the bottom that was about one eighth of the total sample volume. When cooling–furnace temperature was at 880°C, all melt crystallised. From the previous measurement on growth rate at 980°C, the required time for complete crystallisation should be < 20 min at 840°C because of a larger temperature difference between the surrounding and the initial melt, which means a faster heat loss. This means the crystallisation process became very sluggish or even stopped at 840°C. By taking the average of 880 and 840°C, the minimum holding temperature for the crystallisation process is estimated to be ∼860°C.
The primary spacings of cellular/dendritic structures formed at different cooling–furnace temperatures (samples S8 and S9) are plotted in Fig. 8b. As shown in Fig. 8b, the primary spacing increases with increasing cooling–furnace temperature, which means a decreasing cooling rate. This observation agrees with the conclusion reported by Fredriksson and Akerlind, 21 where they suggest that a higher cooling rate leads to a smaller dendrite spacing.
Effects of B2O3 contents on primary spacing
Previously, we have seen primary spacings for samples containing 8 wt-% B2O3. This B2O3 content was determined to be optimum from the viewpoint of melting temperature and the mean aspect ratio of the final product. To study the effect of B2O3 content on the primary spacings, samples S11–S14 were tested.
As seen in Fig. 9a and b, dendrites are absent from the two samples of B2O3 content up to 20 wt-%, leaving pure cellular structure. From 8 to 20 wt-% B2O3, the primary spacing increased with the increasing B2O3 content, as shown in Fig. 9c. However, at 35 wt-% of B2O3, all cellular structures disappeared and the solidified sample consisted of a semitransparent white layer on top and a transparent glass layer at the bottom, as seen in Fig. 10a, which indicates a significant phase separation at this B2O3 content. Under SEM and optical microscope, it was found that the white layer consisted of a major phase that had no distinguishable pattern with a high density of bubbles with an average diameter of ∼14 μm, as shown in Fig. 10b and c. The origin of these bubbles has not been determined. When such a layer was cooled to room temperature, it showed amorphous phase, as indicated by XRD (not shown).
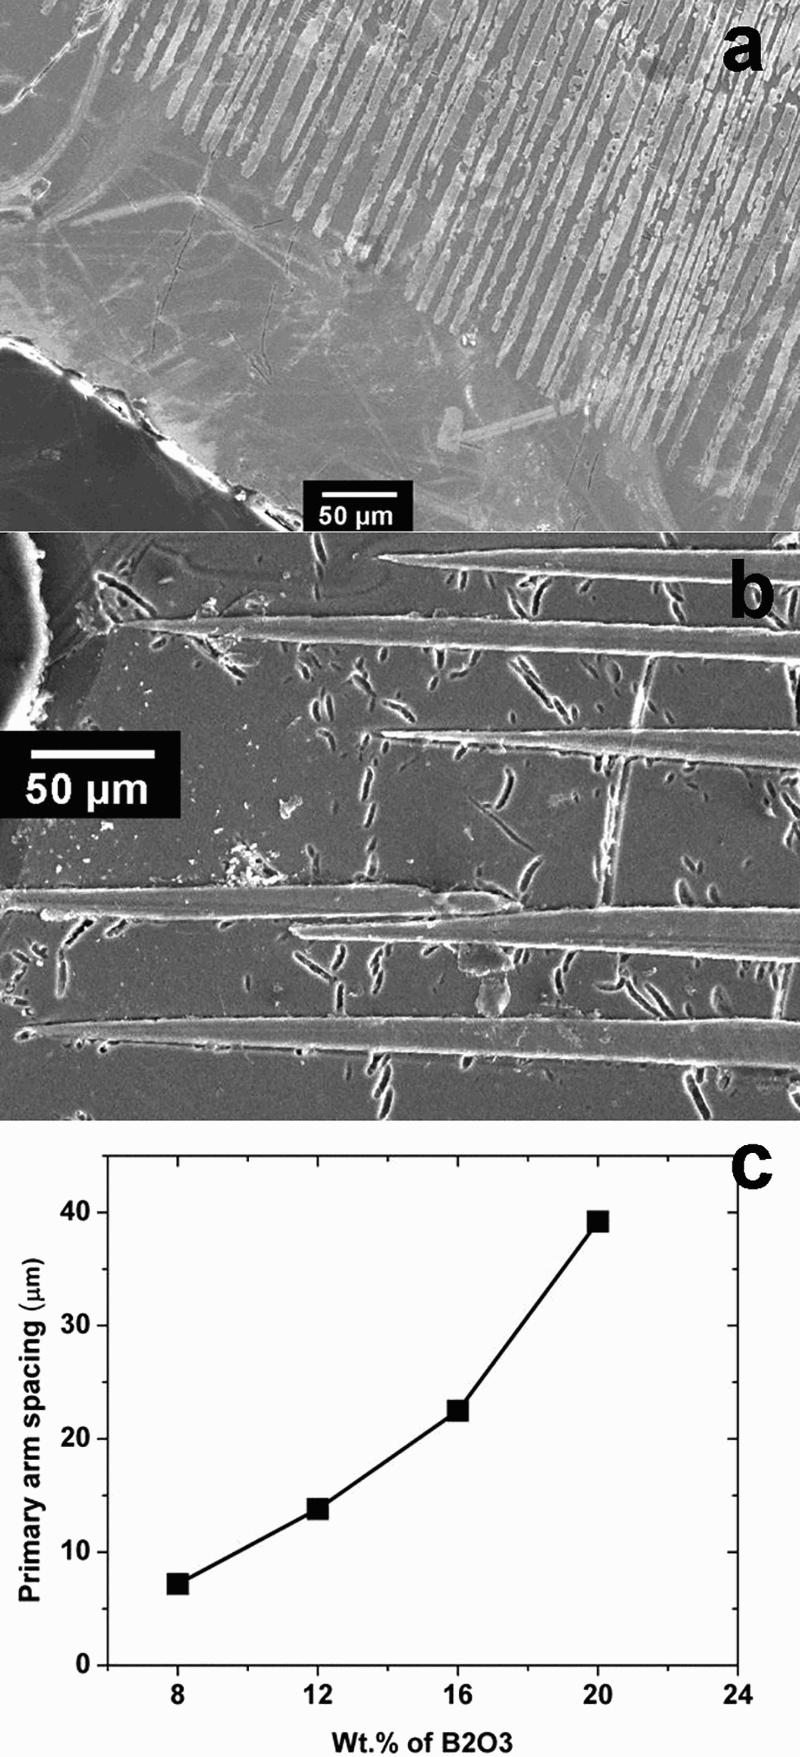
Representative microstructures of samples containing a 12 wt-% B2O3 (sample S11) and b 20 wt-% B2O3 (sample S13); c plot of primary spacing as function of B2O3 content
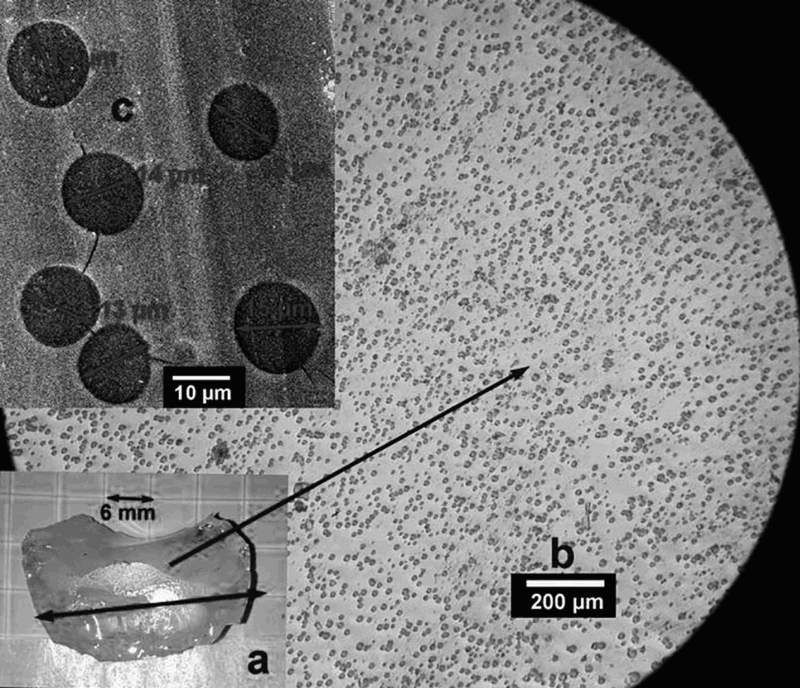
Sample (S14) containing 35 wt-% of B2O3 shows two-layer structure after solidification: a top layer is semitransparent, while bottom layer is transparent; b,c top layer has high density of bubbles with average diameter of ∼14 μm
Dendritic versus cellular growth
From the point of view of having high aspect ratio wollastonite particles, a cellular structure is superior to a dendritic structure due to the cleavage property as explained elsewhere. 9 To summarise, two conditions favour a cellular structure over a dendritic structure: the first is a lower temperature gradient or cooling rate. This effect is supported by Fig. 7. The second condition is to increase the content of additives, i.e. B2O3 in this study, which lowers the melting point of the liquid but does not coprecipitate with the major phase. This effect is seen in Fig. 9.
Conclusions
High aspect ratio 2M-wollastonite particles were prepared through the flux growth process, in which the cellular growth behaviour contributes to the high aspect ratios. The experiments showed that the cellular growth rate decreased with decreasing temperature gradient ahead of the growth front. Experimental results showed that the primary spacing measured from the main part of the samples was nearly independent of crystallisation time and remained nearly constant at ∼7.5 μm at a cooling–furnace temperature of 980°C and with 8 wt-% B2O3 addition. However, it increases with increasing cooling–furnace temperature at fixed 8 wt-% B2O3 addition and fixed crystallisation time, and decreases with increasing B2O3 in the range of 8–20 wt-% at a fixed cooling–furnace temperature and crystallisation time. The cellular/dendritic growth pattern can be affected by the crystallisation rate as well as B2O3 content. The experiments also showed that the mean aspect ratios of the wollastonite particles had strong dependence on the primary spacing, therefore finding the optimum additive addition, and the cooling–furnace temperatures are important to achieving a high mean aspect ratio.
Acknowledgements
This work was supported in part by the U.S.–Egypt Science and Technology Joint Fund in cooperation with U.S. National Science Foundation and the Academy of Scientific Research and Development of Egypt under NSF grant no. OISE 0913513/MAN10011354-F1. Liangzhu Zhu received a scholarship from the China Scholarship Council during the course of this work.