
Abstract
Three groups of bronze based composites with different amounts of slide additive (graphite) and friction additives (SiC and SiO2) were prepared by powder metallurgy technique. The corrosive wear behaviours of the resulting composites in electrochemical aqueous solutions, namely, acidic rain, neutral rain and wastewater, were comparatively investigated. The corrosive wear mechanisms of the bronze composites were discussed based on examination of the worn surface morphologies of the composite block materials by means of scanning electron microscopy equipped with an energy dispersion spectrometry. The determination of corrosive wear rates was carried out by means of a combination of electrochemical and gravimetric techniques. Increasing both slide and friction additives improved the corrosion resistance of these bronze composites. Samples with 1·5% graphite, 3%SiO2 and 3%SiC had the highest corrosive wear resistance in neutralised as well as in acid rain due to the high amount of antifriction and slide additives, in addition to low porosity.
Keywords
Introduction
With the development of cars, motorcycles, tractors and railway vehicles and with growing requirements on speed, performance and reliability, the demands on development of high temperature resistant friction materials are increasing, which could satisfy the high safety requirements and environment protection.1–3 This contribution concerns the development of new metal ceramic friction materials prepared by powder metallurgy technique. Metal matrix composites (MMCs) are engineering materials formed by the combination of a stiff and hard reinforcing phase in a metallic matrix. The matrix includes metals such as aluminium, magnesium, copper and their alloys. The reinforcing materials are ceramic materials like alumina, silicon carbide, boron nitride, etc., in the form of continuous fibres or discontinuous fibres/particles.4–6
Sintered aluminium bronze friction materials have been successfully used in clutches and breaks for heavy duty applications. Sridhara and Gopinath7 studied the influence of SiC on sintered aluminium bronze. SiC content between 4 and 8% is ideal for the friction material. Sharma et al.8 conducted sliding wear test on bronze reinforced with SiC particles and compared with pure bronze. According to Jia et al.,9 the bronze graphite composite (8% graphite) showed much better wear resistance under water lubricated sliding than under dry sliding.
In the light of the above review of the existing literature, the present study aimed to investigate the corrosive wear behaviour of bronze friction resisting composites with specific amount of slide and friction additives required for automotive industry. These specific materials are subjected to different solution media at stagnant and wear speed conditions. The potentiodynamic technique was used to investigate the influence of friction and slide additives, pH of solutions and wear speeds on the corrosive wear rates of bronze composites.
Experimental
The bronze composite group samples (A–C), shown in Table 1, were prepared by means of powder metallurgy (P/M) route by mixing 0·5 kg of bronze powders with different amounts of slide additives (graphite powders) and friction additives (SiC and SiO2) in addition to a certain amount of lubricant (waxes) in a mixing machine. These three mixtures were subjected to compaction under 350 MPa pressure and sintered at 900°C in a reducing atmosphere for 1 h. The sintered materials were subjected to repressing and resintering processes to achieve higher densification and lower porosity, where rods with 1·47 cm height and 1·2 cm diameter were obtained. The Vickers hardness was measured using a 10 kg load in different areas along the samples. These materials with specific additions of friction and slide additives are obtained for manufacturing of clutches used in automotive industry.
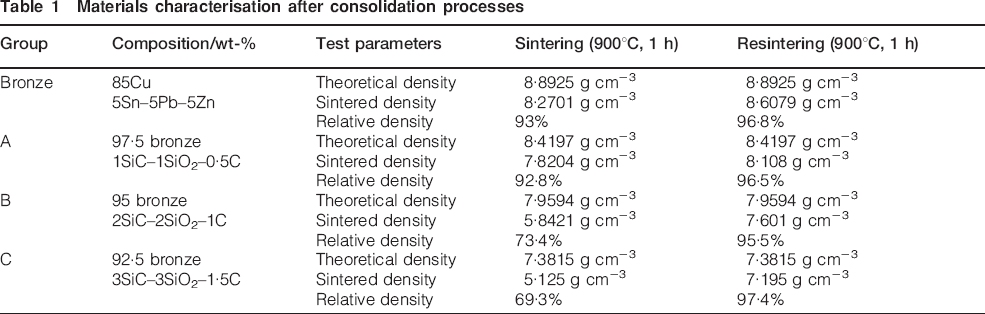
Materials characterisation after consolidation processes
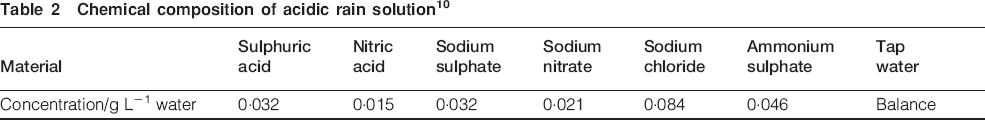
The corrosive wear set-up consisted of acrylic rotating electrochemical cell of 18 cm inner diameter and 20 cm height. The counter piece is a grit-40 abrasive disc fixed at the bottom of the rotating cell. The electrochemical cell comprised a calomel reference electrode connected by a salt bridge and a graphite counter electrode. A balancing arm holding a 4 kg cm−2 load allowed only vertical movement to the specimen's holder attached to it. The bronze and bronze composite working electrodes (cross-sectional area, 0·5 cm2) were mechanically ground with SiC papers up to no. 800, followed by polishing using alumina paste and then rinsed with water and acetone. The surface roughness values Rz of MMCs samples and abrasive rotating disc were 4·3 and 800 mm respectively, where Rz is the average peak to valley height. The initial and final potentials as well as the scanning rate were imposed using a Meinsberg potentiostat/galvanostat apparatus model PS6. The potential was raised anodically from −200 mV relative to open circuit potential up to 1000 mV above (open circuit potential) at a scan rate of 0·5 mV s−1. The corrosion currents (mA cm−2) and corresponding corrosion rate (mm/year) were determined by extrapolation of the anodic and cathodic regions of the polarisation curves at the Tafel regions. In addition to stagnant condition, potentiodynamic tests were conducted under sliding speeds of 15 and 30 cm s−1. Corrosion rate is determined in (mm/year) automatically by PS6 software based on Faraday's principle, which determines the relation between the corrosion current density and corrosion rate. At wear speeds of 15 and 30 cm s−1, the weight loss measurements were taken after each corrosive wear test in the three electrochemical media, while the specific mass loss was expressed in mg cm−2 s−1. The electrochemical measurements were used in conjunction with weight loss analysis to determine the contribution of corrosion and mechanical wear under corrosive wear conditions. The chemical analysis of acid rain solution (pH 3·1) used for potentiodynamic testing is shown in Table 2.10,11 The composition of neutralised acid rain solution was the same as that of acid rain, but it was neutralised using sodium hydroxide, where pH of the solution is adjusted to 6·5. The final solution is the wastewater where pH value is 7. The microstructural investigation was carried out, using a JEOL scanning electron microscope (SEM), after corrosive wear test to observe the effect of additives, pH of different solutions and speeds on the susceptibility of the specimens to corrosion and wear attack.
Chemical composition of acidic rain solution10
Results
Microstructure characterisation
The characteristics of bronze MMC samples after processing are summarised in Table 1. Repressing and resintering processes were used to make limitation to expansion mechanism that results from the non-wettability between the graphite and bronze matrix. The relative density increased, and the porosity decreased with increase in the number of repressing and resintering processes (Table 1). For example, group C was subjected to repressing and resintering processes three times in order to improve the relative density from 69·3 to 97·4%. The corresponding porosity values were 3·5, 4·5 and 2·6% for specimens A–C respectively. Vickers hardness results for three bronze composites. It can also be seen from this table that hardness increased with increase in reinforcement content. The mean hardness values (average of three measurements) for samples A–C were 71, 87 and 98 respectively. Figure 1 shows the scanning electron micrographs of the three P/M prepared groups A–C after corrosion test at stagnant condition where the thick dark region at the interface between particles and matrix shows the high corrosion attack for group B. Figure 1 shows that groups A and C have the lowest corrosion attack since the interface between the matrix and particles was shown as a thin dark region; group C has the highest corrosion resistance. Figure 2 shows the surface morphology for the three P/M prepared groups A–C observed under corrosive wear conditions at 15 and 30 cm s−1. It can be observed that there is no great difference in pattern thickness detected when comparing the behaviour of groups A–C; group C specimens show the lowest surface damage with smooth wear patterns due to the effect of high graphite contents in addition to the presence of friction additives that cause high wear resistance. Fracture of some large carbides and the crushing of smaller additive particles were detected as a result of corrosive wear mechanism. Generally, the intensity of wear patterns increased with increasing wear speed. There is no great difference in the degree of attack for all specimens reflecting the good performance of all test groups in tap water.
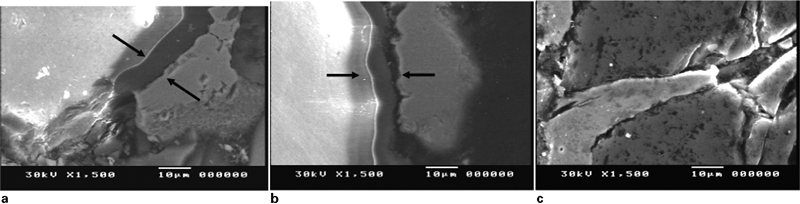
Images (SEM) of bronze composite groups A–C in acidic rain solution at stagnant condition: dark regions refer to corrosion attack
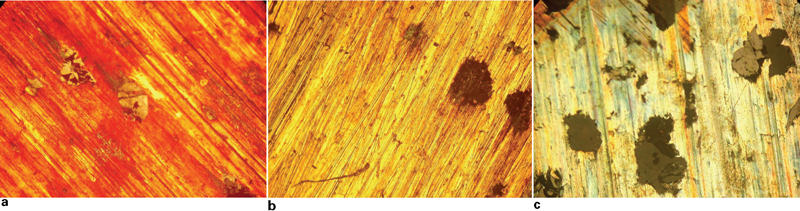
Microstructure of bronze composite groups A–C in neutralised rain solution at wear speed of 30 cm s−1
Electrochemical behaviour in tap water electrolyte
Corrosion test is performed for the P/M prepared specimens without applying rotational wear speed. The data obtained after the test are corrosion potential (mV), corrosion current (mA cm−2) and corrosion rate (mm/year). The polarisation curves for bronze composites are presented in Fig. 3. Table 3 summarises corrosion data for P/M composite leaded bronze specimens in addition to unreinforced sintered bronze. It can be concluded from Fig. 3 that all bronze composite groups show a continuous anodic behaviour, with two distinguished anodic regions. The anodic current density for group B was lower than that for groups A and C up to 100 mV. A second anodic dissolution region appeared above this potential value, during which the anodic current density of group B was even higher than that of the other two groups. In addition, there was a positive shift in corrosion potential with increasing friction (SiO2 and SiC) and slide (graphite) additives. These values were −200, −242, −156 and −156 mV for bronze specimen and composite groups A–C respectively. As may be seen from Table 3, it can be concluded that the corrosion rate for all tested materials was almost the same with relatively low value (∼0·02 mm/year). This means that the bronze specimen as well as bronze composite groups A–C showed no great difference in corrosion behaviour when tested in tap water. For groups A and C, the breakdown potential of the first anodic regions occurred at 200 mV. Above this value, the anodic polarisation curves for A and C were superimposed. In case of specimens group B, the breakdown potential occurred even earlier at ∼50 mV.
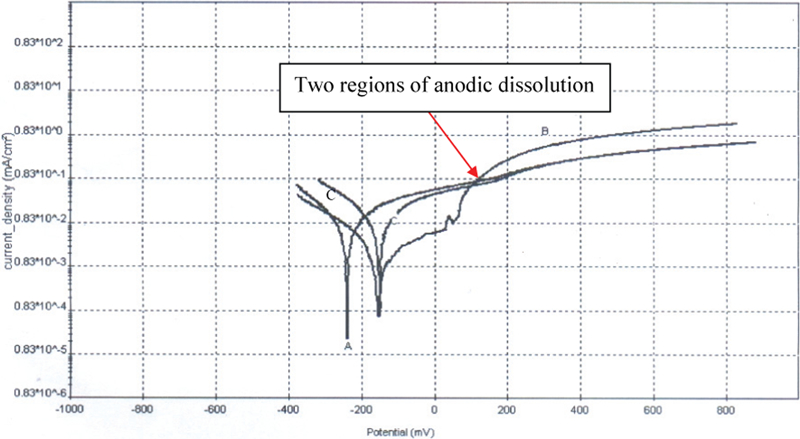
Polarisation curves of bronze composites groups at stagnant condition in wastewater (pH 7)
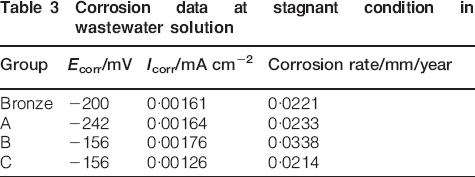
Corrosion data at stagnant condition in wastewater solution
Gravimetric analysis
At wear speeds of 15 and 30 cm s−1, the weight loss measurements were taken after each corrosive wear test in the three media, and the specific mass loss was expressed in mg cm−2 s−1, where the corrosive wear rate is determined by equation (1)

This subsection compares the wear behaviour of tested materials under rotational wear speeds of 15 and 30 cm s−1 in tap water (where the mechanical effect is predominated) and artificial acidic rain as well as neutralised rain solutions. The corrosive wear results, based on the weight losses measurements (mg cm−2 s−1), show the effect of antifriction and slide additives in addition to porosity on the behaviour of investigated specimens. Figure 4 shows the weight loss measurements (mg cm−2 s−1) of the composite bronze groups as well as bronze specimen in the three solutions at a wear speed of 15 cm s−1. It can be concluded that group C has the lowest weight loss in the three solutions. The highest weight loss values were shown for unreinforced bronze specimen in tap water due to the absence of antifriction and slide additives. On the other hand, group B has the highest weight loss value in both artificial acidic rain and neutralised rain media due to the high porosity percentage. There is no great difference in corrosive wear rates of tested materials in tap water and neutralised acidic rain. In tap water, it was shown that the wear rates decrease with increase in additives content, where the highest wear rate was shown for unreinforced bronze specimen. The values of weight loss in both artificial acidic rain and neutralised rain media show that the corrosive wear rates were mainly affected by the porosity percentage, where chemical effect is predominated. In artificial acidic rain and neutralised rain media, it was shown that group B has the highest corrosive wear rates due to the highest porosity percentage.
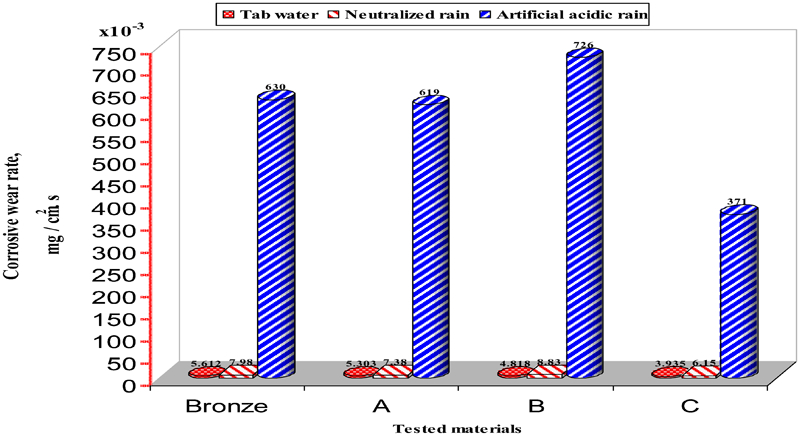
Corrosive wear rates of three groups in addition to standard bronze in wastewater, artificial acidic rain and neutralised rain solutions at wear speed of 15 cm s−1: A.R, N.R and W refers to acidic rain, neutral rain and wastewater respectively
Polarisation curves
The corrosion currents were determined by extrapolation of the anodic and cathodic regions of the polarisation curves at the Tafel regions. The corrosion rate (mm/year) is determined automatically by PS6 software based on Faraday's principle, where the relation between the corrosion current density and corrosion rate is as shown in equation (2)

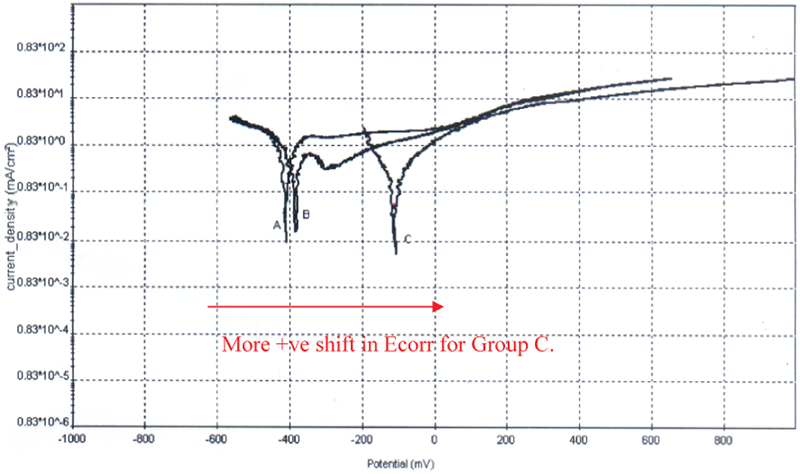
Corrosive wear test is conducted for the three composite groups with applying rotational wear speeds of 15 and 30 cm s−1 in artificial acidic rain solution. This subsection indicates the polarisation curves of the tested groups illustrating the cathodic and anodic behaviour of these materials and the corresponding corrosion current, corrosion rate and corrosion potential. Figure 5 represents the corrosive wear behaviour of the P/M leaded bronze composite groups tested in artificial acidic rain solution at a speed of 15 cm s−1. Similar to stagnant conditions, the anodic polarisation curve for groups A and B was divided into three regions; the first region shows anodic dissolution with sharp increasing slope, the second region indicates reduction in current density followed by a quasi-steady state behaviour and the final region shows another anodic dissolution region with an increase in the slope.
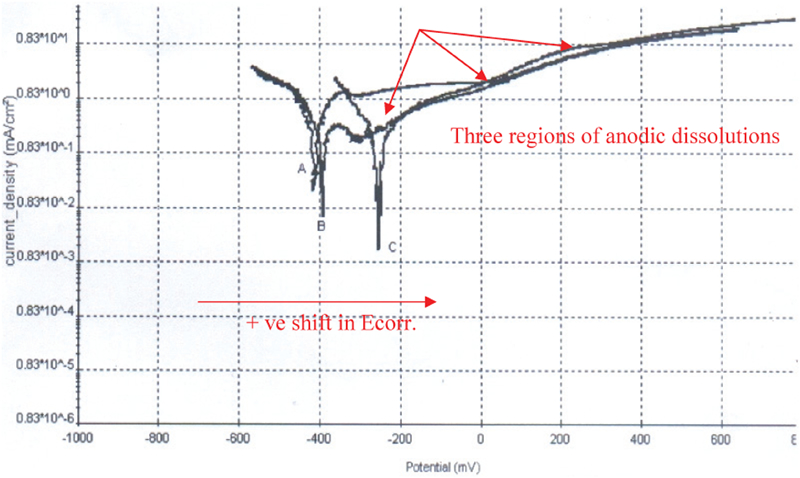
Polarisation curves of bronze composite materials at wear speed of 15 cm s−1 in artificial acidic rain solution
The anodic polarisation curve of group C was composed of only two regions with increasing slope. This increase in anodic current density started at ∼0 mV for the three groups A–C. An anodic dissolution peak is observed at about −380 mV for groups A and B. The sharpness of the peak was shown for group B. Figure 5 also compares the corrosion potential for groups A–C, where group C has more positive potential than groups A and B. This shift in corrosion potential is due to the high contents of additives (SiC, SiO2 and graphite) in group C and formation of a graphite layer on the surface resulting from the wear process. The corrosion potential values were −415, −401 and −284 mV, where the corrosion current values were 0·0819, 0·0961 and 0·0492 mA cm−2 for groups A–C respectively.
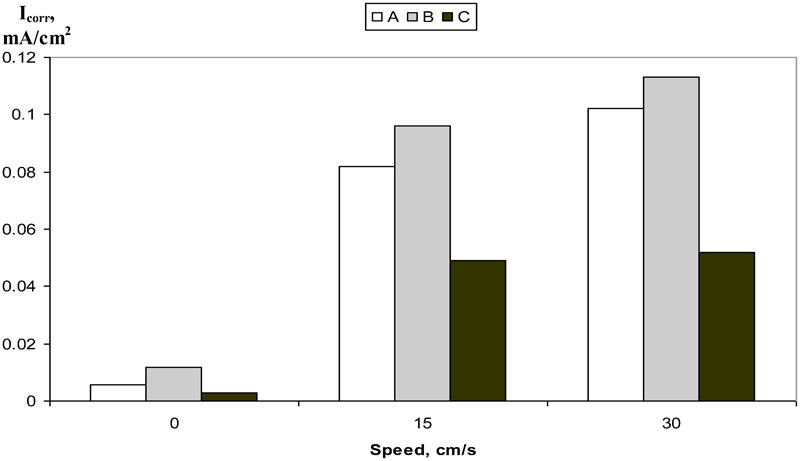
Similar to corrosive wear test conducted at the rotation speed of 15 cm s−1, the anodic polarisation curves for groups A and B in Fig. 6 were divided into three regions; the first region shows anodic dissolution with sharp increasing slope, the second one shows decrease in current density followed by steady state behaviour for group A and the third region shows another anodic dissolution region with an increase in slope starting at 0 mV. For group C, the anodic polarisation curve was divided into two regions with increasing slope. This change in anodic current density started at ∼0 mV for the three groups A–C. An anodic dissolution peak is observed at about −380 mV, for groups A and B. Figure 6 shows the corrosion potential shift among groups A–C, where group C has less active corrosion potential than groups A and B. The corrosion potential values were −415, −391 and −109 mV, where the corrosion current values were 0·102, 0·113 and 0·0519 mA cm−2 for groups A–C respectively.
Polarisation curves of bronze composite materials in artificial acidic rain at wear speed of 30 cm s−1
Discussion
The morphologies of worn surfaces (Fig. 2) indicate that group C has the highest wear resistance where smooth wear patterns were shown. The basic factor affecting the wear of bronze friction materials is the amount of additives, the graphite slide additive acting as a protective surface layer causing high wear resistance as shown in group C. Sridhara and Gopinath7 have reported that, with increasing SiC content, the interconnected porosity decreases, so does the dimensional changes. Further, SiC does not undergo any change, and it also does not react with the base matrix. Sharma et al.8 have reported that SiC, which is a ceramic, due to its directional covalent bonds and relatively lower concentrations and mobility of crystalline defects, is not prone to seizure under rubbing conditions. During the sliding wear, the SiC particles get sheared and adhere to the metal surface with the major axis parallel to the sliding direction forming a thin film between the mating surfaces. Moreover, the hard film of SiC has very limited ductility and has the ability to withstand stress without plastic deformation or fracture under low load conditions. It is well established that the wear rate and surface damage can be minimised if the plastic deformation of the material at the counter interface is prevented. Graphite particles are used as lubricant to reduce friction and minimise wear in case of sliding contacts. The presence of the lubricating film prevents direct contact between the mating surfaces resulting in good tribological properties. Group B has the highest corrosive wear rates in artificial acidic rain and neutralised rain compared to groups A and C as well as unreinforced bronze due to the highest porosity contents, which are more sensitive to these solutions (basically chemical effect). The porosity contents were decreased by applying repressing and resintering processes to achieve densification. The unreinforced bronze has the highest wear rates in wastewater under wear condition, where the wear rates depend basically on the amount of additives (basically mechanical effect) as shown in Figs. 7 and 8. The lowest corrosion rate was shown for group C in the neutralised rain and wastewater. There was no great effect of pH on the corrosion rate of group C when tested at stagnant condition (0·0214 and 0·0441 mm/year) in tap water and neutralised rain respectively. It is clear that the corrosion rate of the tested materials at acidic medium is higher than that at neutral medium or tab water due to more anodic dissolution of Cu in the acidic solution according to the following anodic and cathodic reactions


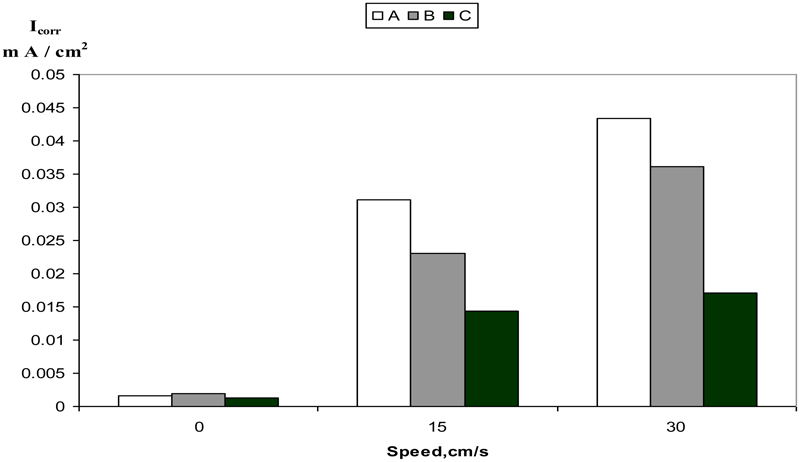
Effect of wear speeds on corrosion current of bronze composite materials in wastewater (error bars, ∼0·00035 mA cm−2)
Effect of wear speeds on corrosion current of bronze composite materials in artificial acidic rain (error bars, ∼0·00019 mA cm−2)
Conclusion
The increase in amount of graphite (slide additive) leads to a decrease in densification of materials after sintering due to the expansion in the direction of compaction resulted from the non-wettability between the bronze matrix and graphite reinforcing particles.
The increase in the number of repressing and resintering processes during P/M preparation of the materials leads to a decrease in the amount of porosity and the expansion percentage.
Group C of bronze composite materials has the highest corrosive wear resistance in the different media (neutralised rain and tap water) due to the high amount of slide and friction additives in addition to the low amount of porosity.
As the amount of porosity increases, the corrosive wear resistance decreases. This can explain the lower corrosion resistance of group B compared with group C especially in artificial acidic rain and neutralised rain.
The increase in wear speeds leads to an increase in corrosive wear rates of bronze friction materials in the three different media. The graphite contents have a positive effect as a slide additive during testing at wear speeds (15 and 30 cm s−1) decreasing surface damage.
As pH values of different media decrease (increasing in acidity), the corrosive wear resistance of bronze friction materials decreases, where group B was more sensitive to pH change.