
Abstract
The minimisation of friction and adhesion during sliding contacts is crucial for the industrial fabrication of many micro/nanodevices (e.g. MEMS/NEMS), as well as in nanotechnological processes, e.g. in nanoimprint lithography where a silicon mould is used to fabricate polymeric nanostructures by imprinting. We have conducted intensive research on the contact between the mould and PMMA polymeric resist film via advanced modelling and computer simulations. The properties of the contacting surfaces have been identified with the atomic force microscope and nanoindentation, as well as wettability tester applied for the identification of the surface free energy. A model of contact has been elaborated and adequate original software was used to calculate the frictional and adhesive forces in particular at the silicon mould/polymeric resist interface.
Notation
nominal contact area, m2
real contact area, m2
distance between surfaces, m
distance between surfaces at no load, m
Young's modulus, MPa
Young's modulus (model parameter), MPa
adhesion force, N
friction force, N
Winkler layer's thickness, nm
distance between contacting surfaces, m
external load, N
mechanical (deformation) force, N
standstill time of contact, s
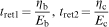
retardance time (model parameter), s
relative real area of contact, %
roughness parameter (the arithmetic average of the roughness profile), nm
singular surface area, m2
adhesive deformation of the surface, m
surface height over reference plane, m
intermolecular distance, m
surface free energy, mJ m−2
Poisson's ratio
Introduction
In the recent years, there are many new polymers used in nanotechnology, in particular in the nanoimprint lithography (NIL) due to specific requirements of this process.1–4 The NIL becomes a propitious fabrication technique for the production of micro/nanostructures and devices. However, there are many technical difficulties in this technology mainly dependent on frictional and adhesive behaviours of contacting materials. Since these materials are mostly applied as ultrathin films (100–500 nm), it is not possible to use directly their macroscopic properties in modelling and simulation of, e.g. NIL process which is realised often by mechanical imprinting of a thin layer of polymeric material within a silicon mould.
In order to control adhesion and friction at the mould/resist interface, it is crucial to have the ability to identify the material properties in the same scale as under the real conditions of micro/nanosliding contact in NIL. The problem of the polymer behaviour in the NIL process at the interface is not enough understood.4 Furthermore, small structure's size and process conditions make it very hard to incorporate standard measurement techniques directly in the contact area of the mould polymeric film.
A computer simulation of the friction process is the easiest way to obey real experimental inconveniences and to identify differences of the tribological/adhesive behaviours depending on the contacting materials at the interface between mould and fabricated structures, as well as to evaluate the effect of the scale (size) of contact.
Modelling details
Model
According to molecular mechanical theory proposed in detail by Tabor and Kragielski,5–7 the friction force between two interacting surfaces consists of two components: deformational and adhesive one. The first (mechanical) component is related to the necessity of mutual deformations of the mating surfaces surface layer's asperities. The adhesive component is, however, caused by the molecular bonds between two contacting surfaces.
In the process of friction between two surfaces, particularly polymeric ones, the adhesive component of the total friction force is significant and cannot be neglected. Decreasing the surface roughness leads to the bigger value of the adhesive component, and in contrary the increased roughness effects that the mechanical component is becoming more important. The exact magnitudes of both components depend on several factors, mostly external load, surface roughness and waviness, mechanical properties, adhesive properties, etc.6,7
An important issue in the description of the tribological behaviour of the frictional contacts is the determination of the real contact area Ar, which is a sum of the elementary areas of the asperities of the surfaces being in contact. The real contact area is the zone where direct force interaction occurs and hence friction force and wear are highly dependent on its actual value.7 On the other hand, the real contact area depends mainly on the surface roughness and is a result of the surface asperities deformation and penetration under the load.
Simulation input data
Most of the input data for modelling must be obtained from the real samples provided and identified during additional testing. For each sample there is a need to use an atomic force microscopy (AFM) to identify the topography of the surface on nanoscale, as well as other parameters like Young modulus Ea (can be obtained from the nanoindentation), Poisson's ratio ν and the surface free energy γ (estimated with the use of the dedicated wettability tester). These parameters (properties) of the contacting materials/components are most important in frictional interactions in the contact area.
There are also other important parameters, e.g. intermolecular distance ϵ (assumed to be ∼2 nm) and Winkler's layer thickness h (assumed as 2000 nm). These parameters of the sample/countersample interface and two simulation experiment variables, external load N and standstill time tp, have been taken into consideration in the model of contact and consecutively varied in the following simulations.
For polymers their time dependent, rheological behaviour must be additionally taken into account and consequently additional model parameters are determined: Young modulus Eb and Ec and retardance times tret1 and tret2. The methodology of the experimental tests to identify these parameters are described in Ref. 8.
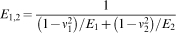
The Voigt–Kelvin model of the second degree was chosen (Fig. 1), as it can describe viscoelastic polymer behaviour in the time domain providing reasonable accuracy. According to the model, all three values of Young modulus and two retardance time values can be recalculated into one time dependent Young modulus of the material
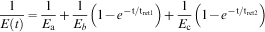
Voigt–Kelvin model applied for description of rheological behaviour of used polymeric material
Modelling procedure
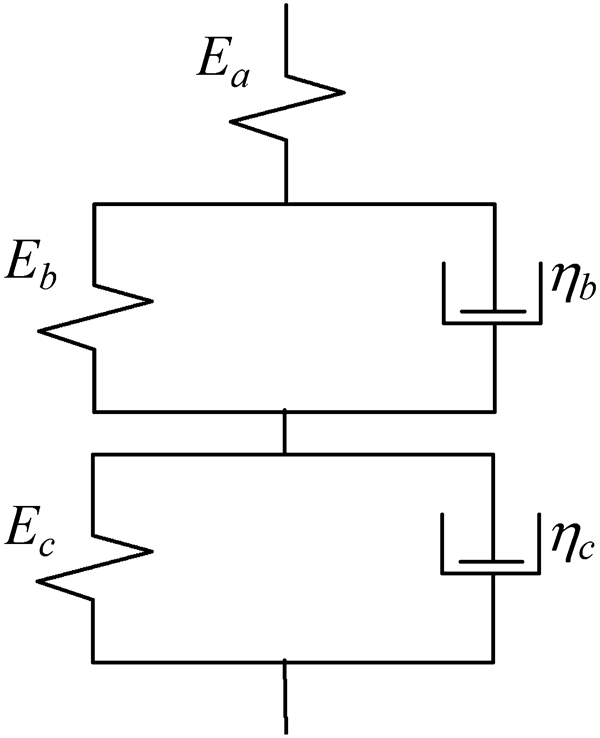
At the first stage, sample and countersample topographies are put virtually together (Fig. 2). Contact area is under constant, external load N and contacting surfaces are separated by the distance d. Topography height zi is identified by AFM as the distance to the reference plane situated at the lowest point of the topography image.
Model of contact with Winkler's layers
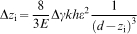
Tribological interaction modelling requires additional assumption to simplify the model. Elastic deformation of the surface is represented as the deformation of many, individual Winkler's springs with the elementary surface area Si and height h, referenced later as Winkler layer height. No deformation is expected below the Winkler's layer.
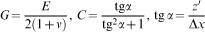
In order to simplify the simulation process, initial contact interface of the both, rough samples is changed into one rough sample interfacing flat, rigid surface (Fig. 3). Owing to this, the model input data must be recalculated. The surface deformation process is characterised by parameters related to physical mechanical behaviour of the samples. The numbers in the bottom indexes indicate first and second sample (countersample) respectively

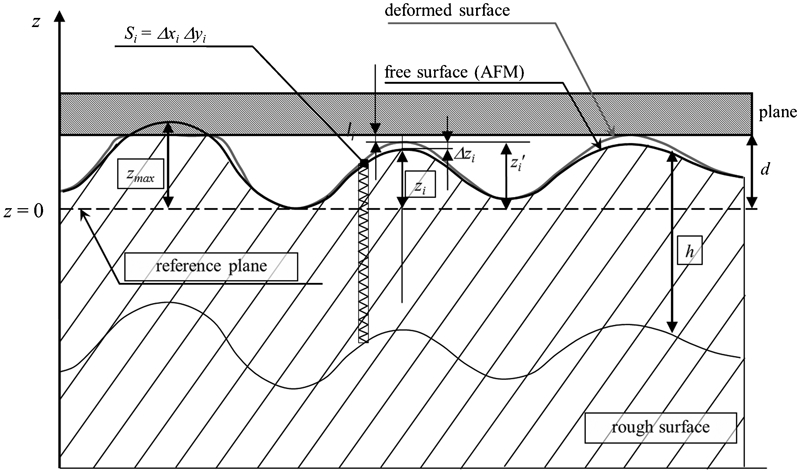
Model of rough surface with reference plane
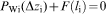
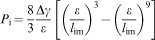
Conforming to the model similarity rule, the elementary force Pwi opposed to elastic deformation of the surface can be described as

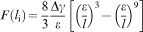
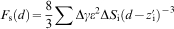
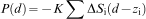
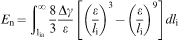
The exact description of interacting surfaces separated by small nanometric size gap cannot be described properly without the intermolecular forces which should be taken into account. The molecular force F(li) is a derivate of potential energy described with the Lenard–Jones potential and can be calculated with the use of the following equation
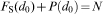
The force equilibrium requires that all forces sum up to zero


The relative real contact area Ar can be also specified in per cent as a ratio of topography real contact points Ar to the nominal (contour) area of contact An

Calculation of friction forces
As the result of the previous equations, for every topography contact point, the adhesion and mechanical forces (adhesive and mechanical components of the friction force) can be calculated for every equilibrium distance.
Based on the knowledge which surfaces points are in the contact and which are under non-contact interactions, two above mentioned components (contact and non-contact) of the friction force can be therefore well identified.
When two surfaces in the contact, bonded by adhesion forces and under the influence of lateral force are sheared, every singular Winkler's layer (in the points of interaction) is sheared as well.
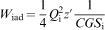
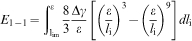
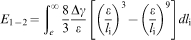
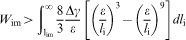
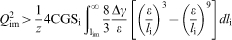
The lateral force work Wiad can be calculated as
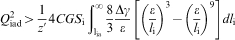
Adding together Qiad forces for all non-contact interacting points gives finally non-contact friction force component Tad

It can be written as


Results and discussion
Macroscale contact results
The proposed model and simulation algorithm can be used for both macroscale polymers as well as here in particular for nanotechnological contacts, e.g. to estimate the frictional/adhesive interactions in the mould/imprinted material interface in NIL fabrication processes. The polymeric components from the first group of macroscale sliding contacts usually indicate much higher surface roughness. When they are put into contact, initial, real surface of contact is relatively small (<20%) and increases highly with the increased contact pressure (Fig. 4).
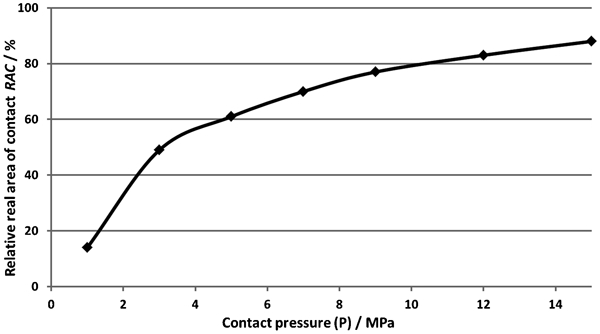
Real area of contact dependence on contact pressure (external load) for macroscale samples. Simulation size is 1×1 mm. Standstill time tp = 10 s. Both samples identical (material: polyamide 6; Ea = 1800 MPa, ν = 0·35, γ = 72 mJ m−2, Eb = 1470 MPa, Ec = 1850 MPa, tret1 = 9·9 s, tret2 = 65 s, Ra = 9·3 nm)
Friction force depends evidently on the contact pressure but the relationship between contact pressure and relative area of contact is not linear. Relatively strong dependence is observed for small loads and much lesser for high loads (Fig. 5).
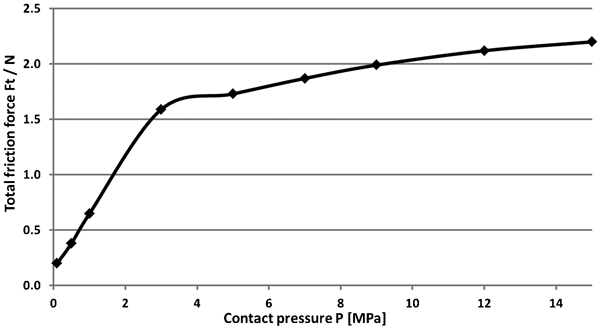
Friction force dependence on contact pressure (external load) for macroscale samples. Simulation area size is 1×1 mm (area of contact). Standstill time tp = 10 s. Both samples identical (material: polyamide 6; Ea = 1800 MPa, ν = 0·35, γ = 72 mJ m−2, Eb = 1470 MPa, Ec = 1850 MPa, tret1 = 9·9 s, tret2 = 65 s, Ra = 9·3 nm)
The significant friction force decrease can be observed with the increase of the contact pressure (Fig. 6).
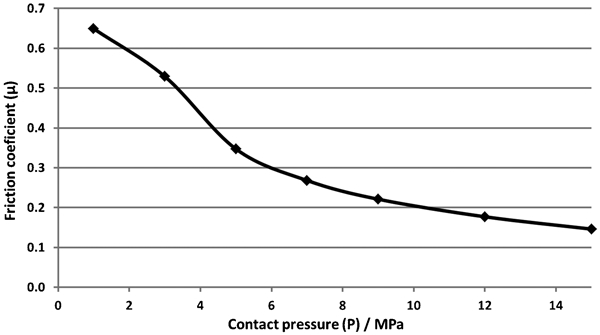
Friction coefficient dependence on contact pressure for macroscale samples. Simulation area size: 1×1 mm. Standstill time tp = 10 s. Both samples identical (material: polyamide 6; Ea = 1800 MPa, ν = 0·35, γ = 72 mJ m−2, Eb = 1470 MPa, Ec = 1850 MPa, tret1 = 9·9 s, tret2 = 65 s, Ra = 9·3 nm)
Nanoscale contact results
The sliding contacts used directly in NIL fabrication process (silicon mould/polymeric thin film interface) show totally different behaviour. The high flatness of the samples causes very fine fit of the couple at initial contact and therefore huge superiority of the adhesion friction component over the mechanical one. In such a case, pulling forces generated in the interface are usually much higher than external load applied, making it negligible. The typical friction coefficient values calculated according the rules for the macrocontacts can easily exceeds the value of 10. Friction force dependence on contact pressure cannot be seen and can be considered as constant (Fig. 7).
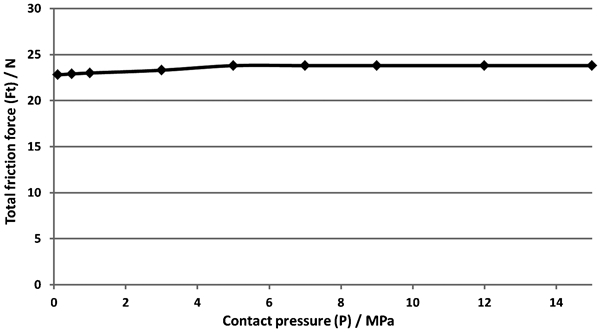
Friction force dependence on contact pressure (external load). Simulation area size: 1×1 mm. Standstill time tp = 10 s. Samples: silicon mould (Ea = 169000 MPa, ν = 0·27, γ = 1200 mJ m−2, Ra = 3·2 nm) versus PMMA imprint (Ea = 550 MPa, ν = 0·4, γ = 40 mJ m−2, Eb = 1470 MPa, Ec = 1850 MPa, tret1 = 9·9 s, tret2 = 65 s, Ra = 3·2 nm)
The real area of contact is close to 100% at the initial contact and does not change much with the increasing contact pressure (external load) (Fig. 8).
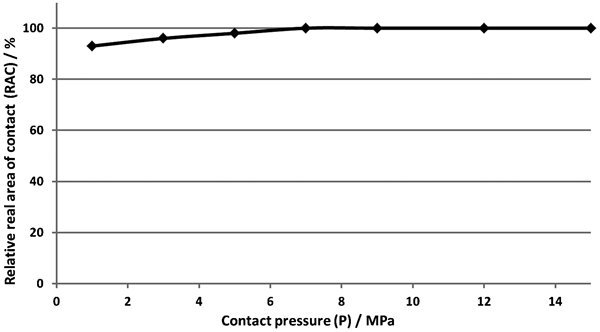
Real area of contact dependence on contact pressure (load). Simulation area size: 1×1 mm. Standstill time tp = 10 s. Samples: silicon mould (Ea = 169000 MPa, ν = 0·27, γ = 1200 mJ m−2, Ra = 3·2 nm) versus PMMA imprint (Ea = 550 MPa, ν = 0·4, γ = 40 mJ m−2, Eb = 1470 MPa, Ec = 1850 MPa, tret1 = 9·9 s, tret2 = 65 s, Ra = 3·2 nm)
There is also very small difference at all in friction for the samples with very small roughness unless it hits a certain value (3 nm for Ra parameter in the presented case) (Fig. 9). At that point the friction force is reduced significantly (>50% in the analysed case). There is also an increase in the friction force expected when the roughness increases further, but it was not possible to observe this phenomenon with studied sample materials.
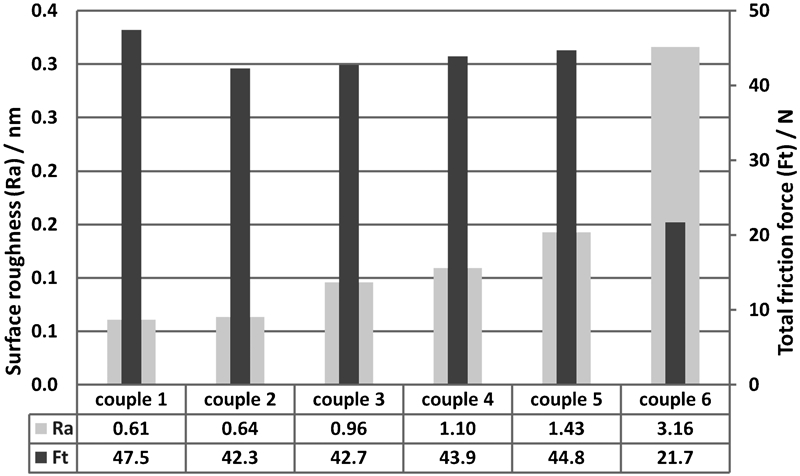
Total friction force change (narrow bars) as a function of the sample roughness (wide bars); both samples of the contacting components used in NIL process come from the same process and have the same roughness Ra. Simulation area size: 1×1 mm. Standstill time tp = 10 s. Samples of each contact: silicon mould (Ea = 169000 MPa, ν = 0·27, γ = 1200 mJ m−2) versus PMMA imprint (Ea = 550 MPa, ν = 0·4, γ = 40 mJ m−2, Eb = 1470 MPa, Ec = 1850 MPa, tret1 = 9·9 s, tret2 = 65 s)
Conclusion
New hybrid theoretical experimental modelling based on the results of the investigation of important properties of the surface layers of real components on nanoscale with the use of AFM and nanoindentation, as well as wettability studies (for estimation of surface free energy) is proposed to predict the frictional/adhesive properties at the interface of in particular silicon/polymer contacting components both for macro- and micro/nanocontacts.
The original software application was elaborated in order to perform simulations based on the proposed Winkler's layer modelling of contact and it was used to demonstatre the differences in the frictional behaviour between macro- (rough) and nano- (smooth) scale contacts.
The simulation model is based on the assumption that it is possible to separate the friction force into the adhesive and mechanical components. Both components depend on the real contact area of the samples in contact. The external load carried out by the interfacial contact, the roughness of both samples and rheological processes in the contact area have been included in the modelling and PC simulations.
The friction force forecasting with the proposed simulation method seems to be an attractive especially when there is a need to look for optimal friction pairs for a certain application.
Based on previous experiments with the use of similar model,8 high correlation of the results with the results of experiments can be expected. However, it is still to be verified on the dedicated test rig currently being under construction and dedicated to experimental simulation of the friction at the NIL silicon mould/polymeric thin film interface.
It is our belief that the important step was already carried out enabling in near future a wider use of the model and simulation software which can become versatile tool facilitating a proper design of polymer friction contact in nanotechnological applications particularly in the NIL process.