
Abstract
Variation in the water vapour sorption kinetics of the stemwood of Sitka spruce (Picea sitchensis (Bong.) Carr.) has been studied, with respect to possible variations between earlywood and latewood and between different annual ring positions from pith to bark. The sorption kinetics was analysed using the parallel exponential kinetics (PEK) model that has recently been introduced by this laboratory for studies with wood. Significant differences in kinetic parameters were found between ring positions, corresponding to differences between juvenile wood and mature wood that contrast with previously reported work in the literature. Differences were also found in the sorption kinetics of earlywood and latewood in agreement with the literature. Thus far, there has been no satisfactory explanation as to the physical interpretation of the PEK model and in this paper it is argued that the kinetic behaviour is consistent with what would be expected for sorption with a viscoelastic material. Analysis of the PEK data using the Kelvin–Voigt model has proved that it is possible to obtain values for the wood cell wall stiffness and viscosity that are in broad agreement with previously published values in the literature.
Introduction
Although many studies have been reported on the sorption properties of wood with respect to water vapour, these have mainly been concerned with the equilibrium state (Skaar 1972; Siau 1984). By contrast, there has been rather less work performed investigating the sorption kinetic properties of timber, especially comparing any possible differences in behaviour in wood from different locations within the tree or between earlywood and latewood within an annual ring. Those studies that have been published in the peer-reviewed literature invariably invoke classical Fickian diffusion models in order to analyse the sorption kinetics (e.g. Droin et al. 1988; Wadsö 1994a,b; Houška and Koc 2000; Time 2002; Krabbenhoft and Damkilde 2004). While such models may be valid when considering large wood samples, this is not the case when considering small sample sizes (Wadsö 1994a,b). It has been demonstrated that non-Fickian diffusion is observed when water vapour sorption with thin wood and cellulosic samples is examined and that the sorption kinetics are, in fact, related to the swelling of the substrate (Christensen 1959, 1965). Using thin samples of wood of variable length, Krabbenhoft and Damkilde (2004) were able to show the non-Fickian nature of the sorption process and developed a model based upon the premise that the sorption process was limited by the rate of swelling of the substrate.
It has recently been demonstrated that the water vapour sorption kinetics of wood flour is accurately determined using the parallel exponential kinetics (PEK) model (Hill et al. 2010a,b; Jalaludin et al. 2010a,b,c; Xie et al. 2010a,b). The PEK equation has the form

At present, there is no consensus regarding the physical interpretation of the PEK model. However, it is well known that diffusion behaviour in swelling polymers cannot be described by Fickian models, particularly with glassy polymers (Crank 1998). Three types of behaviour can potentially be observed (Alfrey et al. 1966):
case I – classical Fickian diffusion, where the rate of diffusion is lower than the rate of relaxation of the polymer
case II – relaxation-limited diffusion, where the rate of diffusion is very fast compared with the relaxation process
case III – anomalous or non-Fickian diffusion, which is observed when the rates of relaxation and diffusion are comparable.
Case II is applicable where the experimental sorption data fit the PEK model: in this situation the sorption kinetics is determined by the swelling rate of the matrix (Krabbenhoft and Damkilde 2004). The forms of the fast and slow components of the PEK equation are identical with that describing the dynamic response of a Kelvin–Voigt element (Fig. 1) when subjected to an instantaneous stress increase σ0

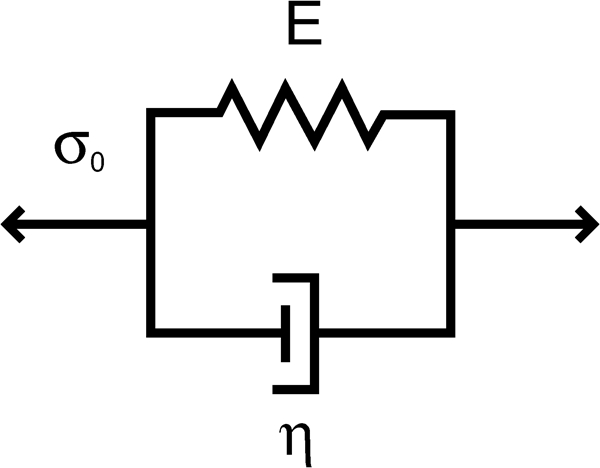
Illustration of Kelvin–Voigt element showing instantaneous stress σ0, modulus E and viscosity η components
The purpose of the present paper is to report on further developments into studies of the use of the PEK model to describe water vapour sorption kinetics with wood. In particular, this paper investigates possible differences in the sorption behaviour of wood taken from different radial positions within a tree and between earlywood and latewood. While there is large amount of inter- and intra-ring variation in anatomical characteristics such as cell wall thickness and cellulose microfibril angle and chemical composition (e.g. Ifju and Kennedy 1962; Biblis 1969; Law et al. 1977; Law and Koran 1979; Panshin and de Zeeuw 1980; Dinwoodie 2000), very few studies have investigated whether there are inter- and intra-ring differences in sorption behaviour, especially regarding sorption kinetics behaviour and certainly no such studies interpreting the data with the PEK model. It is well established that there are differences in sorption kinetics behaviour between different plant fibres, it might therefore be reasonable to expect some differences in different parts of the tree and especially between juvenile and mature wood.
Materials and methods
The wood samples used for the sorption studies were obtained from a disc that was cut from the stem (breast height) of a Sitka spruce (Picea sitchensis (Bong.) Carr.) tree growing in Kershope forest, Cumbria, UK. A radial section was removed from the disc and from this section, wood samples weighing 20 mg were obtained from the earlywood and latewood regions of annual rings 4, 6, 8, 10, 20 and 27. Isotherm analyses were undertaken in a dynamic vapour sorption intrinsic apparatus (Surface Measurement Systems, London, UK). The dynamic vapour sorption instrument comprises a measurement pan suspended from a Cahn ultra-sensitive microbalance that is capable of measuring changes in sample mass to a resolution of 1 part in 10 million. The sample sits in a climate controlled chamber (located in a thermostatically controlled cabinet) through which there is a constant flow of dry nitrogen gas and into which is mixed another flow of a user-set amount of water vapour also in nitrogen. In the study described in this paper, the instrument was set to record sample mass at each of the following RH steps (adsorption): 0, 5, 10, 15, 20, 30, 40, 50, 60, 70, 80, 85, 90 and 95%, at a temperature of 25°C and in the reverse sequence for the desorption isotherm. The instrument maintained the sample at a constant RH until the rate of change in mass dm/dt was less than 0·002% min−1 over a 10 min period; a criterion that from previous experiments had been shown to give a sample MC to within less than 0·1% of the equilibrium value (Hill et al. 2010a). Data were gathered every 20 s. During operation, it was found that the temperature and humidity values were very stable (RH ±0·1%, temperature ±0·1°C) although both the RH and temperature did not necessarily stabilise at the pre-set values. A full description of the apparatus and the methodology has been reported elsewhere (Hill et al. 2009, 2010a,b). Each kinetic curve was obtained by plotting percentage mass gain/loss against time, with time zero corresponding to the point at which a RH step change occurs. However, a change of RH from, for example, 0 to 5% does not occur instantaneously in the instrument and there is a finite time during which the RH is moving from one stable value to the next. During this period, the MC of the sample is not moving towards a static equilibrium point, which consequently affects the kinetics curve for the first minute or so.
The data from the kinetics curves were fitted to equation (1), using the function ‘expassoc’ in Origin 7·5 software (Originlab, Northampton, MA, USA). Since the first few data points in this curve are associated with the sample MC under conditions of changing RH, the characteristic times for any fit including these curves will not be representative of the material properties and they are consequently removed from the fit. However, as more data points are excluded from the curve fitting process, the values for the mass changes for the fast and slow kinetics processes become less accurate. In practice, with data being collected every 20 s, removal of the first three data points was sufficient to obtain good quality curve fits.
Intra- and inter-ring differences in the four kinetics parameters from equation (1) (i.e. t1, t2, MC1 and MC2) were examined using three-way analysis of variance (ANOVA). In these analyses, the effects of RH, earlywood/latewood and ring position were assumed to be additive. Because only one sample from the earlywood and latewood regions of each ring was analysed, it was not possible to examine the interactions between these factors. However, visual inspection of the data indicated that there was no interaction between RH and either ring number or earlywood/latewood for any of the four parameters investigated. Results from the adsorption and desorption measurements were analysed separately using the open source statistical software package R (R Development Core Team 2010). The assumptions made when conducting ANOVA, particularly homogeneity of variances and normality, were examined and where necessary the data were log transformed. Where significant effects of ring position were found, pair-wise comparisons between individual rings were performed using Tukey's honestly significant difference test with a family-wise level of significance of 95%.
Results and discussion
There was no relationship found between the ring location of the wood, or between earlywood and latewood and the observed sorption isotherm. The results for all of the isotherms recorded are shown in Fig. 2, where it can be seen that there is a high level of reproducibility of the isotherms up to 85%RH, but there is increasing scatter in the results thereafter. This has also been reported for multiple isotherms of plant fibres (Hill et al. 2009). The reason for this lack of reproducibility in the upper end of the hygroscopic range is unknown, but it is possible that there is a contribution from capillary condensation above 85%RH and that sample defects, such as microcracks arising from preparation may also be responsible for the scatter observed.
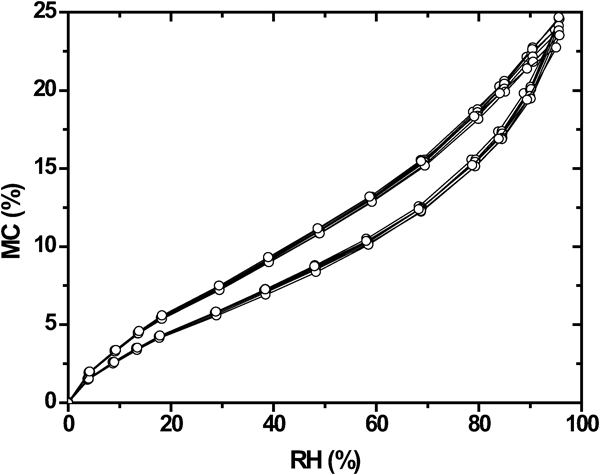
Comparison of sorption isotherms for different aged growth rings (earlywood and latewood): no trends in sorption behaviour were found related to ring number, nor between earlywood and latewood; isotherms are highly reproducible except above 85%RH
Figure 3 shows the mass data for a typical adsorption kinetics run for a sample (earlywood from ring 10) with a RH change from 5 to 10% with a PEK curve fit. The adsorption curves mathematically generated from the fitting parameters are also shown (labelled ‘fast’ and ‘slow’). The variation of the PEK parameters t1, t2, MC1 and MC2 at various final RH values for adsorption onto the earlywood from different annual rings is shown in Fig. 4. The dotted lines at RH of 20 and 80% indicate where there is a step change in RH from 5 to 10%, since this affects the fitting parameters. The values of t1 and t2 generally increase with greater RH, although at the lower end of the hygroscopic range, there is invariably a slight increase also. The trends for MC1 and MC2 are similar; at the top end of the hygroscopic range, there is considerable scatter in the kinetic data.
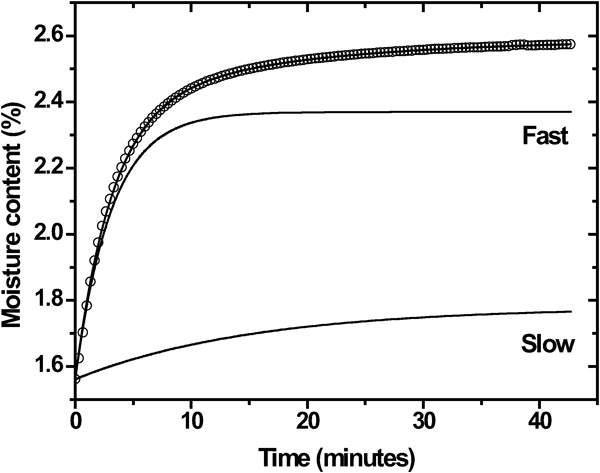
Parallel exponential kinetics fit to kinetic data for adsorption with earlywood ring 10, showing fast and slow contributions to kinetics process: sum of fast and slow curves is shown running through data points
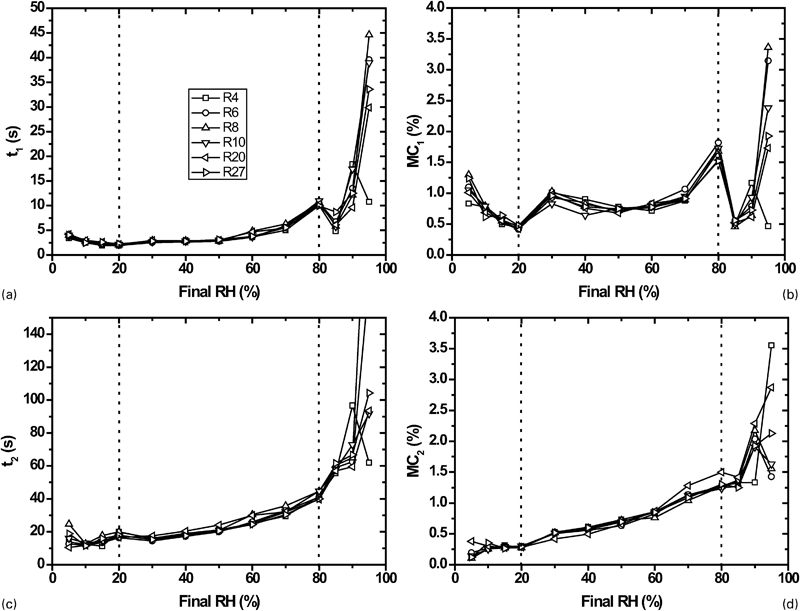
Variation in PEK parameters a t1, b MC1, c t2 and d MC2 for various aged earlywood rings of Sitka spruce, for adsorption of water vapour: variation is shown as function of final RH; dotted line shows where RH increments/decrements change from 5% steps to 10% steps
Results from the ANOVA (Table 1) show that after adjusting for RH there are significant differences in the kinetics parameter t1 between earlywood and latewood for both adsorption and desorption (p = 0·042 and p<0·001 respectively). There is also a significant difference in t2 between earlywood and latewood for desorption (p = 0·015), but there is no difference in MC1 and MC2 between earlywood and latewood. The characteristic time of the fast process is invariably larger for the latewood compared with the earlywood, which means that the sorption process is slightly slower for latewood compared with earlywood. Neimsuwan et al. (2008) also reported that in loblolly pine (Pinus taeda L.) the sorption rate of earlywood was greater than that of latewood. The results of the current study are also shown graphically in Fig. 5 for adsorption and Fig. 6 for desorption, where the averages and standard deviations for the earlywood and latewood samples of the rings are given at each of the RH values.
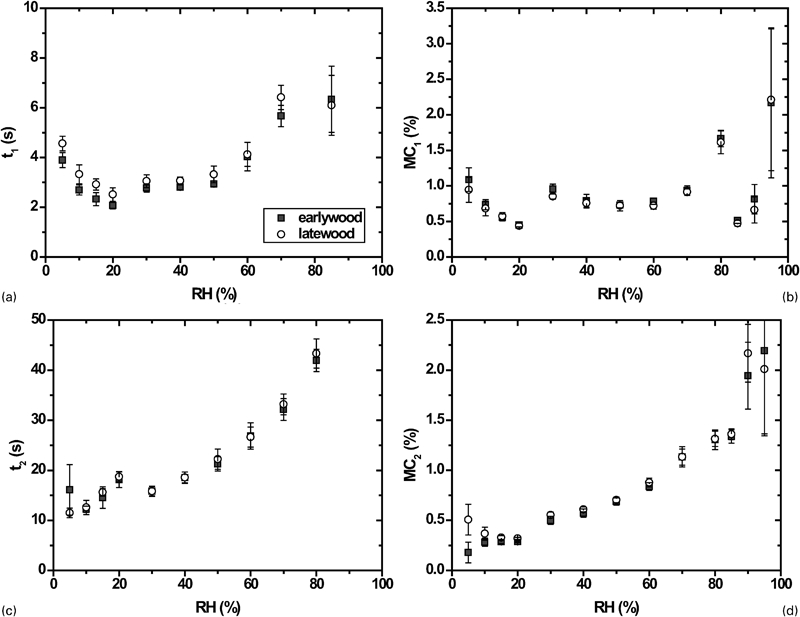
Variations in PEK parameters a t1, b MC1, c t2 and d MC2 averaged over different aged rings showing differences between earlywood and latewood, for adsorption of water vapour: variation is shown as function of final RH; only significant differences between earlywood and latewood are found for parameter t1
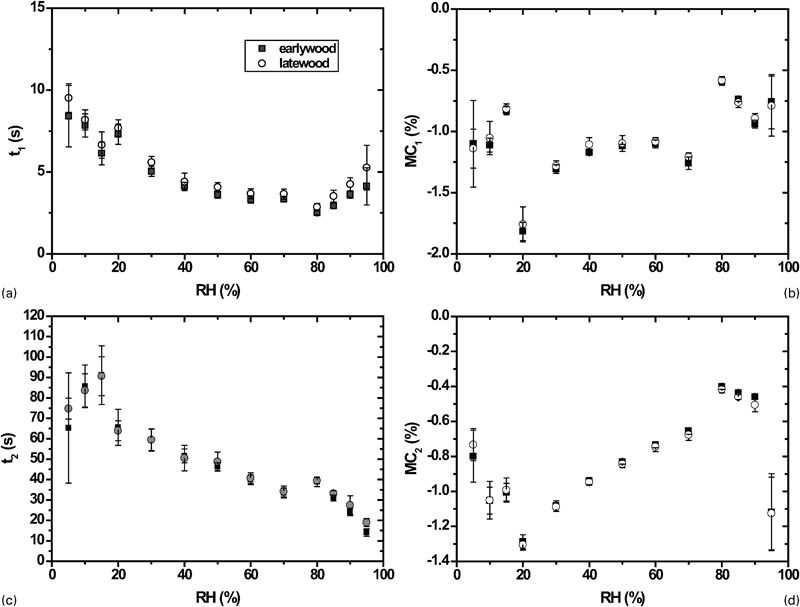
Variations in PEK parameters a t1, b MC1, c t2 and d MC2 averaged over different aged rings showing differences between earlywood and latewood, for desorption of water vapour: variation is shown as function of initial RH; significant differences between earlywood and latewood are found for parameter t1 for both adsorption and desorption, and t2 for desorption
Results from ANOVA to investigate intra- and inter-ring variation in sorption kinetics parameters*
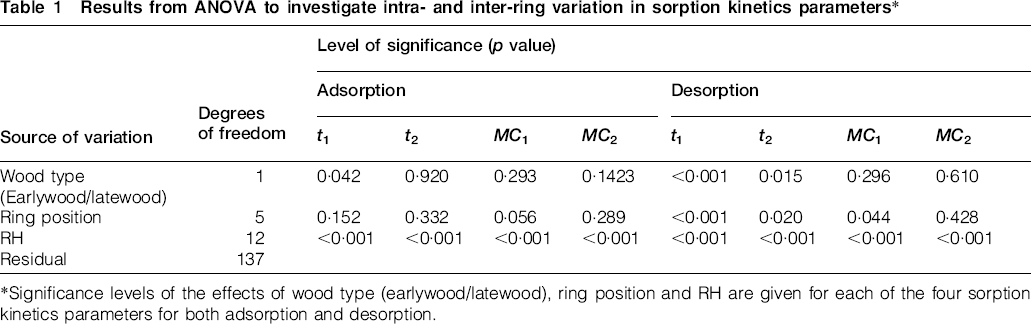
*Significance levels of the effects of wood type (earlywood/latewood), ring position and RH are given for each of the four sorption kinetics parameters for both adsorption and desorption.
There is also a trend in the kinetics parameters with radial position in the stem. In particular, differences in t1, t2 and MC1 between radial positions were found for desorption. Values for all three of these kinetics parameters are significantly higher in rings 20 and 27 than in rings 4 and 6. This result contrasts with that of Neimsuwan et al. (2008) who found that the adsorption rate of the outer rings of Pinus taeda was higher than that of the inner rings. However, given the differences in experimental conditions between these two sets of experiments, comparison is difficult. The need for further work of this nature is evident.
There are differences in behaviour between the adsorption and desorption processes. The t1 values for desorption (Fig. 6a) are larger than those for adsorption (Fig. 5a) and the trends in t1 and t2 are inverted between adsorption and desorption, in that the highest values for desorption are found at the lower end of the hygroscopic range, whereas the opposite is true for adsorption. This is also the case for mass changes under adsorption and desorption conditions. The inverted trend is readily apparent for changes in MC2, where under adsorption conditions, the highest mass changes are observed at the top end of the hygroscopic range (Fig. 5d) in contrast with Fig. 6d, where the higher mass changes are at the lower RH range (note the negative axes of Fig. 6b and d). The exception is the first desorption step (95–90%RH) for MC2, which shows a large decrement in moisture content, contrasting with the general trend of MC2 desorption data.
The PEK data were used as input into the Kelvin–Voigt model. Because there are two sorption processes (one fast and one slow) this means that the appropriate model is one where there are two Kelvin–Voigt elements operating in series. The results for cell wall modulus and viscosity for the adsorption and desorption processes associated with earlywood and latewood are shown in Fig. 7. Both the modulus and viscosity decrease with increasing RH (and hence cell wall moisture content) although there is an apparent anomaly at 20%RH, which is assumed to be associated with the step change in RH at this value, although this should theoretically be accounted for in the calculation procedure. It is recommended that future experiments to determine cell wall moisture kinetics use a constant RH step; a procedure that has now been adopted in this laboratory. The reduction in stiffness and viscosity with increasing cell wall moisture content is what would be expected as increasing levels of moisture in the cell wall plasticise the molecular components. At low cell wall moisture content, the E1 modulus (associated with the fast process) is of the order of 8–10 GPa and the E2 modulus around 10–20 GPa (with a very high E2 found with earlywood adsorption, but also with a high standard deviation). These values are consistent with values for cell wall moduli that have been reported in the literature, for example, Salmén (2001) reports values for the modulus of cellulose, hemicellulose and lignin of 135, 40 and 2 GPa respectively. Values for the modulus of the cell wall of spruce obtained using nanoindentation methods are in the order of 13–21 GPa (Wimmer et al. 1997; Gindl and Gupta 2002; Gindl and Schöberl 2004). It is apparent from inspection of Fig. 7a and b that the moduli associated with the adsorption process are higher than those associated with the desorption process, until the higher RH values are reached (for E2). Whether this observation can be related to any explanation for hysteresis is not clear at the present time, but it is perhaps pertinent to note that cell wall matrix stiffness has been invoked in a model for explaining hysteresis in cellulosic and lignocellulosic materials recently (Hill et al. 2009, 2010a,b). Cell wall moduli also decrease as the RH increases (Fig. 7a and b) which is already well known in the literature (Dinwoodie 2002).
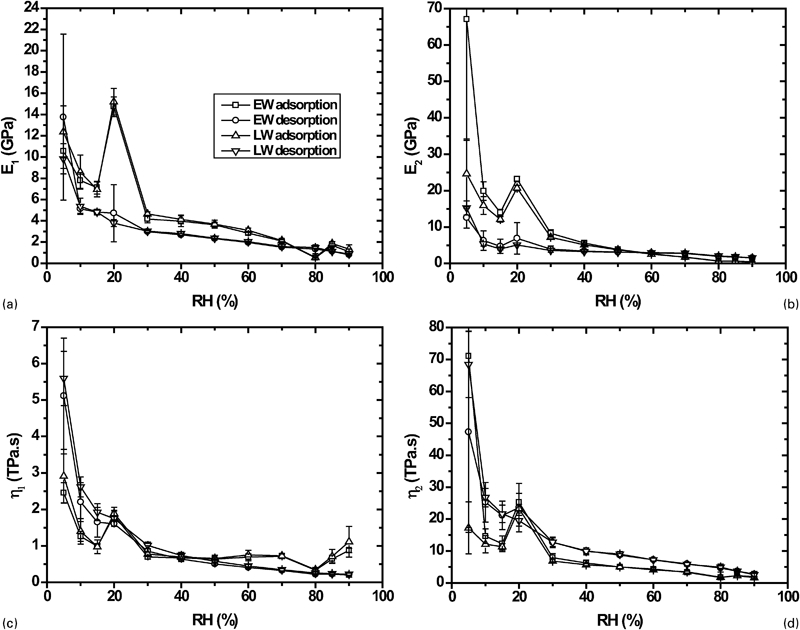
Variation in cell wall modulus and viscosity for fast and slow sorption kinetic processes under conditions of adsorption and desorption: increase noted at 20%RH is thought to be artefact caused by change in RH increments/decrements at that point
The calculated values for the cell wall viscosity is of the order of 2×10¹² Pa s for the fast process and ∼20×1012 Pa s for the slow process. Data on the cell wall viscosity of spruce are scarce in the published literature. One study of the creep behaviour of macroscopic spruce samples quotes viscosity values as high as 1013–1014 Pa s (Lagaňna et al. 2008), which is 1–2 orders of magnitude higher than the values calculated from the sorption kinetics data. However, the type of behaviour is quite different, since there is no applied load and creep effects are absent in the sorption experiments. The values calculated for the cell wall viscosities (given in terapascal seconds) also generally decrease as the RH rises (20%RH again being an exception). There is, however, an increase in η1 associated with adsorption above 80%RH. With η1 the cell wall viscosity associated with adsorption is lower than that associated with desorption below 40%RH, but the converse is true above this RH value. With η2 the viscosity associated with adsorption is lower at all RH values, if the data at 20%RH are discounted. It is not possible to discern any significant differences between earlywood and latewood in terms of cell wall stiffness or viscosity by this method. Work is continuing to further explore this interesting approach to water vapour sorption and cell wall mechanical behaviour.
Conclusions
The sorption behaviour of thin wood sections taken from different growth rings of the stemwood of Sitka spruce has been investigated. The sorption isotherms were found to be very similar, except at RH values in excess of 90% which may be attributable to capillary condensation effects. The sorption kinetics behaviour was analysed using the PEK model, with very good fits to the data being obtained. The applicability of the PEK model is explained as being due to the sorption behaviour being determined by the volumetric behaviour of the cell wall. Accordingly, the PEK model has been interpreted in terms of two series Kelvin–Voigt elements representing the viscoelastic behaviour of the wood cell wall. When this is done, values for the cell wall modulus are calculated as being ∼10 GPa at low cell wall moisture content for the fast process and ∼20 GPa at low cell wall moisture content for the slow process, corresponding values for cell wall viscosity of 2×10¹² Pa s (fast) and 20×1012 Pa s (slow) are found. These values appear to be reasonable, but confirmation using nanoindentation or atomic force microscopic techniques is required. As cell wall moisture content increases, both stiffness and viscosity decline. Differences in sorption kinetics behaviour were found between different aged growth rings and there was also a significant difference in the time constant for the fast process between earlywood and latewood, as well as between juvenile and mature wood. The interpretation of the PEK model in terms of cell wall viscoelasticity appears reasonable, but a physical interpretation of the fast and slow kinetic processes is still lacking. Work is progressing in establishing how the mechanical interpretation can be related to chemical composition and morphology of the cell wall.
Footnotes
Acknowledgements
Callum Hill would like to acknowledge the support of the Scottish Funding Council under the auspices of the Edinburgh Research Partnership in Engineering and Mathematics. Zaihan Jalaludin thanks the Ministry of Natural Resources and Environment of Malaysia for a PhD scholarship. Eike Mahrdt wishes to express his appreciation to the European Commission for a Leonardo Da Vinci training grant.