
Abstract
An important aspect in machine strength grading of timber is the direction of the grain and deviations from the main axis, which can cause a dramatic loss of strength. Therefore, an essential requirement of the wood industry is to find the direction of wood fibres in a fast and non-invasive way. For three decades now the use of polarised microwave radiation has been investigated, revealing the main direction of wood fibres in a non-contact and non-destructive way. The development of new small sized patch antennas now allows the detection of grain deviations on a local scale using a free microwave transmission method. This paper presents experimental results on accuracy and resolution for spruce specimens of different dimensions. Local signal variations, as well as boundary effects are discussed, particularly in view of possible industrial implementation.
Introduction
Grading machines are used to detect strength, stiffness and/or density of sawn timber. The development is guided by fast, reliable and precise methods for automated and non-destructive detection of parameters that are closely related to these properties. Methods successfully applied use X-rays, laser light, camera systems, longitudinal oscillation, and/or radio frequency scans (Bucur 2003). Up to now all these methods are not able to detect grain deviations in an adequate way.
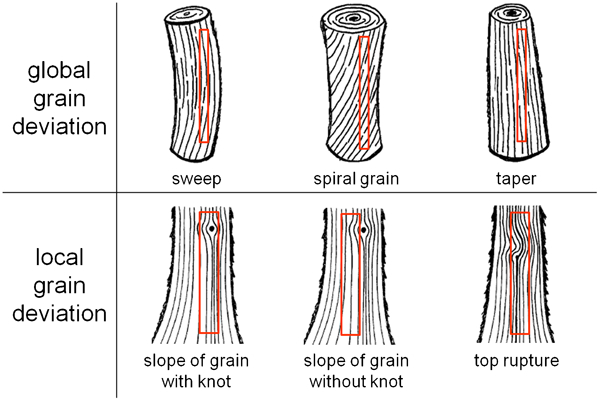
Grain deviations especially reduce the strength of sawn timber. They appear globally over the whole length or more locally over a limited length (Fig. 1). Bending, tensile, and compression strength decreases up to one-tenth of the original value when the slope of grain changes from 0° to 90° (Kollmann 1968). Sawn timber with these low strength values is unsuitable for construction and at the moment is sorted out visually during the grading process.
Grain deviations and their reasons
Industry is looking for alternatives to identify slope of grain by machine readings. This paper deals with a method to detect local and global slope of grain automatically, with the aim of developing a stable and highly educated machine grading principle. This is realised using a microwave technique. As the experience with microwave technology for measuring parameters in timber is limited, the functionality of this technology is here described including its mathematical solution.
The possibility of detecting local slope of grain in areas down to 25×25 mm is investigated. Up to now, most published information is on much larger areas, e.g. Schajer and Orhan (2005) or Bogosanovic et al. (2009). First experimental results deal with the accuracy of the method itself on the basis of small scale measurements within the width of the board. Additionally, the problem of edge diffraction within microwave measurements is here explained and discussed including possible solutions.
Literature review
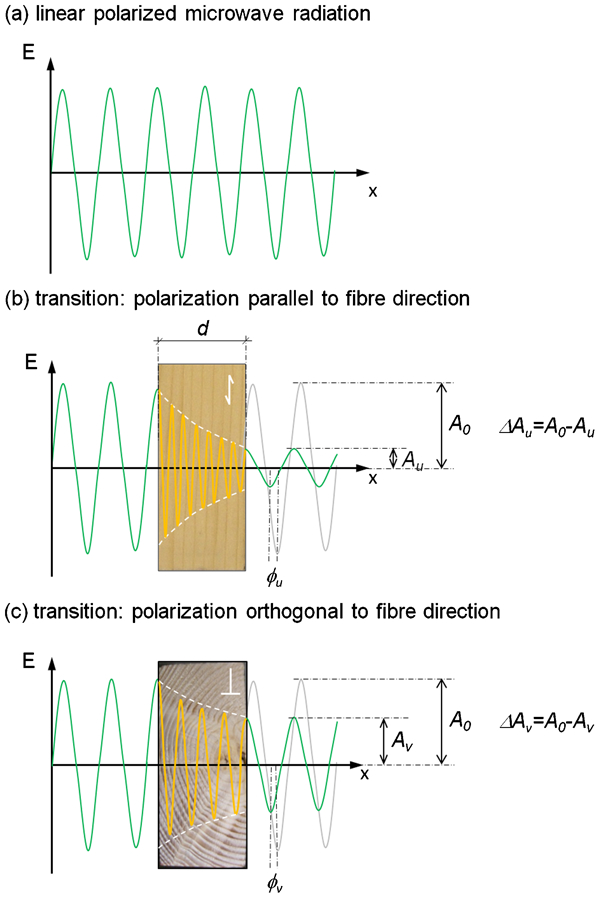
The knowledge of using microwaves for non-contact determination of slope of grain in timber has been known for some decades. During the transition of microwaves through wood some basic characteristics of the waves are changed (Torgovnikov 1993): attenuation and a phase shift take place. Owing to the anisotropy of wood, these changes are different along and across the grain. Typically, the attenuation along fibres ΔAu (Fig. 2b) is stronger than the attenuation across fibres ΔAv (Fig. 2c). Additionally, the phase difference φ changes differently along and across fibres compared to primary, undisturbed waves (Fig. 2a). In general, the electric field vector that is initially linearly polarised becomes elliptically polarised. These modifications can be measured and the complex transmission coefficients along (u) and across fibres (v), as well as the grain direction ϑ can be determined. Furthermore, the extraction of moisture content and density is possible (James et al. 1985; Orhan 2002; Nguyen et al. 2004; Schajer and Orhan 2005; Baradit et al. 2006; Lundgren 2007).
Transition of microwaves through wood (schematic)
First methods for determination of slope of grain, density and moisture content based upon microwave transmission have been predicted by Tiuri et al. (1979) and James et al. (1985). Sensor systems for transmission measurements have been constructed by Heikkila et al. (1982), Shen et al. (1994), Leicester et al. (1996) and Malik et al. (2005). Methods of microwave data analysis with respect to grain angle were developed by Schajer et al. (2005), Malik et al. (2005) and Bogosanovic et al. (2009).
At the moment, two techniques are most commonly used for non-contact microwave testing of wood. Based on free space transmission, the focused beam technique, using transmitting and receiving horn antennas and lenses is reported, e.g. by Malik et al. (2005). Second, the modulated scattering technique is used, enabling more local information along the wood surface. Density and moisture content (Johansson 2003; Lundgren 2007), as well as slope of grain (Leicester and Seath 1996) have been measured on local scales using the modulated scattering technique. A comprehensive overview of microwave non-contact measurement techniques is given by Bogosanovic et al. (2010).
Microwave unit used and its data analysis
Microwave unit
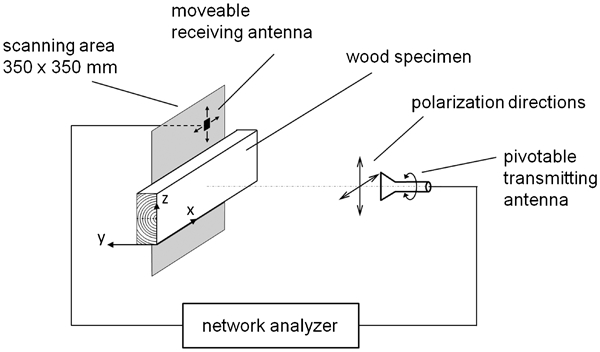
The microwave unit used was developed at the Vienna University of Technology by the Institute for Electrodynamics, Microwave and Circuit Engineering (EMCE). Main constituent parts are listed in Fig. 3. A horn antenna was mounted on a motorised rotary stage, which could be moved by 90° in between measurements in order to realise two orthogonal polarisation directions. Within a distance of 900 mm a self-built near field probe was mounted on two coupled linear axes, enabling the millimetre-wise scan of a 350×350 mm area. Data acquisition was performed with a standard commercially available network analyser. Free space transmission was realised on a local scale. The use of modulated scattering was supported by the development of a small sized patch antenna. Figure 4
Sketch of microwave unit
Grain direction and elliptical polarization
The resolution of microwave transmission is in principal limited by the wavelength. Higher frequency means lower wavelength, which means higher resolution. On the other hand, higher frequency leads to much higher cost and complexity during circuit design and engineering. A third and most important aspect during the conceptual design is the desired versus the technically possible signal-to-noise ratio. Thus, the chosen frequency of 12 GHz (wavelength of 25 mm) evolved as a compromise between the desired spatial resolution, technical and economical possibilities and the industry's need for high detection speed.
Background of data analysis
A linear polarised electromagnetic wave has a defined plane in which the electric field vector is oscillating. In contrast to air, wood has an orthotropic structure, leading to different damping and phase shift parallel and orthogonal to grains.
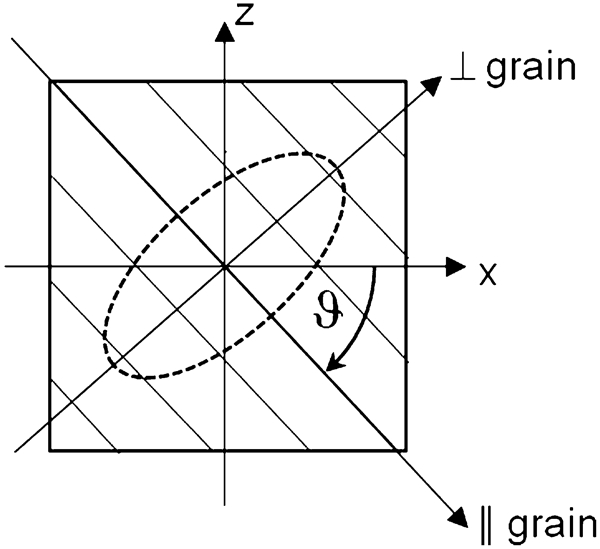
Testing the spatial distribution of damping and phase shift in timber is done using microwaves of two orthogonal planes of polarisation. The mathematical superposing of the resulting waves leads to an electric field vector which is rotating along an elliptic path (Fig. 4). The semi-minor axis of this ellipse is in line with the grain direction. Measuring the angular position of the ellipse results in the grain angle ϑ.
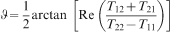
Mathematically speaking, the grain angle ϑ can be calculated with the help of equation (1)
First experimental results and discussion
General
In order to investigate the detection of slope of grain using microwave techniques, a limited number of specimens were measured in a first step. Spruce was chosen as the most common wood species used for construction in Europe. In total three specimens have been used to show the different influences. Table 1 summarizes the specimen dimension, moisture content and density and the use of each specimen.
Specimen overview
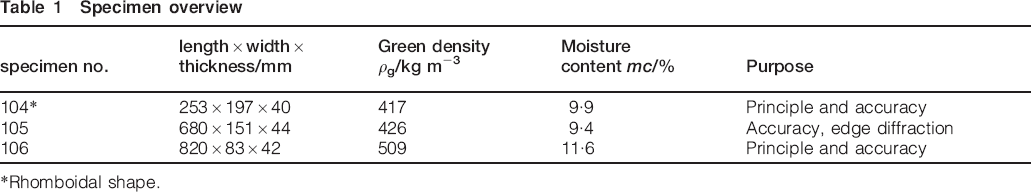
*Rhomboidal shape.
Measurements were performed at 12 GHz, corresponding to a wavelength of 25 mm or at 10 GHz, corresponding to a wavelength of 30 mm respectively. While the test specimen was at rest, the sensor was moved on a 25×25 mm or 30×30 mm grid corresponding to the wavelength in use. First, the empty field was measured for calibration. Afterwards, the specimen was mounted and scanned on the same grid positions as was performed with the empty field beforehand.
In the following, the grain angles ϑ were presented as arrows, and pictures taken of the specimen's surface were directly compared to the arrows on the measurement grid.
The results are structured in:
principal of grain angel detection
accuracy and variance of grain angle
influence of edge diffraction.
Principle of grain angle detection on a local basis
Figure 5 shows the comparison of grain angle calculated from microwave measurements to the grain angle visually available on the surface of the piece. Specimen no. 104 is a knot and defect free piece of spruce. It was cut to a rhomboidal shape with a tilt angle over the whole thickness of the specimen. The measurement had a frequency of 10 GHz and was performed on the corresponding grid of 30×30 mm.
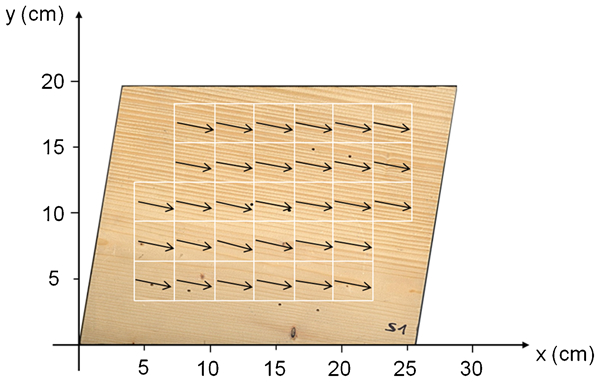
Results of specimen no. 104 measured at 10 GHz on grid of 30×30 mm
From the visual impression, the detected grain angle using microwave technology fits quite well to the distribution of grain direction indicated by the surface texture. In addition, the mathematical calculation of grain angle with the newly developed patch antenna seems to work satisfyingly and the local scale of 30×30 mm was implemented successfully.
Accuracy and variance of grain angle on a local basis
In order to get information on the accuracy of the grain angle, the same specimen was measured in three different grain angle positions: 0, −12·5 and −25·0° respectively. Table 2 compares expected and detected grain angle values in mean including standard deviation within the areas displayed in Fig. 6.
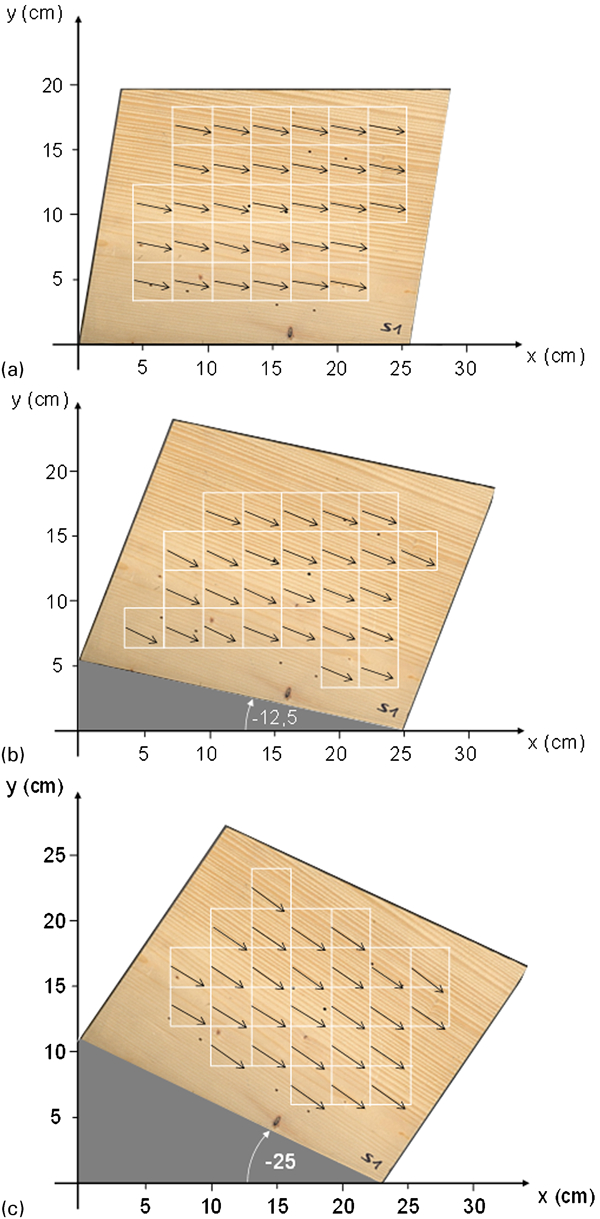
Results of specimen no. 104 at 10 GHz on grid of 30×30 mm
Results of specimen no. 104 corresponding to Fig. 6
Locally the results for ϑ vary by ±2°, whereas the mean values over all measured areas are in good concordance with the expected grain angles. The efficiency of measuring the grain angle via depolarisation of polarised microwave radiation is known to depend upon specimen thickness and moisture content (James et al. 1985). The thicker the specimen, the sharper is the dependency of depolarisation upon moisture content.
In principle small local differences in moisture content may have an influence on ϑ. Another reason could be small variations of grain directions actually present within the specimen. Along the surface, variations of grain direction of already ±1° are found using a scriber. However, since for machine strength grading a variation of ϑ by ±2° is rather small, a further analysis was abandoned.
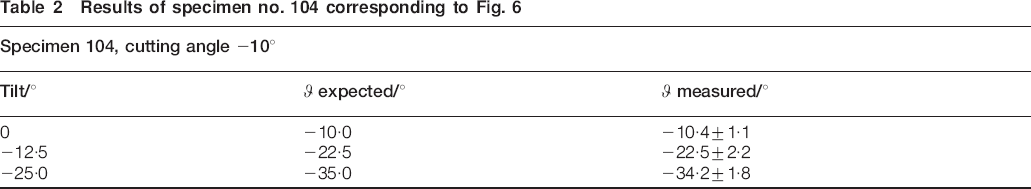
In the following, the effect of knots and local grain deviations on the microwave measurements is discussed. Specimen no. 105 had dimensions 680×151×44 mm and was affected by a tree top rupture including some knots in the same area. A tree top rupture is caused by the loss of the main shoot of a tree. The most powerful branch will take over the main shoot and will, therefore, change from a horizontal to a vertical position. Strong local grain deviations characterize this rather uncommon but severe defect of sawn timber with a corresponding dramatic loss of strength (Kollmann 1968). Figure. 7 compares the measurement results to the surface pictures. Front side (a) and mirrored back side (b) show that resulting grain angles do fit to the distribution of grain direction indicated by the surface texture. Large knots denoted on the end grain picture (c) cause large variations of attenuation and phase shift and disturb the results for grain angle.
Results of specimen no. 105 scanned at 12 GHz on 25×25 mm grid
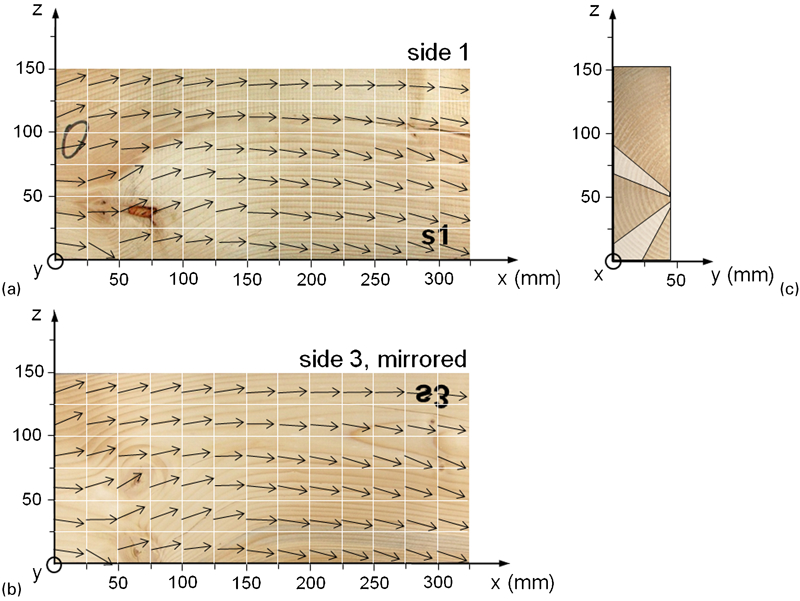
Specimen no. 106 was also affected by a top rupture within the width of the board, but knots were only small in this case. Two grid points were chosen in a vertical direction below and above the center axis respectively (Fig. 8). It has to be taken into account, that the microwave transmission method will always give a mean value of grain directions along its way through wood (direction y). Thus, surface patterns do not necessarily have to coincide with surface grain patterns. The deviations of specimen no. 106 are more obvious on side 1, and less developed on side 3. Resulting grain angles are in between the angles observed on the front and back surface.
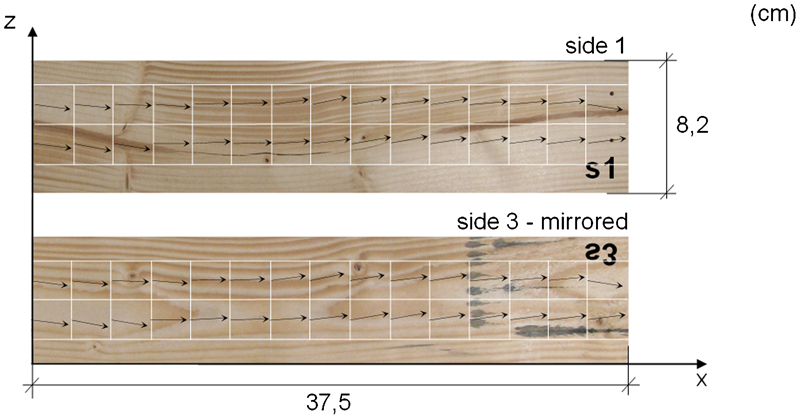
Results of specimen no. 106
The results show that slope of grain within the width of the board can be detected quite well using microwave techniques. The influence of moisture content and density on the grain angle measurement needs to be further developed. Knots do have an influence on local grain deviation and on microwave transition.
Influence of edge diffraction
When scanning a specimen as shown in Fig. 3, a strong disturbing effect will be found near the edges of specimens, leading to unreasonable values of grain angle ϑ. The reason is that part of the incident radiation will always ‘bypass’ the specimen via diffraction on the specimen's edge. Following a Huygens–Fresnel principle, the edge will act as a new source, irradiating into the ‘shadow-area’ behind the specimen (Fig. 9). Thus, a secondary signal superposes the signal that is transmitted straight through wood. This effect is hereafter called edge diffraction. A strong disturbing influence on signals is expected close to edges, which was also reported by Baradit et al. (2006). Thus, grain angles computed from signals near edges are not reliable and differ from real ones.
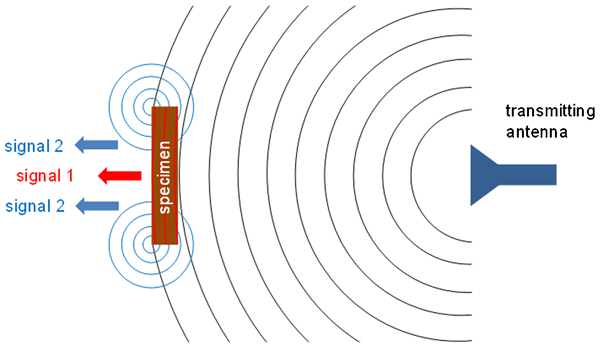
Scheme of edge diffraction on wood specimen
Being aware of this effect, in principle it should be possible to recompute grain angles and to remove the boundary effect. Scanning the edge diffraction of a specimen free of knots and defects with no grain deviation could be used to calibrate subsequent measurements. However, since the diffracted signal cannot be separated from the signal caused by transmission through wood, this kind of calibration would always ‘normalise’ the signals of the specimen at hand with respect to the different density and moisture content of a different specimen. This variability is characteristic for wood and is found locally within one piece (Baradit et al. 2006), as well as among different specimens (Bogosanovic et al. 2010).
Another approach is to extend the dimensions of the specimens using appropriate materials which continue the dielectric properties of wood across the edge of the specimen, thus placing the edge of diffraction at a further distance from the area of interest. The simplest choice is to use another piece of wood of the same species and comparable thickness, density and moisture content. All measurements described above are performed using large extension boards made of spruce.
In order to test the magnitude of edge diffraction, one area of specimen no. 105, free of knots and defects (see Fig. 7, position x = 170 mm) was scanned every 2 mm in minus z direction from the upper edge to the center of the specimen (z = 75 mm). Extension was varied from no extension to 80 mm and to 180 mm boards, attached to both sides of the specimen. Results of scanning raw data T11 of equation (2) are given in Fig. 10.
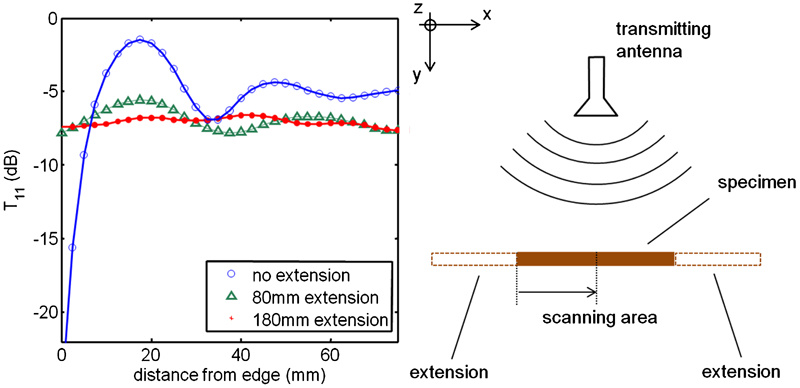
Signal T11 near specimen's edge, given in dB
Blue unfilled circles of Fig. 10 show T11 in dB without extension material: the blue line is a guide to the eye. A strong damping of −20 dB was found directly on the specimen's edge, followed by a periodic signal with decreasing amplitude towards the specimen's center. Indeed, this picture is very similar to the diffraction pattern found for laser light hitting a sharp metallic edge (see e.g. Born and Wolf 1999). For both laser light and microwaves, when an incident monochromatic electromagnetic wave is hitting an object, whose size is in the order of its wavelength, it causes diffraction. Extending the specimen with pieces of spruce of 80 mm in x-direction (green triangles and line) led to a similar, but much less distinctive pattern, since the diffracting edge was now at a further distance to the measurement area (see also sketch in Fig. 10). Extending the specimen with 180 mm boards of spruce, shown by red filled circles and line, in large part erased the effect of edge diffraction, revealing the signal created by transmission through the specimen under inspection.
Conclusion
The work at hand showed that local resolution of grain angles in wood using non-contact microwave transmission is feasible, and can be done on the basis of free space microwave transmission. Using a near field antenna and an adequate electromagnetic field correction, a local resolution in the range of the microwave's wavelength is possible, which in our case is 25×25 mm. Several specimens were used to test the reliability and reproducibility of measured grain angles. For specimens without knots and local grain irregularities, grain angle variations of ±2° were found, whereas a relative accuracy lower than 1° was found.
Knots cause strong variations in the results leading to random grain directions. This effect is stronger, if the knot size is in the order of the wavelength in use.
A strong diffraction effect was identified near the edges of specimens, similar to diffraction of laser light on micrometre-sized objects or slits. For the acquisition of undisturbed data during a transmission measurement, edges have to be shielded. A simple and effective extension material is another piece of sawn timber of adequate thickness and width.
With these findings, the use of microwave techniques to detect global and local slope of grain within a piece of timber automatically in the grading process, seems promising. A new way to improve machine strength grading is possible, which can help the wood industry to improve the reliability of their products.
Footnotes
Acknowledgements
This work was supported by the Austrian Research Promotion Agency - FFG and Wirtschaftsagentur Wien – ZIT within the COMET K-project ‘HFA-TiMBER A.1·3’, (project no. 820501). We also thank our project partners DOKA Group Austria, MiCROTEC s.r.l. and the institute EMCE of the Vienna University of Technology.