
Abstract
Studying structure and chemistry of wood and wood-based materials is the backbone of all wood research and many techniques are at hand to do so. A very valuable modality is X-ray computed tomography (CT), able to non-destructively probe the three-dimensional (3D) structure and composition. In this paper, we elaborate on the use of Nanowood, a flexible multi-resolution X-ray CT set-up developed at UGCT, the Ghent University Centre for X-ray Tomography. The technique has been used successfully in many different fields of wood science. It is illustrated how 3D structural and microdensitometrical data can be obtained using different scan set-ups and protocols. Its potential for the analysis of modified wood is exemplified, e.g. for the assessment of wood treated with hydrophobing agents, localisation of modification agents, pathway analysis related to functional tissues, dimensional changes due to thermal treatment, etc. Furthermore, monitoring of transient processes is a promising field of activity too.
Keywords
Introduction
Many techniques are at hand to investigate wood properties, ranging from very simple methods for point measurements down to in-depth three-dimensional (3D) characterisation. Most of these are either limited to surface or sub-surface examination and/or destructive in nature. A very powerful addition to the existing modalities is X-ray computed tomography (CT). Tomography is an extension of radiography, i.e. the recording of a shadow image of an optically opaque object using penetrating radiation and a recording medium. For a detailed history of tomography one can read Webb (1990). The purpose of tomography is to obtain a 3D representation of the composition and morphology of the object in a non-destructive way. Basically the 3D object under study is reconstructed based on a set of two-dimensional projections (radiographies) taken from different angles by rotating the sample around a defined axis. In the case of X-ray tomography, X-rays are used as a probe to study objects. X-rays typically have a wavelength below 10 nm and they are attenuated less easily than electrons and visible light. More importantly, their penetrating power is largely dependent on their energy, which is directly related to their wavelength, making it possible to adjust the energy of the source to the type of sample under investigation, depending on size, composition, etc. (Vlassenbroeck 2009). Furthermore, the ability to extract the chemical and densitometric properties of an object from X-ray projections is therefore related to the nature of the interactions between the radiation and the material. These interactions are heavily dependent on the density and composition of the material, allowing to use the transmitted radiation to reveal these properties. Over the years the resolution of CT imaging systems has steadily improved, owing to the significant progress both in hard- and software. Current state-of-the art lab-based systems are clearly coming of age. Depending on the resolutions required, different manufacturers deliver different systems for non-medical purposes. In addition to the commercially available systems, many research groups build their own scanners for specific research purposes, differing in the type of material that has to be scanned, the required specimen size, energy level, etc. X-ray tomography has become a well-established technique and its multi-purpose use is widely recognised in wood science and technology. The number of papers with focus on lab-based X-ray tomography for fundamental research as well as its use as a tool for structural analysis is steadily increasing. A selection of different topics for which lab-based X-ray tomography can be used, shows the versatile employability in both static as well as dynamic experimental set-ups: wood anatomy (e.g. Van den Bulcke et al. 2008; 2009a), structural wood vessel analysis (e.g. Hass et al. 2010; Brodersen et al. 2011), moisture dynamics (e.g. Lazarescu et al. 2010; Derome et al. 2011), analysis on from wood derived materials (e.g. Faessel et al. 2005; Walther 2006; Walther and Thoemen 2009), etc. The non-destructive internal probing of a material at different scales, ranging from macroscopic down to microscopic level, is a significant advantage. Moreover, owing to the non-destructive nature of the scanning process, one can monitor and quantify any time-dependent process such as structural changes owing to modification, fungal growth, water movement, weathering processes, etc. Such a technique can, therefore, play an important role in the characterisation of modified wood products. Wood modification has been a field of research for over a century (Rowell 2006; Esteves and Pereira 2009), covering a large range of methods that can be either chemical or thermal, or a combination of both, aiming at an improvement of wood properties. The general awareness of limited natural wood resources as well as an increasing use of domestic, less durable wood species, has been a trigger for a recent increased interest in wood modification. Modifying wood mainly aims at improving resistance against physical weathering and biological degradation by changing its chemistry and/or structure. By doing so there is a measurable change of the basic wood characteristics such as strength, colour, texture, structure, chemical composition, etc. It is essential to map these property changes before and after treatment to assess both the level of change and the effective resistance to allow for a proper dose-response interpretation of the treatment. Furthermore, the results could be suitable as quality indicator for the treatment. X-ray tomography can be the pre-eminent technique to do so.
This paper elaborates on the wide range of possibilities of X-ray tomography as a tool for advanced static and dynamic analysis for wood research in general and more specifically on modified wood in its broadest sense. Examples on unmodified wood are presented too, yet all concepts and approaches discussed here are considered transferable to and most useful in the field of wood modification.
Experimental methods
The scanner used at Woodlab-UGent, further referred to as Nanowood, is developed at UGCT, the Ghent University Centre for X-ray Tomography (www.ugct.ugent.be). The scanner is similar to the one as described in Masschaele et al. (2007) and used in Van den Bulcke et al. (2009c; 2011a; 2011b; 2012) and consists of two X-ray tubes and two X-ray detectors, specifically designed to obtain very high resolution scans as well as scans of larger objects. The system offers a large range of operational freedom, all combined in versatile acquisition routines (standard or fast, tiling, helix, etc.). It has a generic in-house developed CT scanner control software platform (Dierick et al. 2010) that allows full control of the scanner hardware. Reconstruction of the scans is performed with Octopus, a tomography reconstruction package for parallel, cone-beam and helical geometry (Vlassenbroeck et al. 2007) and includes phase-retrieval and correction algorithms (Paganin et al. 2002; Groso et al. 2006; De Witte et al. 2009). As the system can be used in many fields of wood research, several examples of scans performed with Nanowood are given on different types of materials, including different sizes of wood specimens, wood cores, plywood, etc.
Results and discussion
High resolution X-ray tomography can contribute considerably to research and development in wood science and technology in general and wood modification more specifically. Depending on the mode of action of the treatment, structural and/or chemical changes are under investigation on different levels. Treatability aspects are valid when comparing wood species (e.g. the role of refractory wood species or heartwood zones) and when discussing the modification processes for engineered wood products and wood based panels. Main interest is however in assessing both qualitatively and quantitatively the impact of different parameters on the modified product as well as characterisation in relation to performance. In this respect, four focus areas can be identified: treatment level, dimensional stability, biological durability and wood anatomical changes. These are discussed and exemplified below in a framework of both static and dynamic tomography.
Static tomography
Straightforward analysis focuses on the visualisation and qualitative investigation of modified wood at different spatial scales. Owing to the flexible set-up of the scanner, various sample sizes and resolutions can be obtained, enabling broad distribution patterns of modification throughout blocks of treated wood as well as probing the modification down to the cell wall level. The system is capable of scanning samples of 37 cm in diameter and a maximal length of approximately 20 cm with a resolution of 0·2 mm down to approximately 400 nm for objects that have about the size of a splinter. Scan times range from several minutes up to several hours depending on the required quality and resolution. One is always confronted with a trade-off between the signal-to-noise ratio and necessity of stability during scanning, as such scan settings (source–detector distance, source–object distance, tube power, exposure time, #projections, etc.) are attuned to the research question at hand. A multi-resolution top–down approach for tomographic wood microscopy (Mannes et al. 2010) is exemplified for an untreated wood species, ipé (Tabebuia spp.), at different scales. This is illustrated in Fig. 1 using a cross-section of the scanned volumes. These images were taken with standard cone-beam tomography. For very high resolution scans, such as the rightmost image of Fig. 1, phase contrast must be taken into account. Although conventional tomography is based on the attenuation of X-rays, both the amplitude and phase change when passing through an object. At very high resolution this effect is visible and can, in some cases, be beneficial to visualise small details, yet often the mixture of phase and amplitude hampers proper processing. To mitigate this effect, phase contrast filtering is often applied (Boone et al. 2009; De Witte et al. 2009; Wernersson et al. 2013).
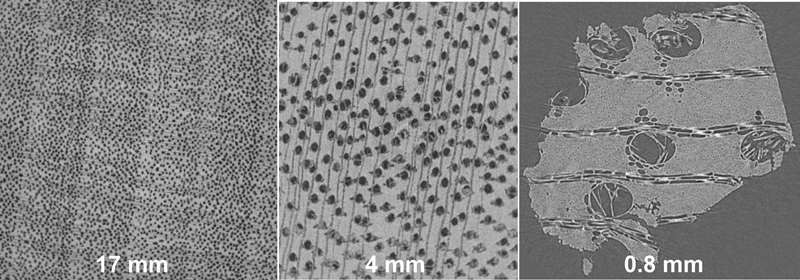
Cross-sections of Tabebuia spp. at different scales (length of image given below each image)
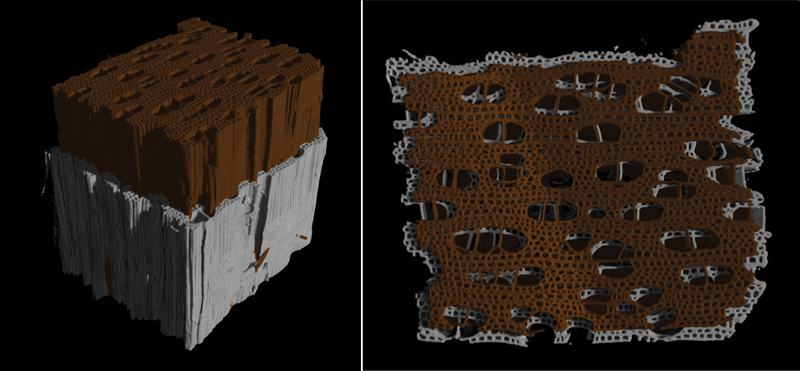
Structural analysis allows for analysis of treatability as can be deduced from the work of Svedström et al. (2012) on aspen and a series of examples given by Van den Bulcke et al. (2009a). The image processing chain is illustrated in Fig. 2 for labelling of the vessel lumina of oak (Quercus spp.). Although only a single cross-section is shown, all algorithms run in three dimensions as shown in the resulting 3D rendering in Fig. 3a. Similar results could be obtained with images acquired with standard light microscopy, SEM or another technique, yet these are mostly limited to visualisation of the (sub-)surface while internal features can only be revealed through sectioning or any other process of material removal, possibly creating artefacts as well. X-ray tomography on the other hand enables a one-to-one analysis of a sample before and after treatment in three dimensions, as such not limited to the surface. All analyses are performed with the in-house developed software package Morpho+, containing an extensive set of high-performance 3D operations to obtain object segmentation, separation, and parameterisation or to extract a 3D geometrical representation for further modelling (Brabant et al. 2011). First the original volume is pre-processed, applying bilateral filtering to remove noise without extensive smoothing, i.e. in order to keep sharp transitions such as edges. In a second step the optimal threshold level is chosen to segment vessel lumina. The latter can be used to map different objects and label them separately. Subsequently, a distance transformation can be calculated to classify objects according to their size, shape, etc. and to separate them optimally when connected. The final result of such a process is given in Fig. 3a, showing a 3D image of the labelled vessel lumina of the oak sample under investigation. Figure 3b is an example of fibre labelling on aspen (Populus tremula). The same principle is of course feasible for treated wood. Treating chemicals or derived polymers can be present mainly in the cell lumen or cell wall penetration can be envisaged.
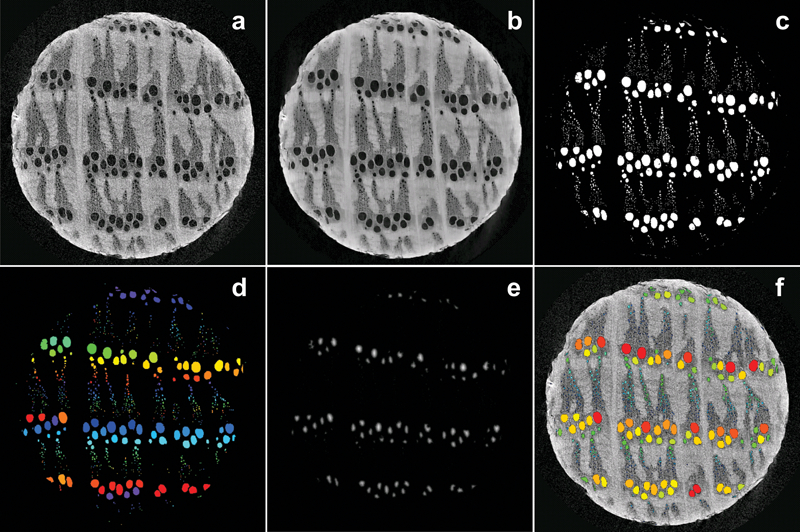
Vessel segmentation and labelling in oak: a original, b bilateral filtered, c thresholded vessel lumina, d labelled vessel lumina, e distance transform, f overlay of size-labelled vessel lumina on the original cross-section (diameter of sample approximately 12 mm)
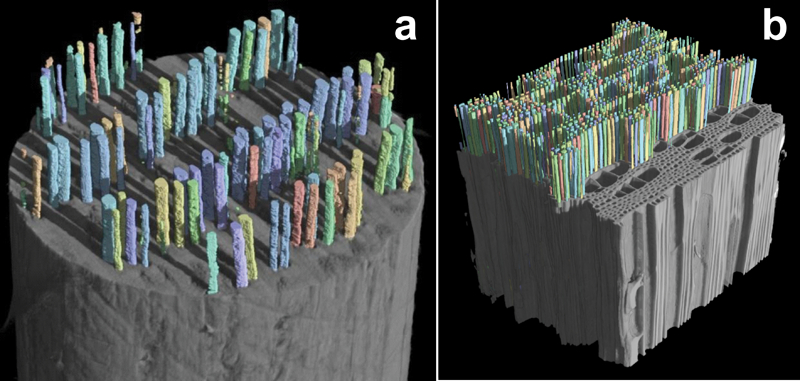
Vessel lumina segmentation in oak (a diameter approximately 12 mm) and fibre foc lumina segmentation in aspen (b cross-sectional dimensions approximately 0·4×0·5 mm)
Anatomical pathways primarily consist of axial tissues such as vessels in hardwoods or earlywood tracheids in softwoods, but complementary involvement of ray pathways is required to obtain adequate distributions. Additionally it is relevant to check on envelope or matrix treatment by assessing treatment gradients linked to treatment level for products like resins, oils, coatings and even for hydrophobation agents like siloxanes.
Chemical distribution is elaborated on in the paper of De Vetter et al. (2006), describing the use of X-ray tomography for the distribution analysis of organosilicon compounds in wood. Scholz and co-workers (2010a) explore the impregnation of waxes related to the anatomy of Scots pine sapwood (Pinus sylvestris) and beech (Fagus sylvatica) complementary to SEM. This kind of top-down approach gives the opportunity to investigate the structure in depth in a fast and non-destructive way, offering the possibility to combine with other analysis if necessary. Especially the latter one-on-one relation is highly important to anticipate the inherent biological variability. Similarly, the follow-up research of Scholz and co-workers (2010b) uses X-ray tomography for quantification of the pore size and wax distribution, with comparison of these results with other techniques, showing the complementarity of non-destructive tomography. Also, Kucerova (2012) illustrates the use of X-ray tomography to measure the penetration of consolidant solutions into wood and Ahmed and co-authors (2013a; 2013b) show the potential of CT scanning for studying preservative distribution in thermally modified wood.
An example of resin deposits on the walls of Scots pine sapwood tracheids is given in Fig. 4a. The wood was treated with an aqueous solution of a methylolated melamine formaldehyde resin, cured in a laboratory oven. The aim of this investigation was to localise the cured resin droplets and assess how the specific anatomy of a wood species influences the impregnation behaviour. Visualisation and analysis of coatings can also be considered as a form of surface modification, resulting in full structural characterisation (Van den Bulcke et al. 2010). Figure 4b illustrates the visualisation of an opaque coating on Scots pine.
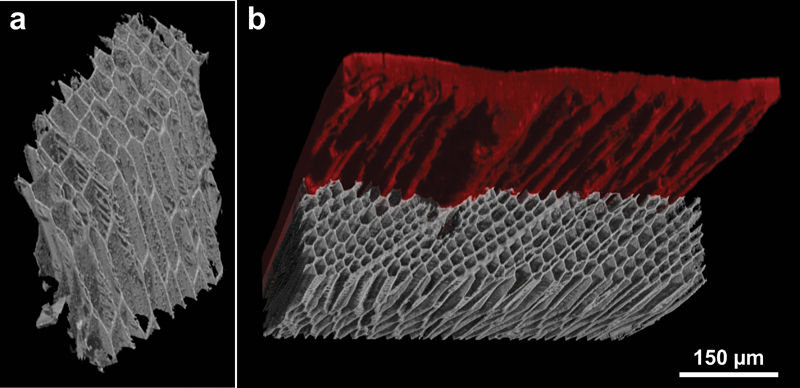
Resin deposits on Scots pine tracheid walls (a longest edge of volume approximately 0·25 mm) and an opaque coating (red) on Scots pine (b). For the latter the wood is virtually removed to illustrate the rough penetration profile of the coating in the tracheids
Assessment of dimensional stability is mainly linked to a dynamic analysis however differential scanning can allow verification of bulking effects of e.g. acetylation on specific parts of wood and the refractory nature preventing chemical penetration, e.g. poor treatment of Scots pine heartwood. As Boonstra and co-authors (2006) illustrated it can be useful to check the wood anatomical alterations of modified wood. Treating processes to obtain thermally modified timber (TMT) products can initiate collapse or related features that can be quantified on anatomical structure level.
More advanced analysis includes connectivity before and after treatment, e.g. for fungal pathway analysis as illustrated in Van den Bulcke et al. (2008). High-resolution imaging of penetration routes in oak, beech, bamboo, etc. are under investigation as well as glue barrier analysis. This enables verification of non-toxic treatments allowing fungi to grow into the wood matrix however without inducing rot. Pathway analysis was also developed by Hass and co-authors (2012) to study adhesive penetration in wood using synchrotron-based tomography.
All above-mentioned analyses derive quantitative structural information from the volumes but without the use of the data resulting from the underlying principle of a direct relation between greyscale and density. Although this relation is not straightforward and depending on the chemical composition as well, there is an opportunity of extracting densitometrical data from these volumes for wood as composition in most cases can be considered more or less constant. Briefly, the basic principle relies on the use of a reference material with a density approximating cell wall density and recalculating all 16 bit greyscale values accordingly. As such the scanned 3D volume is converted to actual densities. More information on the methodology and validation of the technique can be found in the paper by De Ridder and co-workers (2011), using helical X-ray tomography on limba (Terminalia superba) wood cores. Helical tomography is similar to standard cone-beam tomography, but instead of a circular movement, the sample describes a helical trajectory. Helical tomography has several advantages, especially when scanning elongated objects such as wood cores, but comes with a higher mechanical and mathematical complexity; reconstruction is based on the Katsevich algorithm (De Witte 2010). Helix scanning is used complementary to cone beam scanning enabling gradient analysis over cross-sections of trees (Van den Bulcke et al. 2012) and this can be used for verification of microdensitometric differences as a result of modification processes. An example to illustrate this potential is given in Fig. 5 for non-modified limba and Scots pine. It should be noted that the one-dimensional profile given is an average of each cross-sectional slice taken in radial direction, i.e. the density is derived from actual 3D density data.
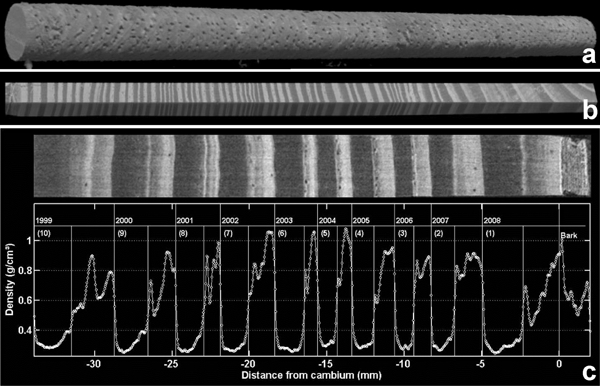
3D volume of a core of limba (a diameter of core approximately 5 mm) and of Scots pine (b cross-section approximately 3×3 mm) and corresponding microdensitometrical profile with ring width and age (c)
A similar principle can be used in the field of wood modification, when evaluating density changes of treatment, visualisation and assessment of moisture, etc. by either sub-sampling of core-like samples of larger material, region of interest scanning or by tomography of the entire specimen if small enough.
Time lapse and dynamic tomography
Time lapse tomography is the analysis of the same sample at different times, such as the analysis of density changes during fungal attack (Van den Bulcke et al. 2011a), high-resolution fungal growth monitoring (Van den Bulcke et al. 2009b), etc. In fact, the analysis of the effect of thermal treatment can be considered an example of time lapse tomography, when the same sample is scanned before and after treatment. An example of such possible changes is given in Fig. 6 illustrating the shrinkage of thermally treated aspen. The treatment was carried out in a device made by the Danish company Wood Treatment Technology (WTT). Samples were placed in an autoclave and subjected to a specific thermal treatment consisting of three main stages: (1) temperature increases up to the modification temperature (160°C); (2) holding at the modification temperature (1 h); and (3) cooling. In the course of the process, as the water evaporated at a rate dependent on the treatment temperature in the chamber, the pressure increased, reaching 5–9 bars. For more information, the reader is referred to Biziks et al. (2013).
Aspen before (greyish) and after (brownish) thermal treatment (cross-section approximately 0·4×0·5 mm)
Quantification of change in porosity, even on tissue level, can help interpreting the treatment process. 3D image registration can also map the actual shrinkage of the sample on a voxel-by-voxel basis, as such also inferring on the stress–strain fields. The work of Forsberg and co-authors (2008; 2010) is pioneering in that respect.
Furthermore time lapse tomography is key when analysing the impact of water and moisture content both related to dimensional changes and time of wetness (ToW) analysis. An example of combining moisture monitoring using a continuous moisture monitoring approach (Van den Bulcke et al. 2009c) and the effect of weathering thereon is given in the paper by Van den Bulcke and co-workers (2011b). Analysis revealed glue cracking and as such some plywood samples reached high moisture contents.
Dynamic tomography on the other hand refers to the actual monitoring of a dynamic process during scanning. For very fast processes (<1 min), full tomographical scanning is currently difficult if not performed at synchrotron facilities. Synchrotron radiation has some unique properties, making it highly suitable for X-ray imaging. Since its high flux is concentrated into a cone beam with an extremely narrow opening angle, originating from a very small source area, imaging can be performed far away from the source and at very high speed, therefore ideal for dynamic tomography, such as is elaborated on in the papers by Derome et al. (2011) for the hysteretic behaviour of wood and Zauner et al. (2012) for the observation of plastic deformation of uniaxially compressed Norway spruce samples. Radiographies, however, can also be useful. Figure 7a shows an example of a set-up for contact angle measurement and water penetration in a sample of medium density fibreboard. Through image processing, only the water is made visible and penetration can be followed over time. For processes that are slower than 1 min or for which a high image quality is not required, full 3D analysis of a time-dependent phenomenon is feasible. Figure 7b illustrates the penetration of water in plywood veneers. Water penetration was monitored for several hours and separated from the plywood by image processing.
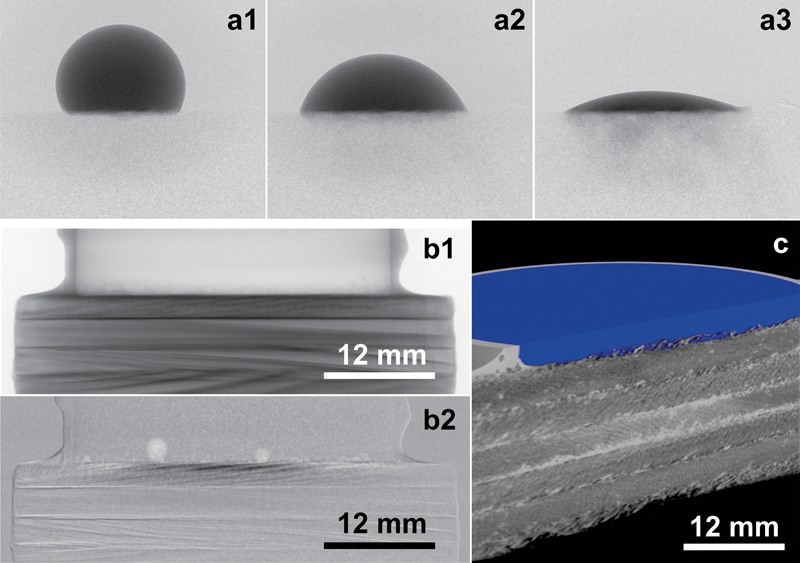
Water droplet penetration in an MDF (Medium Density Fibreboard) panel (a1 to a3); penetration of water in plywood in 2D: b1 illustrates the cylinder containing the water on top of the plywood panel (darker lines = glue) and b2 illustrates the visualisation of the water in the first veneer; a 3D version of water penetration (blue) in the first veneer of plywood is shown in (c)
Currently, faster scanning protocols are developed that will enable full tomographical scans at high-resolution in less than a minute to follow dynamic processes in 3D. Such fast scanning is also beneficial when working with living biological tissue in which stress and possibly damage due to radiation have to be reduced to the minimum (Van den Bulcke et al. 2009b). Clearly, implementation at lab-based systems is a continuing task.
Conclusions
The use of high-resolution X-ray computed tomography in wood science is increasing considerably. Early research with this technique was mainly focusing on its applicability as an advanced imaging tool to reveal the internal structure non-destructively, but in the last decade the wood science community has discovered it as a modality for quantitative research, not the least owing to the significant progress in hardware, the massive computational resources available and the commercial availability of user-friendly table-top systems. Wood is especially challenging because of its hierarchical nature, demanding a multi-scale approach with regard to 3D imaging. The enormous potential of flexible X-ray tomography scanners such as Nanowood can result in fast 3D characterisation of the same material before and after treatment for modified wood, following dynamic processes with time-lapse scanning, etc. leading to new insights and improved treatment procedures. The abovementioned examples represent only a small part from a long list of possible experimental set-ups and scanning techniques and this is expected to increase substantially in the near future. Together with other equipment for semi- to non-destructive testing, it offers wood research with the possibility to go beyond current state-of-the-art. New scanning set-ups such as dual-energy and phase-contrast, as well as reconstruction algorithms such as the family of iterative techniques, will lead to faster scanning and faster and improved reconstruction and visualisation of different, difficult to follow and to discern phenomena and phases. Furthermore, the hierarchical nature of wood necessitates its study on different spatial scales. Additionally, a phenomena emerging on a high resolution have an impact on all other resolutions. Thus multi-resolution imaging of a complex material such as wood in general, and modified wood and wood products more specifically, is one of the major challenges.
Footnotes
Acknowledgements
The authors greatly acknowledge all colleagues at Woodlab-UGent and UGCT for their continuing effort in testing and improving the wide variety of experiments and scanners, as well as all international colleagues for fruitful discussion and collaboration to challenge boundaries within X-ray CT wood based research. The Special Research Fund of the Ghent University is acknowledged for the doctoral grant to Loes Brabant.
This equipment was obtained through the project SimForTree of IWT Flanders (Strategic Basic Research – SBO 060032) and is available for research under the conditions established in general by UGCT and also accessible under the EU Infrastructure project Trees4Future as Transnational Access equipment (Project no. 284181).
© All pictures are property of UGCT and/or WOODLAB (or mentioned otherwise). It is not allowed to use them without permission.