
Abstract
Western hemlock (Tsuga heterophylla), was dried using two different schedules with optional conditioning and seven day post-drying equalisation in a covered and climate controlled space that emulates outdoor conditions in south-central Japan from October to May. Timber quality was evaluated pre- and post-drying, and/or post-equilibration. Drying times, moisture content variation between and within timbers and internal stresses were also assessed. Data analysis revealed that conditioning and aggressive drying reduced casehardening, while milder drying resulted in less twist and diamonding. Although the control run seemed to develop less shape distortions than the treatments, it required longer drying times. With aggressive drying the kiln turnover will be quicker and the dried timber might be stored in a covered area for post-drying equalisation that will level out moisture gradients and alleviate casehardening. As a subsequent step, the timber might be planed to reduce twist, diamonding and superficial checks.
Keywords
Introduction
Western hemlock (Tsuga heterophylla) is one of the most abundant species along the coast of British Columbia. Hemlock is challenging to dry because quite often it contains heartwood pockets of very high moisture content and low permeability commonly called ‘wetwood’. Furthermore, hemlock can exhibit a large spread of green moisture content and basic density that could result in large moisture content variance after kiln drying often accompanied by collapse and internal checking (Krahmer and Cotê 1963; Comstock 1965; Kozlik 1970; Bramhall and Willson 1971; Kozlik 1981; Chafe 1981; Mackay and Oliveira 1989; Simpson 1991; Warren 1991; Zhang et al. 1996). These problems are augmented when thick hemlock timbers (90 to 115 mm in thickness) destined for the Japanese housing market are kiln dried.
One way to improve timber quality and shorten kiln residence times is to modify drying schedules by changing their aggressiveness. That change accompanied by a high humidity conditioning step at the end is expected to significantly level out moisture differences between shell-and-core areas and relieve internal stresses (casehardening). Fuller (1995) found that surface stresses reached a maximum value with the gain of moisture during this step and then the stresses dropped close to zero (Avramidis and Mackay 1988). Fuller (1999, 2000a, 2000b) also reported that the drying rate along with the length of the conditioning step strongly influence the degree of casehardening reduction in timbers. The latter has to be stopped in time because over-conditioning may result in reverse casehardening which is a permanent condition (Simpson 1991).
In Japan, some companies store stickered timber outdoors after drying for a period of seven to twelve days. During this time, the moisture content gradient within each piece normalises (differential between core and shell) and thus internal stresses tend to dissipate. In a focused study (Wallace et al. 2003), hemlock baby-squares (105×105 mm in cross-section) stored in a climate chamber set to Tokyo winter conditions for 14 weeks after kiln drying to 19% moisture content with shape distortions that would be considered acceptable when taking into account natural wood variability, exhibited no significant crook or twist changes after conditioning and during post-drying equilibration (PDE). The shell moisture content acclimatised to the new equilibrium moisture content very quickly, while the core one needed more time to reach the new equilibrium.
There is a conspicuous absence of information regarding kiln drying/conditioning and thereafter outdoor equilibration including their interactions. This study investigated the effect of drying schedule aggressiveness and post-drying treatments such as the inclusion of conditioning and further PDE on the conventional kiln drying quality of second-growth western hemlock baby-squares destined for export to Japan.
Experimental method
Ninety-six freshly cut green timbers of second growth western hemlock about 4 m long and 116×116 mm in cross-section (baby-squares), with a grade of standard or better were obtained from a local sawmill. Each timber was cut into four 900 mm kiln specimens and five 25 mm sections (Fig. 1). The sections were measured for basic density (oven-dry weight divided by moist volume) and initial moisture content according to the methodology described in Kollmann (1955), Skaar (1972) and Forest Products Laboratory (1999). The value of the sections located at the ends of each specimen was averaged to obtain the initial moisture content (Mi) and basic density (BDi) of that specimen.
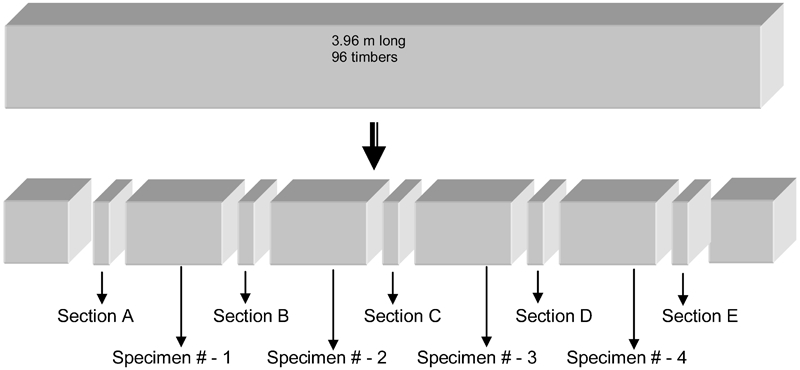
Cutting pattern for green timbers for making kiln drying specimens and sections
Nine kiln loads comprised of 42 specimens each were formed using a computer program written especially to arbitrarily pick the kiln specimens out of the total population by randomly selecting specimens and comparing the resulting standard deviations for moisture content and density.
The quality of all kiln specimens before drying was assessed by recording all surface checks for length and maximum width (no internal checks were observed from the initial timber cutting), as well as twist and diamonding measured at the same end of each specimen using an aluminium table calibrated for straightness and flatness and with a high accuracy digital dial gauge as described in Hao and Avramidis (2004). Upon completion of the green assessment, both ends of all specimens were coated with polyvinyl acetate to prevent moisture loss during kiln drying thus emulating the drying of full length timbers in a commercial kiln.
A 0·7 m3 wood capacity electrically heated aluminium laboratory kiln (Rohrbach 2008) was used to dry the stickered specimens at about 2·5 m s−1 air velocity. A drying schedule specifically developed for hemlock baby-squares was used as the ‘control’ (Hao and Avramidis 2004, 2006). It consists of 10 steps; the first eight with a fixed time-length (Table 1) whereas the ninth, moisture based one, where air temperature and humidity remained constant till the target moisture content (Mt) of 12% was reached. That was established on calculated expected weight of the wood charge in the kiln which in turn was based on estimated green moisture content. The tenth step is a conditioning period and is time based. After completing a drying run, the timbers were left inside the idle kiln with the doors closed to cool down for 12 h before final evaluation.
Drying schedules used for ‘control’ and eight experimental runs*
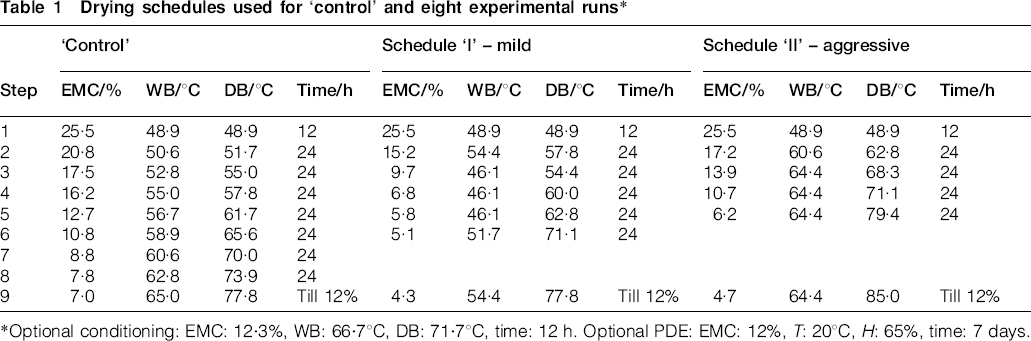
*Optional conditioning: EMC: 12·3%, WB: 66·7°C, DB: 71·7°C, time: 12 h. Optional PDE: EMC: 12%, T: 20°C, H: 65%, time: 7 days.
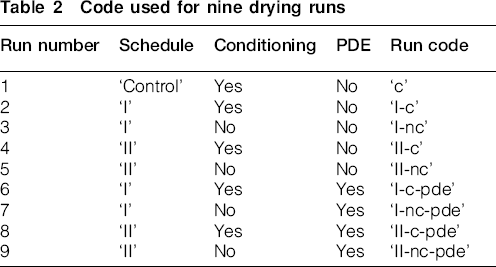
Schedule ‘I’ was a mild variation of the ‘control’ where the same dry-bulb temperature (Tdb) was reached in the last step, but the equilibrium moisture content (Memc) was reduced more aggressively. Schedule ‘II’ was considered an aggressive one because it reached a higher Tdb in the final step of drying and also had a steep reduction in Memc. Schedules ‘I’ and ‘II’ were executed with an option of conditioning and/or PDE. The details of all schedules can be seen in Table 2.
Code used for nine drying runs
Upon completion of each drying run, all timbers were firstly weighted and then visually examined for checks where the length of each check was measured. Subsequently, the specimens of runs 6, 7, 8 and 9 were taken to a controlled climate room for one week of PDE and afterwards, diamonding, twist and weight of each specimen were re-measured. The specimens of runs 1, 2, 3, 4 and 5 comprised the non-PDE cluster so they had all measurements taken right after unloading the kiln and before being cut for final evaluation.
The climate chamber simulated was set to Memc of 12% (H: 65%, T: 20°C) that is equivalent to the average ambient conditions in Kobe and Nagasaki from October to May. The timbers were sticker-stacked and kept in the same package position they were during drying. The specimens from the non-PDE runs were cut immediately for evaluation after they were unloaded from the kiln whereas the PDE ones were cut after their seventh day of chamber conditioning. Evaluation involved the rejection of the first 300 mm from both ends in each kiln specimen and then, the production of a 25 mm moisture section (A). Thereafter, a 100 mm long piece was chopped and discarded and then, three 25 mm sections were cut for moisture content (B), the casehardening prong test and the determination of core/shell (Mc/Ms) moisture content differential, respectively and always in that order. After discarding another 100 mm cutting, the last section (C) for the average moisture content was cut (Fig. 2). The prongs were drawn using a template and they always pointed upwards as previously described by Rohrbach (2008). The distance of the cut prong tips was measured and recorded. After allowing the prongs to dry at room temperature for 24 h, their tip distance was measured again along with their length and the level of casehardening was calculated using Fuller's equation (Fuller 1995). The sections designated for average moisture content and core/shell moisture content were re-weighed after oven drying and then their moisture content calculated. Additionally, every section B was scanned and visually sorted into four different pith location categories (α, β, δ and ϵ) shown in Fig. 3 representing the presence or absence of juvenile wood according to the classification used by Bradic and Avramidis (2007).
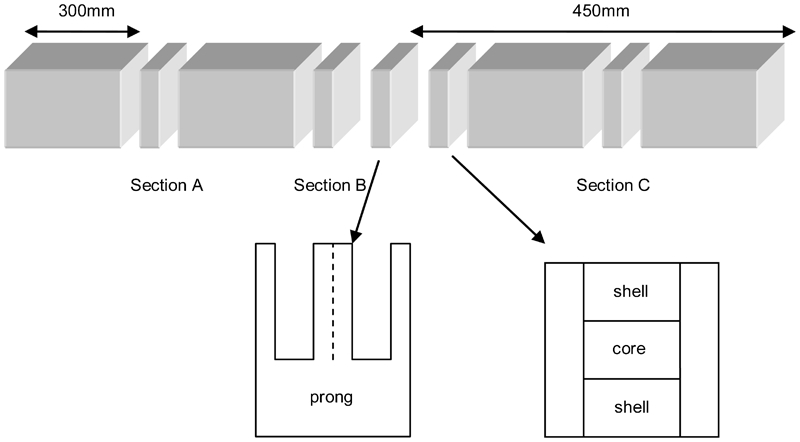
Cutting pattern of kiln dried specimens for quality assessment
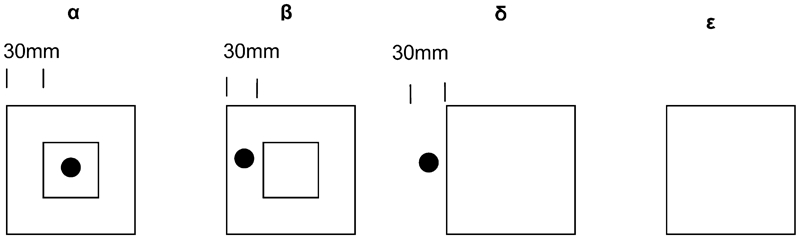
Pith location classification in kiln drying specimen cross-section (α – pith in centre area, β – pith in quarter area, δ – outside cross-area, but close to timber side, ϵ – pith more than 30 mm from the timber side)
The experimental design is an incomplete factorial design. The experiment has three factors (drying schedule, conditioning, and PDE) with two levels for each factor (schedule I and II, conditioning: yes or no, PDE: yes or no), which is a 2×2×2 factorial with 8 runs. In addition, there is the ‘control’ run, which lies outside the factorial design by not being exposed to any treatments that were set up by the factors. This ninth run is what makes the design an incomplete factorial. Additionally, this study did not contain repetitions, since each treatment combination was used only once and no runs were duplicated. Each run contained 42 specimens (experimental unit), but they are likely to have similar measurements because they are close in space or time and received the same treatment during the same drying run so, they cannot be called repetitions. Because the observations were not acquired by random sampling, they are designated as pseudoreplications.
In order to link the green values to the final values, a t-test was carried out to assess for significant differences. For all t-tests, analysis of variance (ANOVA) and analysis of covariance (ANCOVA) were performed where the level of significance (type I error) was set at 0·05. ANOVA searched for differences between the drying runs for parameters like final moisture content, shell moisture content, and casehardening. The results are expected to reveal if there is a difference, but they will not show which of the treatments is different from the other consequently, to detect that, the Bonferroni test had to be used. Due to the significant influence of the difference on final moisture contents, a discrete statistical approach was called for when comparing core moisture content, twist, and diamonding. In order to eliminate the effect of the differences in final moisture content on the experimental results, ANCOVA was used.
Results and discussion
Schedule effects
The average BDi of the nine groups ranged from 377 to 387 kg m−3 with standard deviations from 32 to 47 kg m−3 and Mi values ranging from 77 to 81% with standard deviations from 20·3 to 30·1%. No significant difference for the nine drying runs among average BDi and Mi values was detected by t-test analysis.
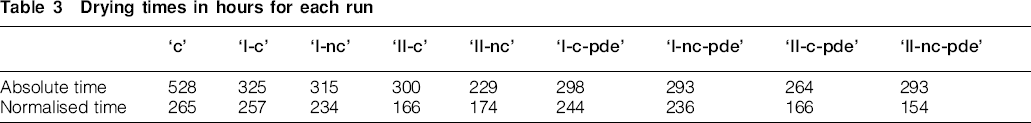
Drying times for all runs extended from 229 to 528 h. The drying schedule used as ‘control’ was the mildest and took the longest to complete. The runs using schedule ‘II’ were the fastest. Hao and Avramidis (2004) used the ‘control’ schedule and experienced drying times of 575, 392 and 294 h with target moisture contents of 12, 15 and 20%, respectively, similar to the drying times of this study. In order to compare the drying times among the nine runs, they had to be normalised. This was necessary because each run had different initial and final moisture contents. The drying times became comparable when counting only the hours of drying from the lowest green moisture content to the highest final moisture content that the nine runs had in common. This way all runs had the same start and end points for moisture content. Normalised drying times ranged from 154 to 264 h; a fairly accurate and practical approximation (Hao and Avramidis 2004; Sackey et al. 2004; Bradic and Avramidis 2007). Upon normalisation, the ‘control’ was the slowest run – 265 h; however, it was very closely followed by the drying runs using schedule ‘I’ – 257 to 234 h, while schedule ‘II’ – 174 to 154 h – demonstrated significantly faster drying times (Table 3).
Drying times in hours for each run
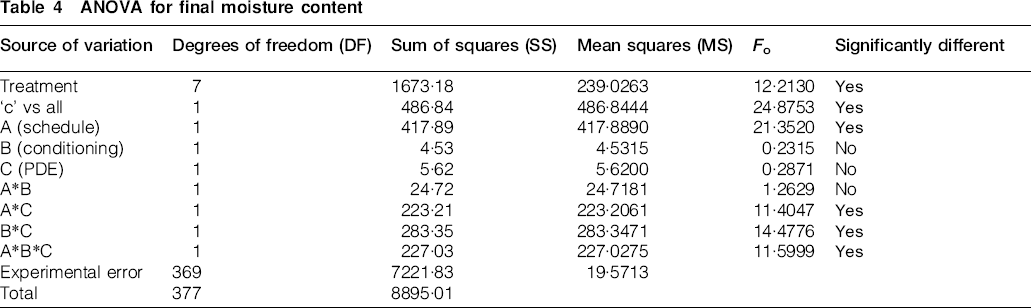
Mf for all nine runs ranged from 10·9 to 17% (average of 14·1%). Wide Mf distributions between runs are always a challenging situation when comparing hemlock timber quality with wet pockets and large differences in sapwood/heartwood Mi values being the culprits (Kozlik and Hamlin 1972; Zhang et al. 1996; Bradic and Avramidis 2007). Statistical analysis of timber quality parameters had to be adjusted to eliminate the influence of Mf. ANOVA (Table 4) showed significant influence of the treatments on Mf. A difference between the treatment runs and the ‘control’ was also evident. The interaction of schedule, conditioning and PDE shows significant influence on Mf as does the interactions of conditioning and PDE, and schedule and PDE. Consequently, the drying schedule had a significant influence on Mf.
ANOVA for final moisture content
The four runs with a PDE period had their moisture measured before and after that period. Pre-PDE, Mf ranged from 6·3 to 40% (differential of 33·7%), while post-PDE it ranged from 7·1 to 28% (differential of 20·9%), namely, a moisture drop of about 36%. All specimens lost moisture during PDE due to their relatively high Mf compared to the conditions of the climate room. The average moisture loss during PDE ranged from 0·5 to 3·5%, with three-out-of-four runs showing no significant losses while in PDE. Run ‘I-c-pde’ had a significant loss in moisture during PDE; however, this run also showed the highest moisture after drying thus a higher moisture loss was to be expected.
The average Mc was 21·7%, ranging from 14·9 to 28·6% for all runs and it was more uniform when schedule ‘I’ instead of ‘II’ was used possibly due to different average Mf values. Moreover, the PDE specimens had lower Mc as a result of the overall specimen Mf. ANCOVA revealed that PDE had a significantly positive influence on Mc. Among the non-PDE group, Ms ranged from 11·4 to 17·6% with an average of 14·5%. Interpretation of the ANOVA results confirm that the interaction of all three treatments had a significant influence on Ms as did the interaction conditioning and PDE, as well as the interaction of schedule and PDE. Schedule ‘I’ resulted in lower Ms than schedule ‘II’ with the ‘control’ run having significantly different Ms, when compared to the treatment runs. The former showed lower Ms than both schedules ‘I’ and ‘II’, with and without conditioning or PDE. Moreover, the ‘control’ was lower in Ms than schedule ‘I’ either with conditioning or PDE (‘I-nc-pde’, ‘I-c’). Run ‘II-nc-pde’ reached significantly lower shell moisture than either ‘II-nc’, ‘II-c-pde’ or ‘I-nc-pde’. Regardless of the aforementioned trends, there seemed to be no distinct pattern developing in the combinations that resulted in statistically significant differences.
All specimens were sorted into pith location classes with two of them in pith location α, 73 in β, 84 in δ, and 219 in ϵ. Every drying run had approximately the same distribution of pith locations. The Mf for each specimen was classified based on pith location along with drying run where analysis revealed that the moisture of each pith location was influenced by the mature/juvenile wood content, i.e. specimens with a higher content of mature wood exhibited higher Mf values. The average Mf sorted by pith location and run, indicated that the further the pith is distanced from the centre of the cross-section, the higher its Mf. That is opposite to what Bradic and Avramidis (2007) reported in their study where pith location did not seem to influence Mf. Last, PDE appears to lower the Mf for each pith location class.
Target moisture content was considered attained for commercial ad quality purposes when it was within three percentage points of the average in each run. The drying runs using schedule ‘II’ showed between 70 and 81% of the timbers being on target which is reasonably close to 92% of the ‘control’. When considering the saving in drying time schedule ‘II’ provides when compared to the ‘control’, this slightly lower percentage of on-target timbers becomes a very realistic tradeoff.
The four PDE runs were sorted into moisture groups before and after equalisation. The percentage of specimens in the target moisture group increased considerably after PDE. The number of over-dried specimens was notably reduced with the number of under-dried timbers also decreased, suggesting a further loss of moisture of the specimens during that period. The standard deviations of the Mf values for each run were also reduced.
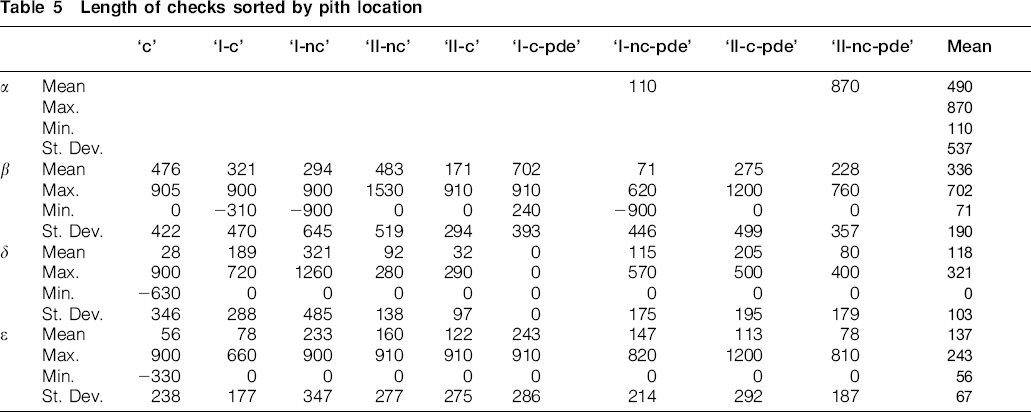
In defect evaluation, checks were added up to a total check length per green specimen. When a t-test was carried out, a statistically significant increase in checks during the drying process was revealed. A lower check length for the drying runs that used schedule ‘II’ with either conditioning or PDE was observed. Only schedule ‘II’ resulted in a lower percentage of checks when compared to the ‘control’, while schedule ‘I’ developed more checks than the ‘control’ and schedule ‘II’. On the other hand, run ‘II-nc’ showed the highest check length, but it was reduced drastically when either conditioning or PDE or both were included. Schedule ‘II’ with either conditioning and/or PDE had the lowest increase which was only matched by the ‘control’. The check length sorted by pith location in Table 5 shows that α and β specimens display the longest checks, while the specimens with the pith located outside its cross-section developed significantly less checks. Bradic and Avramidis (2007) similarly confirmed that the length of checks was significantly influenced by pith location and Mf.
Length of checks sorted by pith location
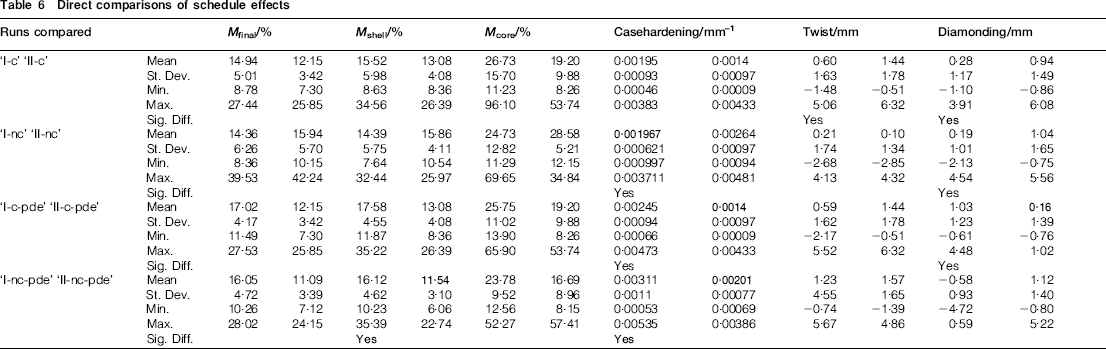
Twist t-tests (Table 6) confirmed differences in pre- and post-drying. Twist significantly increased in all drying runs except in ‘II-nc’, ‘II-c-pde’ and ‘I-nc’. The last finding contradicts Hao and Avramidis (2004, 2006), who reported a significant increase in twist during all drying runs when using the ‘control’ schedule. Wallace et al. (2003) found an increase in twist in almost half of the dried timbers, but the changes were ‘considered acceptable’. Since pre-existing twist greatly influences that in dried specimens, the difference of post- and pre-drying twist was also calculated. That difference ranged from 0·10 to 1·57 mm, with a minimum of −2·68 to a maximum of 6·32 mm. Twist during the drying was also reported by Bradic and Avramidis (2007) and by Hao and Avramidis (2004, 2006), who ascribed it to a slope of grain effect. Bradic and Avramidis (2006) found a weak correlation between slope of grain and twist development during drying whereas Hao and Avramidis (2006) reported a correlation between lower final moisture contents with higher twist values. Run ‘II-nc-pde’ had the smallest pre-drying twist, but actually had the largest twist increase. It is in the group of highest twist difference together with runs ‘II-c’ and ‘I-nc-pde’ – all three runs with either no conditioning or no PDE. The four runs with the lowest twist difference used schedule ‘I’ (‘I-c-pde’, ‘I-c’, ‘I-nc’) and schedule II (‘II-nc’). It is interesting to note that three out of the four twist-related best runs did not include PDE and the top two runs (‘I-nc’ and ‘II-nc’) did not include either conditioning or PDE. The ‘control’ run showed a higher twist than most of the treatment runs (‘I-c-pde’, ‘I-c’, ‘I-nc’, ‘II-c-pde’, ‘II-nc’) of which three did not include PDE and two of those did not even include conditioning.
Direct comparisons of schedule effects
ANCOVA was run to analyse twist while eliminating Mf impact. The results revealed a significant influence of the treatment combinations on the twist difference values. The interaction of schedule, conditioning and PDE as well as, the interaction of conditioning and PDE, showed a significant influence on twist. For the most part, the treatments seemed to have a positive effect on twist when considering the significant differences of pre- and post-drying measurements. However, no single main factor had a significant influence during the drying process. Wallace et al. (2003) reported that PDE had no significant effect on twist, which confirms the finding that PDE, as a main factor, does not influence twist. The ‘control’ schedule did not show a significantly different twist when compared to the other runs. When evaluating the significantly different associations it becomes evident that only two of the possible pairings are significantly different from each other and none of the other runs is different from the ‘control’. The only runs that show a difference involve schedule ‘II’. Run ‘II-nc’ developed notably less twist than runs ‘II-c’ and ‘II-nc-pde’ and had the least overall twist of all runs.
Pith location seemed to have only a small influence on twist, since pith locations β, δ and ϵ showed increased twist during drying by less than 1 mm. Bradic and Avramidis (2007) found pith location to have a significant influence on twist in interaction with either cutting season or target moisture, but not as a main factor. Hao and Avramidis (2006) also noticed timbers with pith locations included in their cross-section, posing some threat to the shape of the timber, in addition to the possibility of wet pockets and invisible grain defects. Pith location δ and ϵ seemed to have the least twist difference in combination with schedule ‘I’. In terms of physical location during four out of nine runs, the values for twist were higher in the top rows than in the bottom rows of the kiln load. The weight of the kiln load might help the timbers on the bottom to stay in shape. Hao and Avramidis (2004) found this to be true if timber had a high slope of grain.
Green and post-drying/PDE diamonding was measured in each specimen (Table 6). After t-testing pre- and post-drying/PDE values, it became clear that diamonding significantly increased during drying in six out of nine runs. Runs ‘I-c’ and ‘I-nc’ did not show a significant increase in diamonding and run ‘I-nc-pde’ even showed a significant decrease. Hao and Avramidis (2006) reported a significant increase in diamonding with decreasing final moisture content which Bradic and Avramidis (2006) contradicted. Hao and Avramidis (2004) reported significantly higher diamonding after drying when using the ‘control’ schedule which is also true for this experiment. The green diamonding measurements ranged from 0·13 to 0·77 mm, taking the means of the nine runs. After drying, the variability of the measurements increased from 0 to 6·47 mm between all specimens. To make the diamonding measurements comparable, the pre-drying values were deducted from the after drying/PDE measurements. This made it possible to compare the changes in diamonding that occurred during the drying process and the resulting range was from −4·72 to 6·08 mm. The negative numbers were a consequence of decreasing diamonding during the drying process; a phenomenon that was also reported by Hao and Avramidis (2006). It became evident that three out of four runs showing the largest kiln dry diamonding and diamonding difference used schedule ‘II’ (‘II-c’, ‘II-nc’, ‘II-nc-pde’, ‘I-c-pde’). On the other hand, three out of four runs with the smallest kiln dry measurements and diamonding differences were dried using schedule ‘I’ (‘I-c’, ‘I-nc’, ‘I-nc-pde’, ‘II-c-pde’).
ANCOVA analysis revealed that schedule and PDE interaction had a significant influence on diamonding, in addition to schedule and conditioning interaction. There were no significant differences when the eight runs were compared to ‘control’. Considering the meaningful comparisons, there are only three pairings that are significantly different from each other. Using both schedules without conditioning or PDE, the milder schedule ‘I’ resulted in less diamonding. When adding conditioning and PDE however, schedule ‘II’ shows a significantly lower increase in diamonding when compared to schedule ‘I’. Diamonding seems to have no obvious correlation with pith location, corroborated also by Bradic and Avramidis (2007).
Casehardening was measured for every specimen after drying/PDE. The nine-run average ranged from 0·0014 to 0·0031 mm−1, while the individual specimen values ranged from 0·00009 to 0·00535 mm−1 (Table 6). Runs ‘II-c-pde’ and ‘II-c’ had the lowest casehardening followed by the ‘control’. It was surprising that the harsher schedule ‘II’ developed the smallest casehardening whereas, runs ‘I-nc-pde’ and ‘II-nc’ with no conditioning had the highest. As expected, ANOVA revealed that all treatments significantly effected casehardening as main factors and as combinations. Furthermore, all eight runs were significantly different from the ‘control’. Comparing schedules without conditioning or PDE, schedule ‘I’ showed better results (less casehardening). When comparing the three different schedule pairs, schedule ‘II’ is better in two out of three pairs especially with conditioning than without. Upon comparing the ‘control’ run to the treatments, it turned out that the ‘control’ casehardening was significantly smaller than three of the treatment runs, namely, ‘I-c-pde’, ‘I-nc-pde’, and ‘II-nc’.
Conditioning effects
The only noticeable effect conditioning had on kiln drying residence was prolongation by 12 h when it was included. All treatments (schedule, conditioning and PDE) had a significant effect on Mf, but conditioning was not a main factor. In terms of Mc, conditioning had no significant effect (Table 7). However, for Ms, it seemed to have an influence as interaction with PDE and as interaction with PDE and schedule. Conditioning had no significant influence when used with schedule ‘I’, but influenced schedule ‘II’.
Direct comparisons of conditioning effects
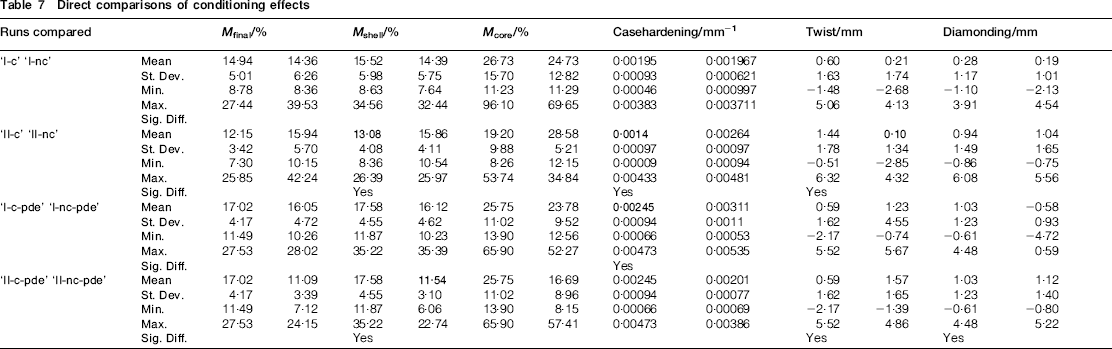
The use of conditioning seemed to lessen the appearance of checks in drying. On the other hand, three out of four direct comparisons did not show a significant difference in twist. Conditioning stood out as having a significant influence on twist as interaction with PDE and as the interaction with PDE and schedule. Surprisingly, the harsher schedule ‘II-nc’ developed significantly less twist than the ‘II-c’ with conditioning. Conditioning did not show a significant influence on diamonding, but in combination with schedule, it did. With casehardening, two runs utilising conditioning showed the lowest values. Conditioning had a major influence as a main factor and in interaction with schedule, as well as interaction of conditioning, PDE and schedule.
PDE effects
PDE did not influence the kiln time directly, but it added seven days to the whole process of final product preparation. There was no influence of PDE as a main factor, but it did influence Mf as interactions with schedule, with conditioning and together with schedule and conditioning. Each run lost a significant amount of moisture during PDE. Mc was influenced by PDE as a main effect and as the only effect where cores showed exhibited significant moisture reduction after PDE. However, the meaningful comparison pairs did not show noteworthy differences. Wide range of Mf might have contributed to that rather contradictory observation. PDE runs lost a substantial amount of water, but statistically speaking that was not significant compared to the non-PDE runs.
The shell moisture contents were influenced by PDE only as interactions, together with schedule, conditioning, and with both schedule and conditioning. These results are anticipated since the specimens were given time for the internal moisture gradients to level of, as well as, to lose further moisture. Accordingly, the seven-day PDE increased the number of specimens that fell within Mt range and simultaneously reduced the number of over-dried specimens. The direct comparisons regarding the PDE effect are listed in Table 8.
Direct comparisons of PDE effects
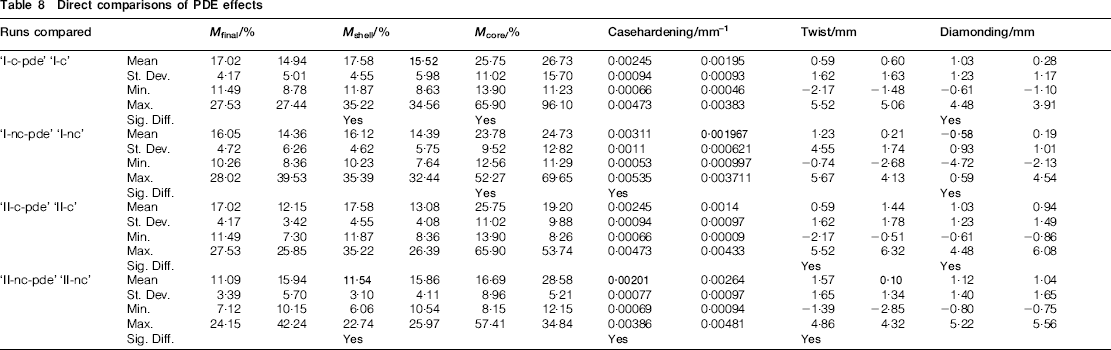
The amount of visible checks seemed to be reduced after PDE. In terms of twist, the results were quite variable, namely, only run ‘II-nc’ showed a significantly lower twist when compared to its paired run. Nonetheless, the interaction of PDE and conditioning and the interaction of PDE, conditioning and schedule significantly influenced twist. PDE significantly influenced diamonding when interacting with schedule or conditioning. PDE had a major effect on casehardening as a main factor and as the interaction with schedule and with both schedule and conditioning. Both significant comparisons, however, favour PDE and non-PDE equally. Overall, PDE decreased Mc and reduced diamonding when interacting with schedule. It showed an influence as interaction for twist and as main factor and interaction for casehardening. In addition, PDE increased the number of specimens in the target moisture content group and reduced the over-dried specimens by moving Mf distribution towards target moisture content.
Comparison of all treatments to ‘control’ run
The drying time of the ‘control’ was longer than the treatment runs with a significantly lower Mf, but not significantly different when considering Mc. However, it was significantly lower in Ms in six out of eight comparisons. Over 90% of its specimens fell into the on-target group, which was more than in most treatment runs and possibly attributable to the wide spread of Mf. The ‘control’ was in the group of the smallest increase in checks together with schedule ‘II’ with either conditioning and/or PDE. The ‘control’ showed the least of an increase in checks during drying in seven out of eight treatments. Twist did not develop significantly different in any of the eight treatment runs, but visually it was in the group of four with the highest increase in twist. For diamonding, it showed no significant difference to any of the treatment runs where it had less increase than four out of eight treatment runs, which were mostly schedule ‘II’ without either conditioning and/or PDE. Last, for casehardening, the ‘control’ was the third lowest and was significantly different from the treatment runs.
When comparing the ‘control’ to the eight treatment runs it becomes apparent that it exhibited less casehardening than three out of the eight treatment runs, but on the other hand, none of the treatment runs showed a significant difference in twist or diamonding when compared to the ‘control’.
Conclusion
In the light of this investigation, the following conclusions can be made.
The type of schedule seemed to have an effect on the quality of drying where longer drying times and milder temperatures overall resulted in fewer defects and tighter moisture content distributions between and within timbers.
As expected, inclusion of conditioning at the end of the drying cycle also reduced internal stresses and flattened moisture profiles that in turn, were further improved when post-drying equalisation was included. Conditioning in some cases did reverse some defects such as surface checks and diamonding that developed during the drying period.
Pith location on the end-surface affected the occurrence of some timber defects at various levels, especially the ones related to the presence of juvenile wood such as surface checking.
Post-drying equalisation decreased the final and the core moisture contents significantly and thus increased the number of timbers in the target moisture content group. It had significant influence on diamonding (also in interaction with the drying schedule and with conditioning), but no clear trend could be established with the current data. There was also a significant influence on twist, in interaction with conditioning and with both, conditioning and schedule. However, three out of four runs that exhibited the smallest increase in twist did not use equalisation. Statistically, equalisation had significant influence on casehardening as a main factor and in interactions with schedule and with both, schedule and conditioning.
Overall, kiln dried timbers can benefit from a conditioning step at the end of the drying cycle and further storage before shipment in a covered area where internal moisture gradients are expected to further level off and casehardening to reduce. Additional research work on the effect post-drying equalisation on the quality of timbers is highly recommended.