
Abstract
Prediction of basic timber properties like moisture content and density is an important factor for quality control in timber industry. This paper deals with the detection of moisture content and density of spruce (Picea abies). It describes the calibration and validation of the newly developed microwave prototype on the basis of 480 measurements for moisture contents between 8 and 19% and densities between 340 and 600 kg m–3. The calibration and first validation set lead to R2≥92% in both cases. The prediction for a second and third validation decreases as especially the range of moisture content for these pieces was limited. Compared to other moisture and density measurement systems, the prototype showed good performance. With this technology it is possible to detect moisture and density of a piece of timber contact free and non-destructive with high prediction accuracy for both parameters in one pass.
Introduction
Grading machines are used to detect strength, stiffness and/or density of sawn timber as these three parameters determine the timber quality. The development is guided by fast, reliable and precise methods for automated and non-destructive detection of parameters that are closely related to these properties. All these parameters are influenced by moisture content. Many commercial devices exist to detect moisture content or density (Beall 2007), but still the reliable detection of moisture content in sawn timber is not solved satisfyingly.
Moisture content has a high variation depending on environment and history of the timber. Timber in the building sector usually has moisture contents between 6% and 20%. Current methods for moisture content detection can be classified in two groups: direct and indirect measurement (Kupfer 1997; Niemz et al. 1990; Trübswetter 2009). The most commonly used direct measurement is the oven dry method: it is based on a defect-free piece of timber cut out of a specimen, weighed in wet and dried condition and the moisture calculated out of these two weights. The advantages are high accuracy, reproducibility and low costs leading to the standardised method in research. The disadvantages are destruction of the initial specimen and time consume. Indirect methods are based on electrical, radiometric, or optical techniques which are non-destructive and fast. Electric moisture meters used in production lines come in types of resistance or dielectric moisture meters with a measurement range between 7% and 25% and 4·5% to 25%, resp. Mitchell (2005). These technologies are used in portable handheld systems. For all electric moisture meters species, density, moisture distribution, thickness, and temperature influences the result of the measurement (James 1988).
Density is the second essential quality indicator in timber industry as density influences strength and stiffness of each timber piece. All three parameters are used to allocate timber to defined strength classes. Density is utilised by destructive and non-destructive methods. Examples for destructive methods are determination of drill resistance or, in a wider sense, the oven dry method. In the latter case the same small defect-free piece of timber used for the detection of moisture content is gauged and weighted. Examples for non-destructive methods are visible/near infrared (VIS/NIR) spectroscopy, radiometric (γ- and X-ray) methods, and computer tomography (Dunky and Niemz 2002) whereas radiographic testing and in particular CT scanning with X-ray is frequently used (He and Qi 2013).
Up to now, the reliable detection of moisture content and density in sawn timber is not solved satisfyingly as two systems need to be used which are totally different in their technology. For production lines, as less systems as possible are desirable. Furthermore, industry is looking for easy to use systems able to detect both density and moisture content in one pass. Beside this, most of the available systems are limited for timber below fibre saturation point. With increasing demand on strength grading in wet conditions, a technology able to handle wet and dry timber is desirable.
One alternative for this task is the use of microwave technology. James et al. (1985), Kharadly (1985), and Tiuri and Heikkila (1979) show first methods for the determination of basic timber properties using microwave technology. Various researchers followed showing that the detection of moisture contentment and/or density in timber is possible (Johansson et al. 2003; Lundgren 2007; Orhan 2002; Schajer and Orhan 2005; Schajer and Orhan 2006; Vikberg et al. 2012b). The method is also applied on other materials for example agricultural grains, peanut kernels, and building materials (Kääriäinen et al. 2001; Kim et al. 2002; King and Basuel 1993; Kraszewski and Nelson 1993). Additionally, detection of grain orientation is possible with microwave technology (Bogosanovich et al. 2009; Bogosanovic et al. 2013; Denzler et al. 2013; Malik et al. 2005; Nguyen et al. 2004; Schajer and Orhan 2005; Schajer and Orhan 2006; Shen et al. 1994).
Material and methods
Material
72 spruce specimens form the basis for the system calibration: 60 specimens have a cross-section of 152×33 mm, the remaining 12 a cross-section of 274×40 mm. The cross-section was varied to be able to detect possible influences of cross-section on the results. Each specimen was cut to a length of 800 mm. One defect-free specimen was taken as reference to determine initial moisture content and density. These 72 specimens were divided in three samples with 24 specimens each including 20 pieces with 33 mm thickness and 4 with 40 mm thickness. Each sample was conditioned in different climates to get various moisture contents. Different climates [20°C/-% (delivery status), 23°C/30%, 23°C/50%, 20°C/65%, 20°C/95%] were applied to achieve eight different moisture contents between 7·5 and 19·1% covering the moisture content range of timber industry. Figure 1 compares the moisture content reached after acclimatisation ureached versus the aimed at moisture contents uaim.
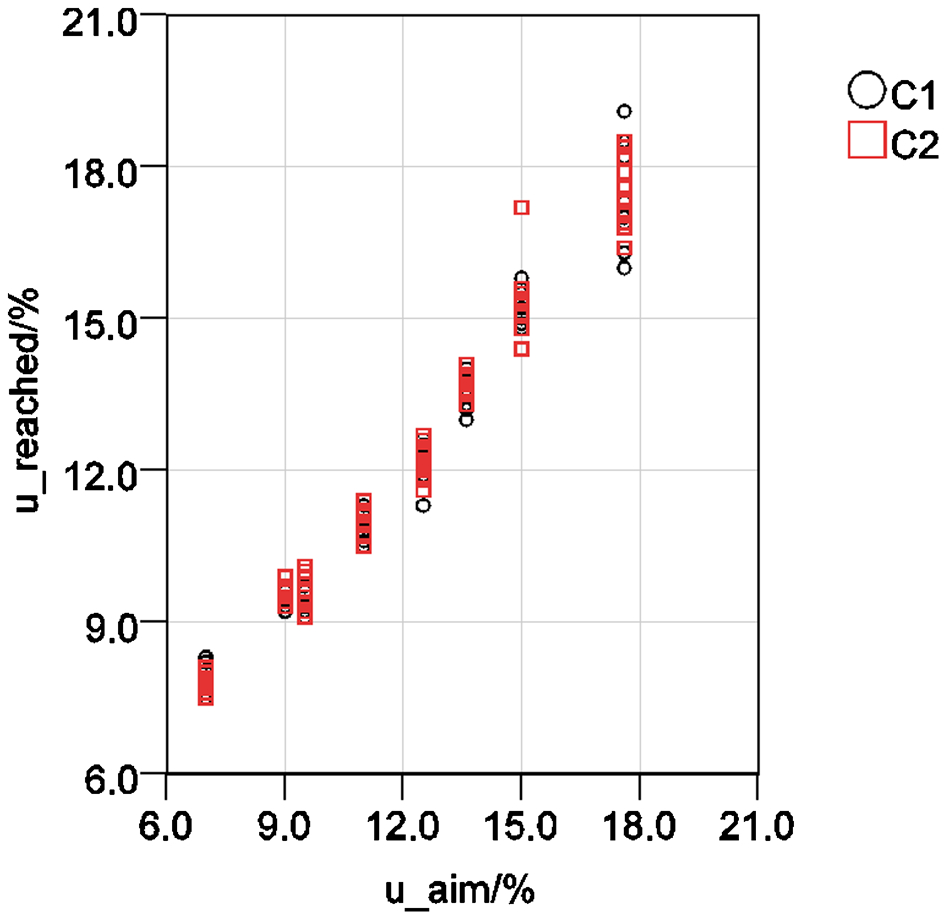
Reached moisture content versus aimed moisture content separated for series (Table 1), n = 190 data sets
In total 8×24 = 192 measurements are preformed. Two of them were invalid. The remaining 190 data sets are divided randomly in two series named calibration ‘C1’ and calibration ‘C2’. ‘C1’ is used for training the mathematical model, ‘C2’ is used for testing the equations. In addition, two validation series ‘V1’ and ‘V2’ with more than 110 spruce specimens each and a cross-section of 82×43 mm tested the outcome of this study.
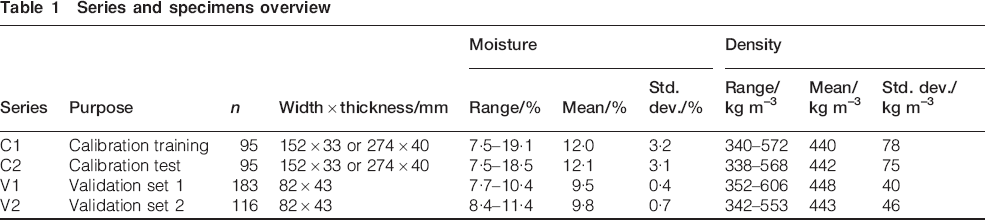
Table 1 gives an overview of the material used in this paper. The value n represents the number of measured data sets for ‘C1’ and ‘C2’ whereas n is the number of measured specimens for ‘V1’ and ‘V2’. Table 1 shows also the arithmetic mean (mean) and the standard deviation (std. dev.) for all data sets and specimens. In contrast to the calibration series, the validation series have a much lower moisture content and density variation representing industrial processing.
Series and specimens overview
Methods
Device and measurement principal
Each specimen was measured with the prototype using microwave transmission to detect its moisture content and density. This prototype was developed at Vienna University of Technology by the Institute for Electrodynamics, Microwave and Circuit Engineering (EMCE). The scanning panel consists of an array of 28 small sized dual polarised patch antennas (Fig. 2). Each antenna has a scanning area of 12·5×12·5 mm. The whole panel can scan an area with a width up to 350·0 mm and each measurement includes a length of 12·5 mm without moving the timber specimen. The working frequency of the microwave system is 12 GHz with a free space wavelength of 25 mm. More detailed information on this microwave system is given in Denzler et al. (2013).

a microwave prototype and b microwave prototype detail: 1, specimen; 2, one of the two extension boards; 3, one of the three receiving antennas; 4, plane absorber; 5, transmitting antenna array (28 antennas); 6, light barrier
When microwaves pass trough timber they will be damped and undergo a phase shift. Owing to the anisotropic structure the propagation constant in timber differs parallel and perpendicular to grain direction which directly influences damping and phase shift (Torgovnikov 1993). The waves are damped, mostly by the water embedded, dependent on the specimen's thickness. Figure 3 shows that the damping parallel to grain attu is bigger than the damping perpendicular to grain attv (Schajer and Orhan 2005; Schajer and Orhan 2006). In contrast, the phase shift parallel to grain φu is lower than perpendicular to grain φv. Testing the three-dimensional distribution of damping and phase shift in timber is performed using microwaves of two orthogonal planes. The mathematical superposition of the resulting waves lead to an electromagnetic field vector which is rotating along an elliptic path. This ellipse gives information on grain direction (Fig. 3).
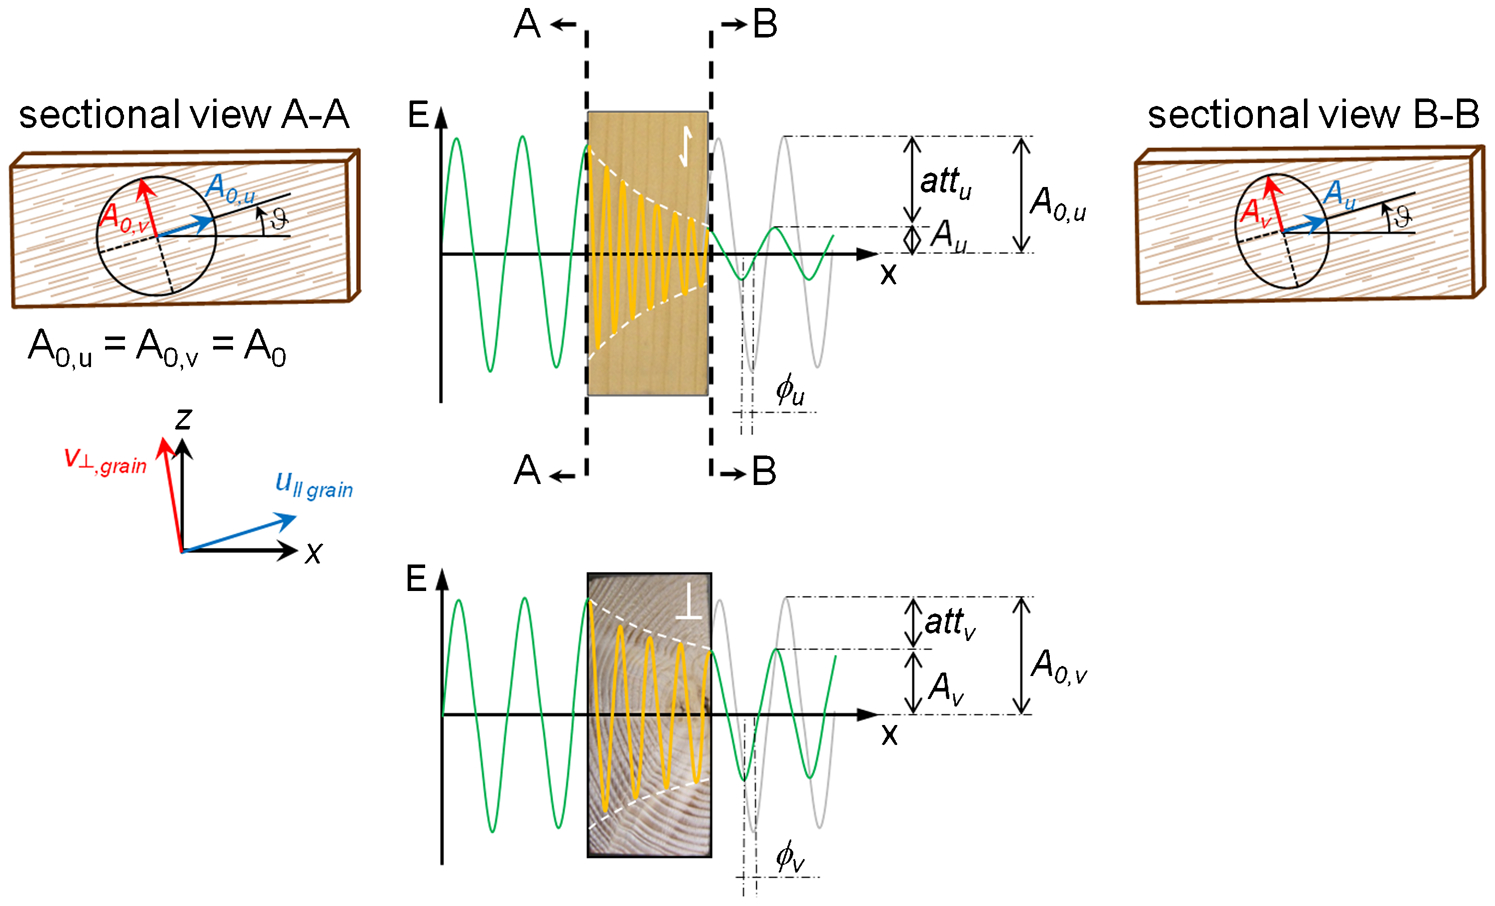
Principle of transition of microwaves through wood
Calibration
Prior to microwave measurements, initial moisture content and initial density of each specimen was determined based on a defect-free piece of timber in the beginning of the test setup. In each climate step, the weight and dimensions of each specimen were determined to be able to recalculate the reference moisture content uref and the corresponding density ρref with the help of these initial properties.
In each climate step the microwave prototype evaluates density and moisture content over the whole width of the specimen, 152 mm or 274 mm resp., and a length of 12·5 mm statically. Each area was marked on the specimens itself to make sure to use the identical area in the different climate steps. For the analysis only the central width of 37·5 mm corresponding to three patch antennas was used as a boundary effect adulterates the results of the antennas on edges of the specimen by diffraction of the microwaves (Baradit et al. 2006; Denzler et al. 2013; Hansson et al. 2005; Johansson et al. 2003; Vikberg et al. 2012a). As neither moisture content nor density varies significantly over the width or the length of carefully conditioned spruce specimens, this small scanning area does not influence the results. For reference purposes, the so called electrical moisture content uelec of each specimen was detected using a resistance moisture meter (GANN, M 4050) with a tow pin electrode at the time of the microwave measurement.
Validation
Also for the validation specimens the reference moisture content uref and the corresponding reference density ρref was determined based on a defect-free piece of timber prior to the microwave measurement for each specimen.
The microwave measurement took place over the whole width of the specimens of 82 mm and a length of 720 mm in motion. A width reduction to properly prevent boundary effects will conclude in not useable results at all. Therefore, two wooden covers were placed beside the specimen to reduce the edge effect for these small widths as good as possible (Fig. 2b). The covers have a cross-section of 43×258 mm and their moisture content and density complying with these of the validation specimens as too high differences in these properties will influence the results. To prevent gaps between the covers and the specimens, the covers were pressed to each side of the specimens during the measurement process. Owing to these covers the edge effect is negligible especially for the central two antennas, which are used for evaluation in the following sections.
Data analysis
The data are analysed using stepwise linear regression generated in IBM SPSS Statistics 20. Microwave transmission produces the parameters attenuation attu and attv and phase shift φu and φv. In addition, the specimens’ thickness sthick and width swidth are available. As the width is influenced by the number of antennas used this parameter is not further taken into account. For the prediction of moisture content and density different equations are evaluated where the number of independent variables is limited as good as possible in order to achieve stable equations. This approach prevents strong adjustment of the regression on the existing data, increasing the suitability for various data sets.
Results
Prediction of moisture content
For training the microwave prototype to predict the reference moisture content uref series ‘C1’ is used. Stepwise linear regression including all five parameters results in equation (1)

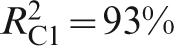
The predicted moisture content upred is based on attenuation attu and phase shifts φv and φu. Attenuation attv and thickness sthick does not help to improve the prediction. Figure 4 shows the reference moisture content uref versus the predicted moisture content upred for all 95 specimens with
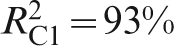 .
.
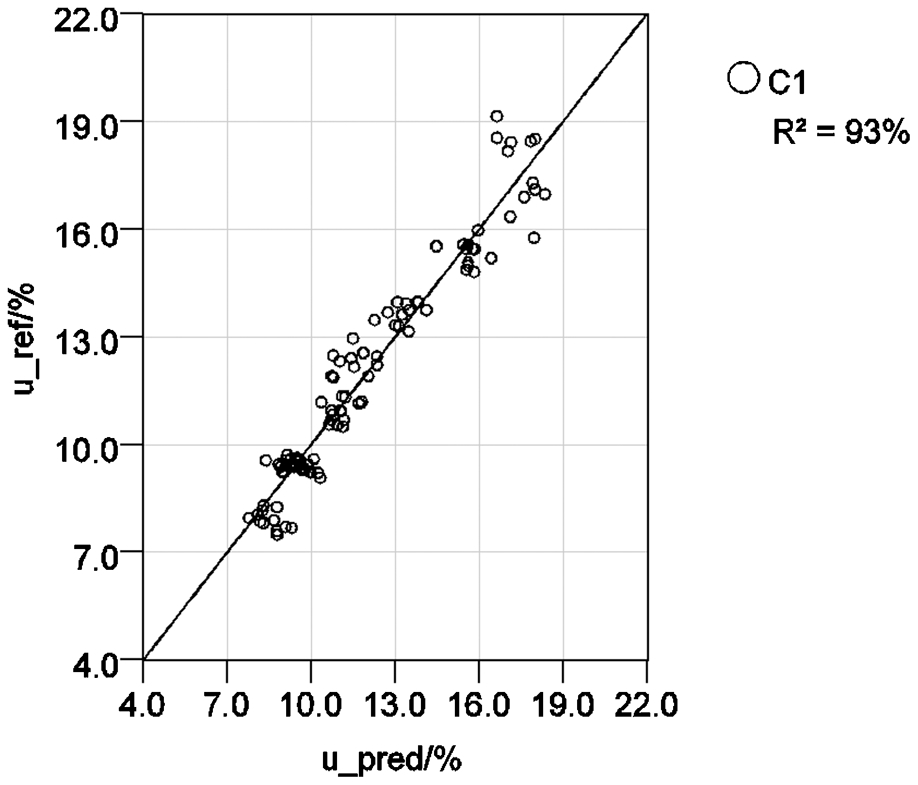
Reference versus predicted moisture content of calibration series ‘C1’, n = 95 data sets
For testing, equation (1) is used to predict the moisture content of all three remaining series. Figure 5 shows the outcome: As the results for the testing series ‘C2’ are in line with the training series ‘C1’ one can assume that the calibration is not limited to the training setup. The results for the two validation series differs as the regression lines of ‘V1’ and ‘V2’ are tilted with respect to the bisection line and the coefficients of determination decreases. One reason is the small range of the moisture content in both validation series (Table 1). ‘V1’ shows the smallest moisture content range and the biggest deviation between regression and bisection line.
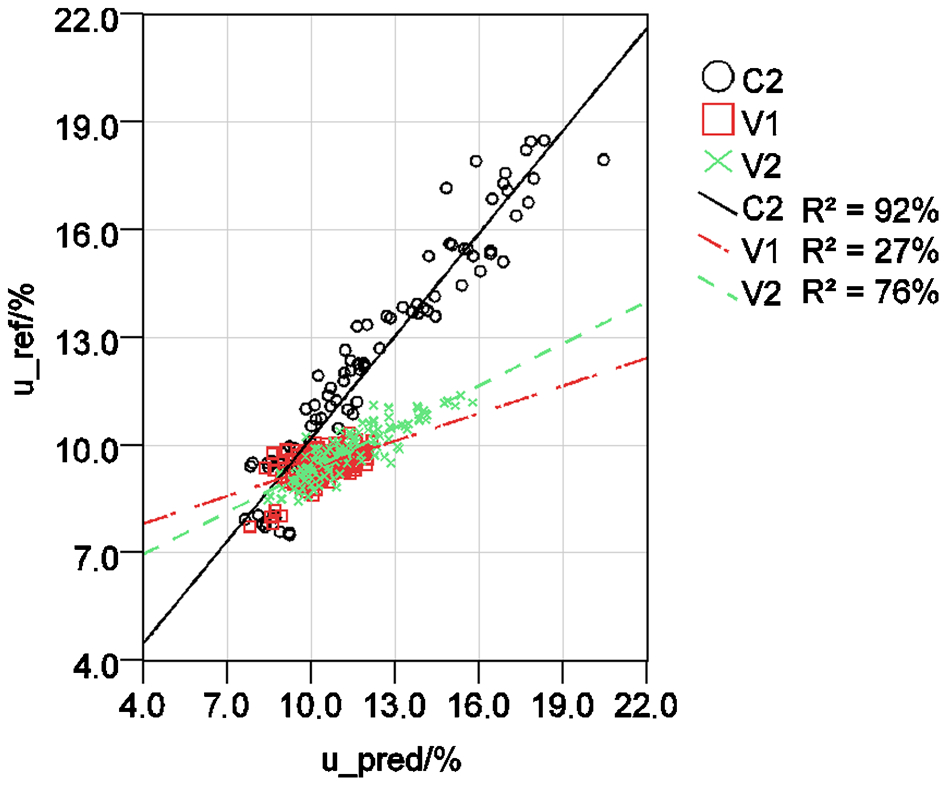
Reference versus predicted moisture content separated for series (Table 1), n = 394 specimens
To further evaluate the prototype's results, Fig. 6 compares the measurements of the resistance moisture meter uelec with the reference uref separated for series (Table 1). The calibration series ‘C2’ only includes 71 measurements at the resistance moisture meter leading to 370 specimens in total. The R2 values show a good accordance with those of Fig. 5 leading to the assumption that the microwave prototype is at least as good as a resistance moisture meter. The moisture content based on resistance moisture meter uelec shows four values below 7% which do not exist in the reference moisture content uref. These four electrical measurements are false measurements by the resistance moisture meter.
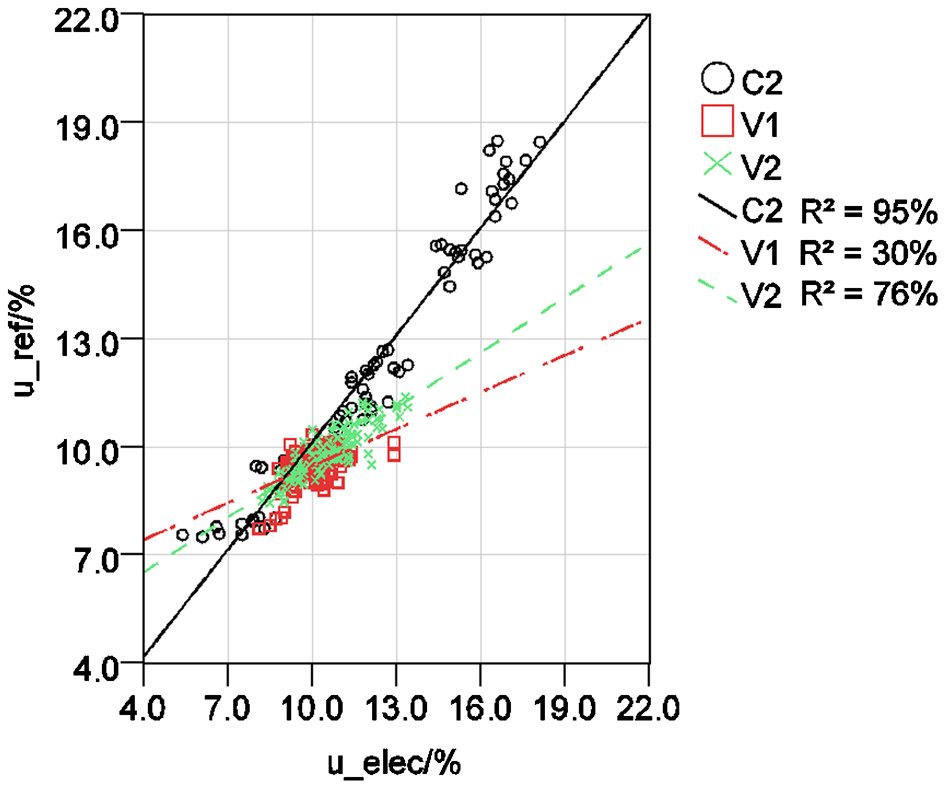
Reference versus electrical moisture content using resistance moisture meter separated for series (Table 1), n = 370 specimens
Prediction of density
The density prediction is also trained on series ‘C1’ with ρref as reference. Stepwise linear regression including all 5 parameters leads to equation (2):

The predicted density is based on phase shifts φv and φu, thickness sthick and attenuation attu. Again, attenuation attv does not improve the prediction. Figure 7 shows the reference density ρref versus the predicted density ρpred for series ‘C1’ with
 .
.
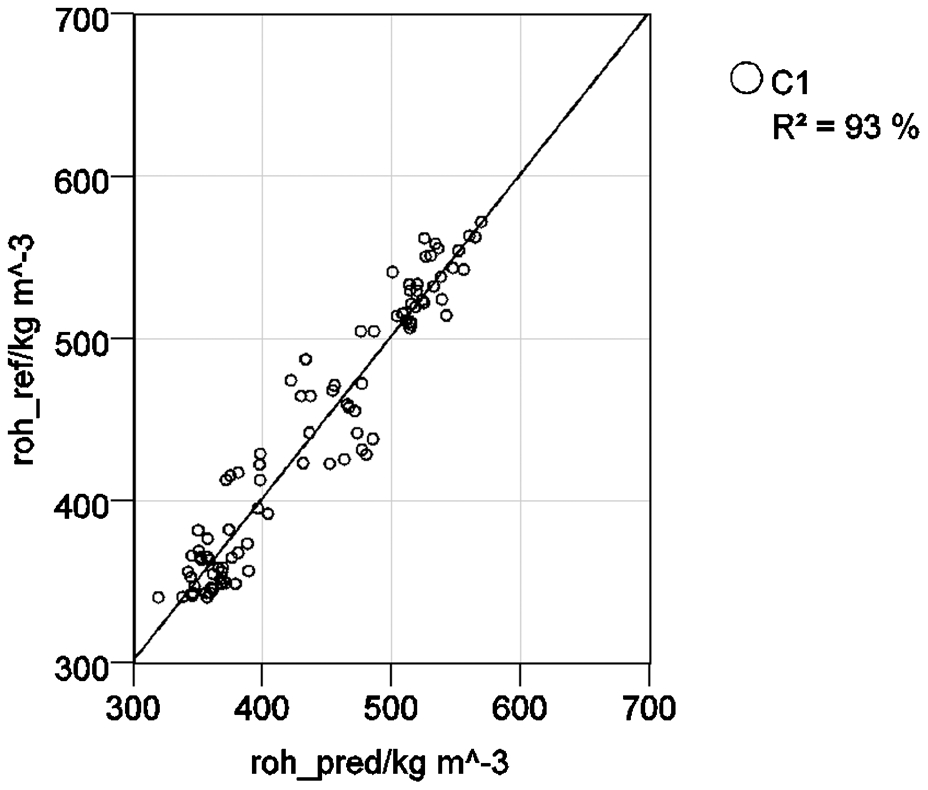
Reference versus predicted density of calibration series ‘C1’, n = 95 data sets
For testing, equation (2) is used to predict the density of all three remaining series. Figure 8 compares the results graphically. Equivalent to moisture content, the results for ‘C2’ are in line with the training ‘C1’ supporting the assumption that also the calibration for density is not limited to the training setup. The validation series ‘V1’ and ‘V2’ show a parallel displacement of the regression lines compared to series ‘C2’. As the microwave prediction of moisture content for the ‘V1’ and ‘V2’ slightly overestimates the moisture content (Fig. 5) the density compared to the reference data is increased. The coefficient of determination varies between
 and
and
 .
.
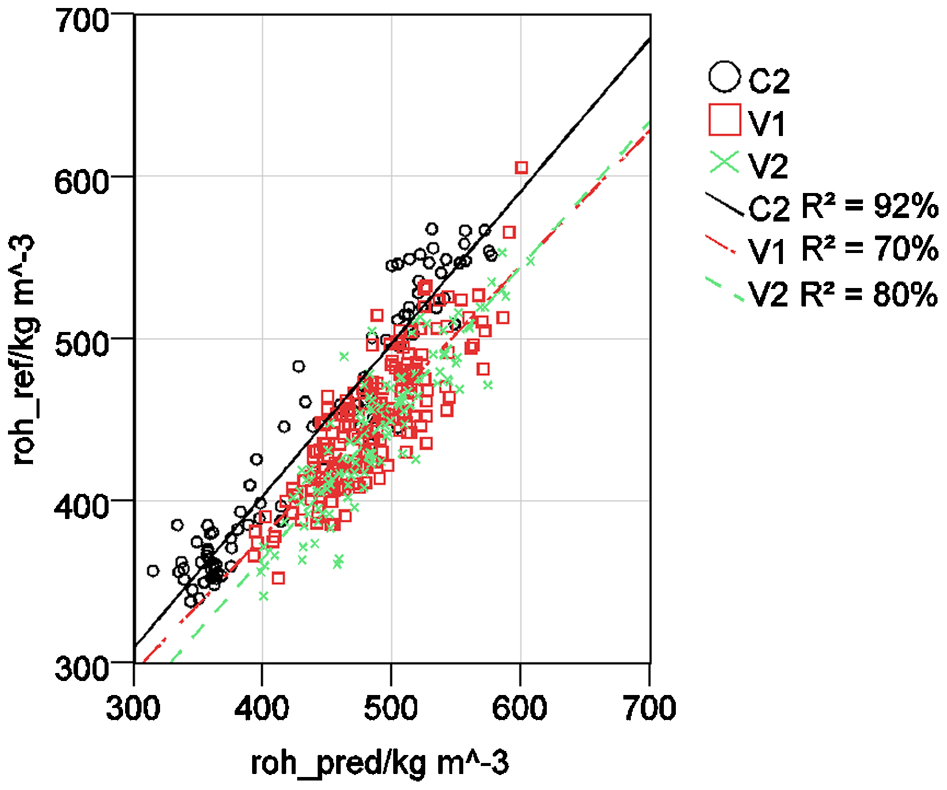
Reference versus predicted density separated for series (Table 1), n = 394 specimens
Discussion
The presented new and innovative microwave prototype is able to predict moisture content and density in the range of industrial needs. For moisture content prediction three parameters are necessary to get satisfying results. The obtained R2 values higher than 90% for calibration indicate a high prediction quality whereas series validation showed much lower values with
 and
and
 . This is mainly based on a low moisture content variation for the validation sets. Small variances mathematically lead to lower R2 values. The predicted moisture contents of the validation series are higher than the reference moisture contents. The calibration series were measured on clear timber whereas the validation series were measured within an area where defects like knots or resin pockets were present. These defects can influence the microwave measurements due to their different dielectric properties compared to defect-free wood (Baradit et al. 2006; Forrer and Funck 1998; Kaestner and Bååth 2000; Martin et al. 1987; Nguyen et al. 2004). This effect is included in the measurements but negligible as the scanning area over a length of 720 mm includes much more defect-free timber which overrules these small variations. To compare our results with other systems available Table 2 lists some systems for moisture content determination using microwave transmission and their coefficient of determination.
Overview of comparable systems for moisture content determination
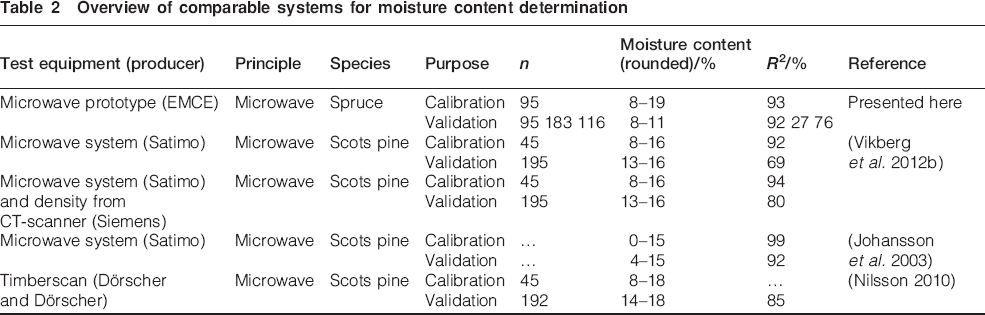
Comparing all moisture content measurement techniques below fibre saturation the prototype achieves as high R2 values as other microwave systems, e.g. (Johansson et al. 2003; Nilsson 2010; Vikberg et al. 2012b). Johansson et al. (2003) reports the highest R2 values for calibration
 and validation
 . In both investigations the samples for calibration and validation are based on the same population randomly divided leading to these high
 values. If independent sets are used for calibration and validation (e.g. Nilsson 2010; Vikberg et al. 2012b) the
 ranges from 69 to 85%. With an
 the moisture content results of this investigation are reasonable. Compared to other measurement systems e.g. ratio frequency/high frequency (Nilsson 2010), resistance/capacitance based (Forsén and Tarvainen 2000) or X-ray CT scanner (He and Qi 2013; Cai 2008) the variation of validation R2 increases to a range of 54–96%. The tested microwave system lies in the upper end of this range showing the microwave prototype as a suitable alternative.
For density prediction, the microwave system uses four parameters to achieve R2 values higher than 90% in training and testing. Within validation the R2 values slightly decrease (
 and
and
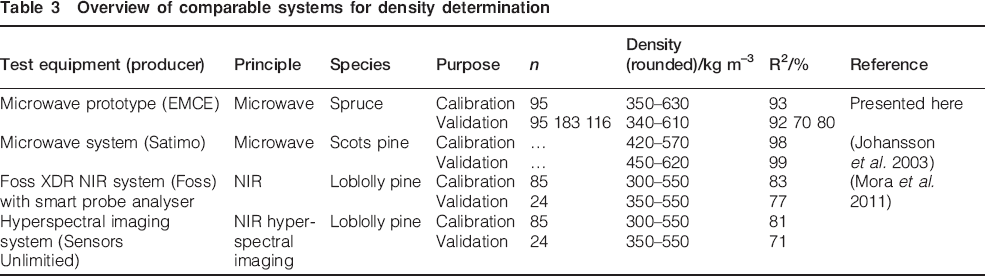
 ). Table 3 lists other systems for density determination using microwave transmission or NIR in the range of 300 to 630 kg m–2 for different species. Again the prototype of this paper provides comparable results to other microwave system e.g. Johansson et al. (2003) with slightly lower validation R2 values which is feasible as validation series used in this paper are independent from the same population. Also for VIS/NIR systems and the hyper spectral imaging systems, resp., comparable R2 values are obtained. With R2 values between 94 and 99% (He and Qi 2013; Taylor 2006; Macedo et al. 2005) the CT scanner systems still strikes the microwave prediction.
Overview of comparable systems for density determination
Conclusion
This paper shows the potential of a microwave prototype to measure moisture content and density of spruce specimens.
The prototype is able to predict moisture content with a coefficient of determination of up to 93%. Using two independent validation series the R2 values decreased to 27 and 76%. Low variance in moisture content is the reason for the low R2 value. Compared to a resistance moisture meter measurement on identical specimens the R2 values are competitive and achieved contact free. Compared to other moisture content meters similar results were achieved. The main advantage of this system is the contact free detection of moisture content. A major disadvantage is the edge effect during the measurement with microwaves which needs to be compensated (Denzler et al. 2013). This paper only deals with results below fibre saturation point although the methodology is capable of determining moisture content above fibre saturation point with high accuracy (Johannson et al. 2003).
Density prediction is also very satisfying with an R2 value higher than 90%. Using two independent validation series the R2 values decreased to 70 and 80%. Compared to other density measurement systems only the CT scanner achieves higher R2 values for validation. As the system can detect moisture content even for wet timber, the density prediction also seems possible above fibre saturation.
The results show that the technology itself as well as this prototype is promising to predict moisture content and density with a high accuracy, contact free and in one pass. First results indicate that this is not only true for spruce but also working on other timber species.
Footnotes
Acknowledgements
This work was supported by the Austrian Research Promotion Agency – FFG and Wirtschaftsagentur Wien – ZIT within the COMET K-project ‘HFA-TiMBER A.1·3’, (project nr. 820501). We also thank our project partners DOKA Group Austria, MiCROTEC s.r.l, the institute EMCE of the Vienna University of Technology and BOKU – University of Natural Resources and Life Sciences, Vienna.