
Abstract
This study quantified the spatial distribution of moisture content and basic density within Cryptomeria japonica branches using near-infrared (NIR) hyperspectral imaging and multivariate data analysis techniques. The hyperspectral data for wood disk samples were acquired using a Compovision NIR Composition Imaging System (Sumitomo Electric Industries, Ltd., Yokohama, Japan) with a spectral range of 913–2519 nm. The calibration models for prediction of moisture content and basic density were developed using partial least squares (PLS) regression analysis. The PLS model for moisture content and basic density showed good predictive performance with coefficients of determination 0·82 (RMSEP = 12·4%) and 0·84 (RMSEP = 28·0 kg m−3) respectively. The spatial distribution of predicted moisture content clearly detected the low moisture white zone surrounding the heartwood. The high density compression wood could be also visualised with the NIR hyperspectral imaging technique. The results presented here provide useful information for development of a novel log sorting method.
Keywords
Introduction
Rapid and cost-effective methods for evaluating wood properties are essential for the modern wood industry. A number of studies have demonstrated that near-infrared spectroscopy (NIRS) has excellent potential for rapid and non-destructive assessment of various wood characteristics, such as chemical components, and physical or mechanical properties (Tsuchikawa 2007; Tsuchikawa and Schwanninger 2011; Lazarescu et al. 2014; Watanabe et al. 2011, 2012). However, because NIRS generally measures a small sample area, data obtained by this technique do not contain spatial information. Wood has spatially variable texture and thus measurements on small areas are not suitable for inspecting whole wood products.
Recently, the hyperspectral imaging technique has been implemented in a variety of fields (Gowen et al., 2007). Moreover, the technique can be used in a wide range of wavelengths including the NIR region due to recent progress in InGaAs photodiode array detector technology. NIR hyperspectral images consist of three-dimensional array data, known as hypercubes (Burger and Geladi 2006; Geladi et al. 2004). The first two axes (x and y) of the matrix are the vertical and horizontal pixel coordinates, while the third (z) axis represents the spectral dimension. As with single point NIRS, the hypercube data can be used for regression or classification analyses with general chemometric techniques. The first example of NIR hyperspectral imaging for wood evaluation was published by Thumm et al. (2010) for Pinus radiata. In that study, two-dimensional mapping of the chemical composition of the transverse face of cross-sectional wood disks from trees were presented. Mora et al. (2011) developed a calibration model for determining the basic density (BD) and moisture content (MC) of pine disks and confirmed that the method predicts these parameters with high accuracy. Further, Kobori et al. (2013) applied the method to monitor MC variation during the drying process.
Sugi (Cryptomeria japonica) has been planted intensively since the middle of last century, and its afforestation area accounts for about 50% of the total tree plantation area in Japan (Forestry Agency 2013). However, lumber from sugi plantations shows large inter- and intra-tree variation in wood properties (Fujisawa et al. 1992). Rapid assessment of variation in these wood properties is necessary for sorting logs and lumber into appropriate end uses.
The aim of this work was to quantify the spatial distribution of MC and BD within sugi stem using NIR hyperspectral imaging and multivariate data analysis techniques. The results presented here will provide information useful for developing a novel log sorting method.
Experimental
Sample disks were obtained from nine individual sugi trees that were grown in 40-year-old stands in the Tottori University Forest (35°16'N, 133°36'E; approximately 540 m elevation). One of these nine trees was leaning to a remarkable degree, and thus its wood disks showed clear eccentric growth. The disks were put into plastic bags and stored in a dark room until NIR measurements were taken in order to avoid a rapid drying. Disk surfaces were processed using a crosscut saw.
Hyperspectral images were acquired using the Compovision NIR Composition Imaging System (Sumitomo Electric Industries, Ltd., Yokohama, Japan). The system is shown schematically in Fig. 1. The NIR spectroscopic camera comprises a spectroscope and two-dimensional NIR detecting chip covering the spectral range from 913 to 2519 nm in increments of 6·34 nm. The X-axis and Z-axis of the chip correspond to the spatial direction and wavelength respectively. By moving the sample while taking hyperspectral images repeatedly at a high frame rate (the maximum frame rate of 320 fps), two-dimensional images with spectral data can be processed. Two current controlled quartz-halogen lamps provide illumination and the image area of the field of view is 182·7×153·6 mm. The camera can process hyperspectral data of 320×256 pixels with a nominal spatial resolution of 0·32×0·48 mm/pixel.
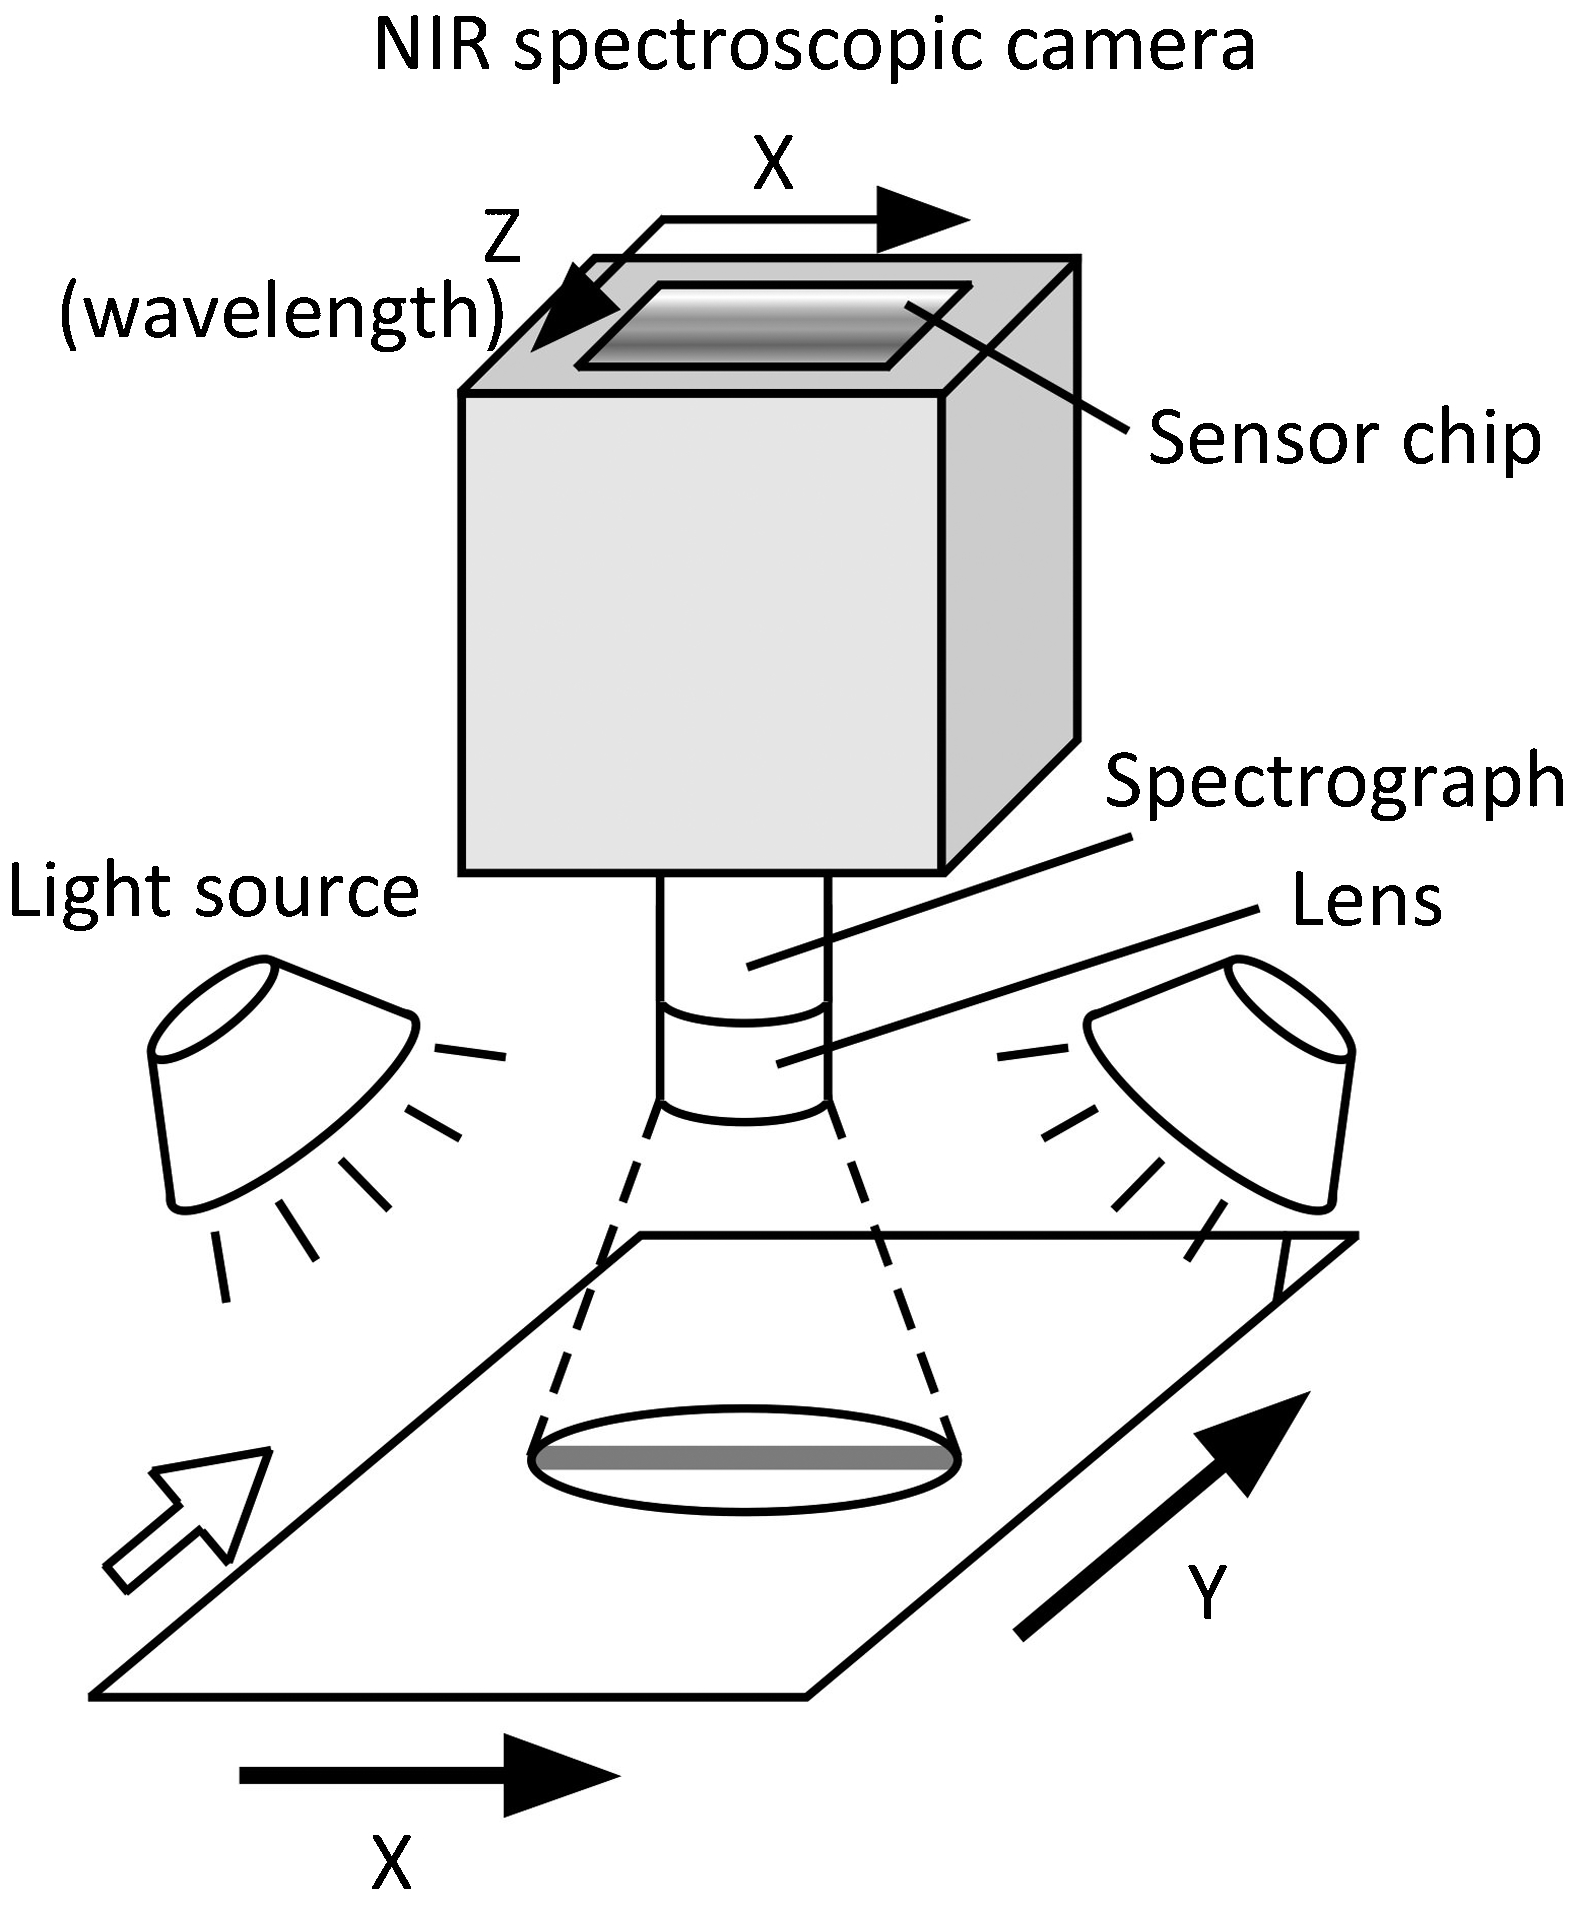
Schematic of near-infrared hyperspectral imaging system
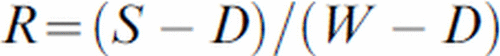
To correct the sensitivity of each single pixel and optical non-uniformity, the hyperspectral images were first corrected with white and dark references. The reflectance image (R) was estimated by the following formula
After acquisition of images, disks were cut into small, 20-mm-square blocks (Fig. 2). MC and BD were measured using these blocks. The water displacement method (Olesen 1971) was used to determine the BD of the samples. The total number of sample blocks used in the present study was 193. The reflectance spectra corresponding to the location of each block were averaged into a single spectrum. Several spectral preprocessing techniques were applied, and the standard normal variate technique exhibited the best ability to predict MC and BD. The calibration models for prediction of MC and BD were developed using partial least squares (PLS) regression analysis. Data analysis was performed using the pls package (Mevik et al. 2013) in R version 3.0.0. Predicted values from PLS models were visualised on the wood disks to examine the variation in and distribution of each trait.
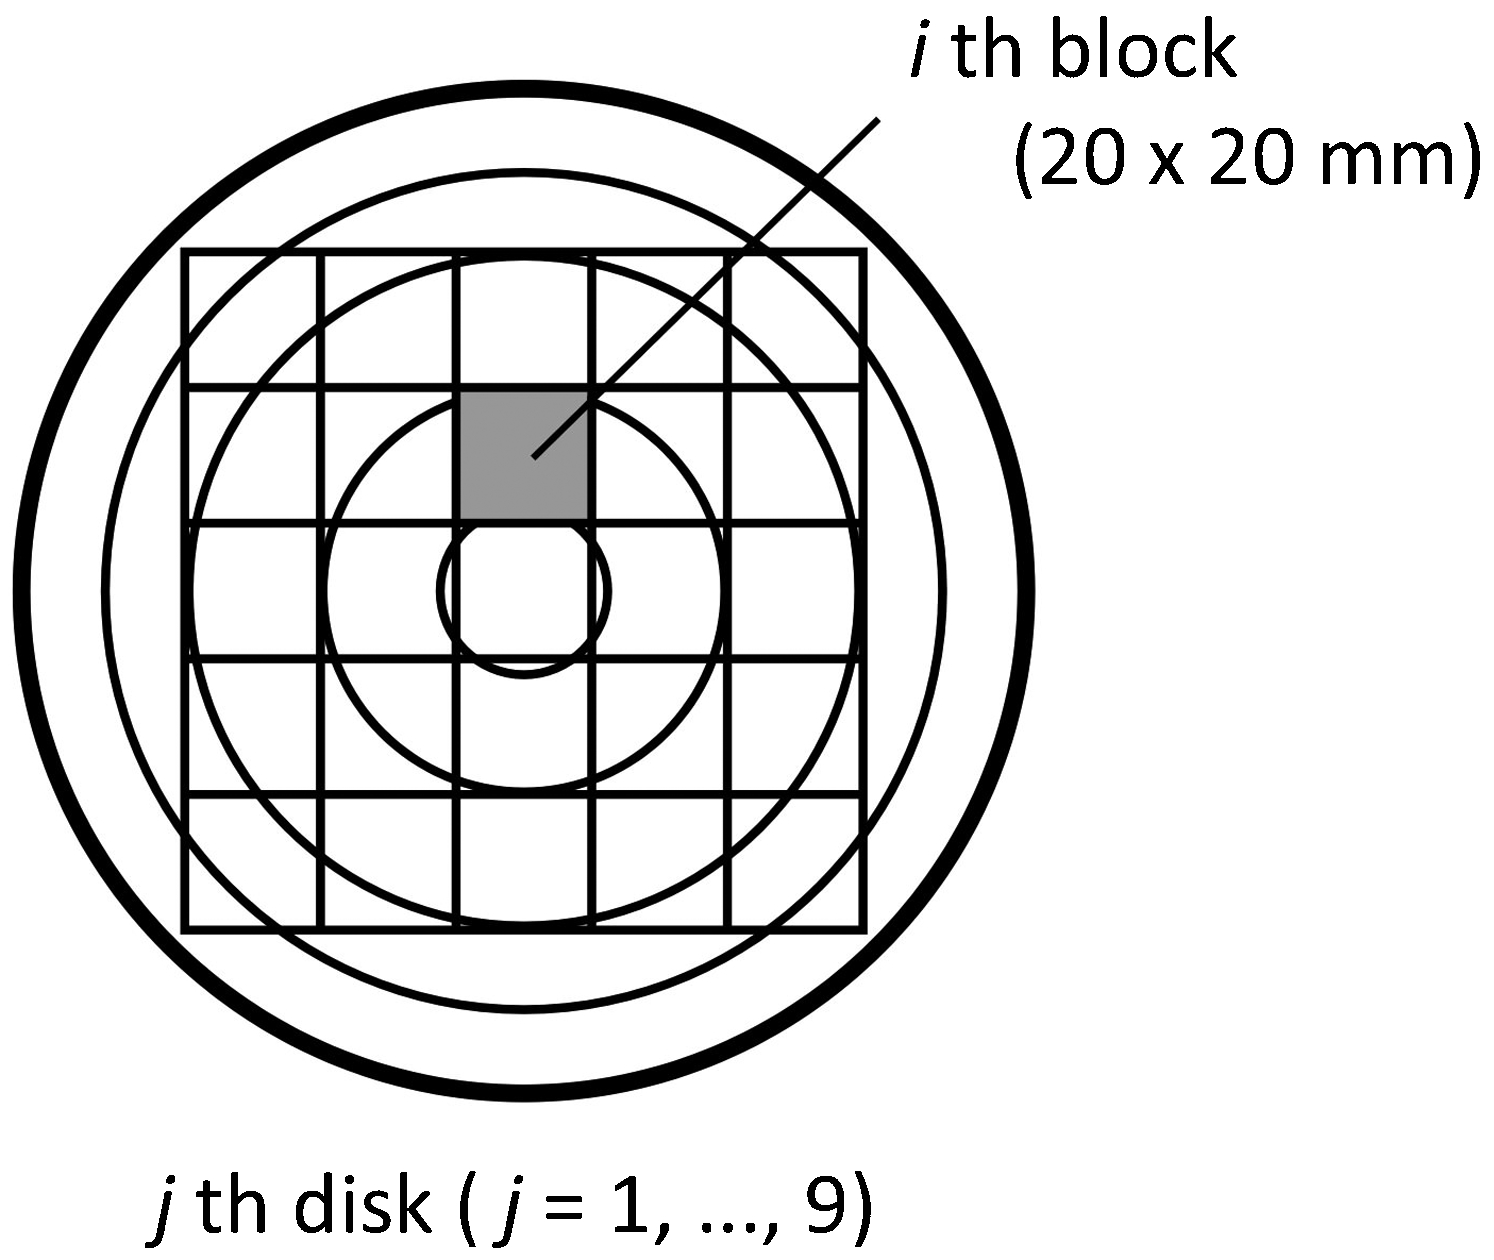
Sample preparation for measurement of moisture content and basic density
Results and discussion
All spectral data were split randomly into the calibration and test sets, which consisted of 136 and 57 samples respectively. MC measured using the conventional method ranged from 27 to 161% in the calibration set [mean = 61%; standard deviation (SD) = 31%], and ranged from 27 to 140% in the test set (mean = 59%; SD = 30%). BD measured using the conventional method ranged from 265 to 711 kg m−3 in the calibration set (mean = 370 kg m−3; SD = 82 kg m−3), and ranged from 273 to 634 kg m−3 in the test set (mean = 365 kg m−3; SD = 70 kg m−3). These results indicate that both traits showed high levels of inter- and intra-tree variation.
PLS analysis was performed to predict MC and BD. There were strong relationships between measured and NIR-predicted calibration values for MC and BD, with coefficients of determination 0·88 and 0·82 respectively. Both calibration models were successfully applied to the test sets, with coefficients of determination of 0·82 (root mean square error of prediction (RMSEP = 12·4%) and 0·84 (RMSEP = 28·0 kg m−3) respectively. The ratio of performance to deviation (RPD), calculated as the ratio of the standard deviation of the reference data to RMSEP, was 2·5 for MC, and 2·9 for BD.
Based on the calibration models, predicted values of MC and BD in each pixel were mapped onto the wood disks (Fig. 3a and b). The spatial distribution of predicted MC clearly detected the white zone, which has low MC, surrounding the heartwood. Moreover, the compression wood, which exhibits high wood density, could be also visualised in the regions of eccentric growth.
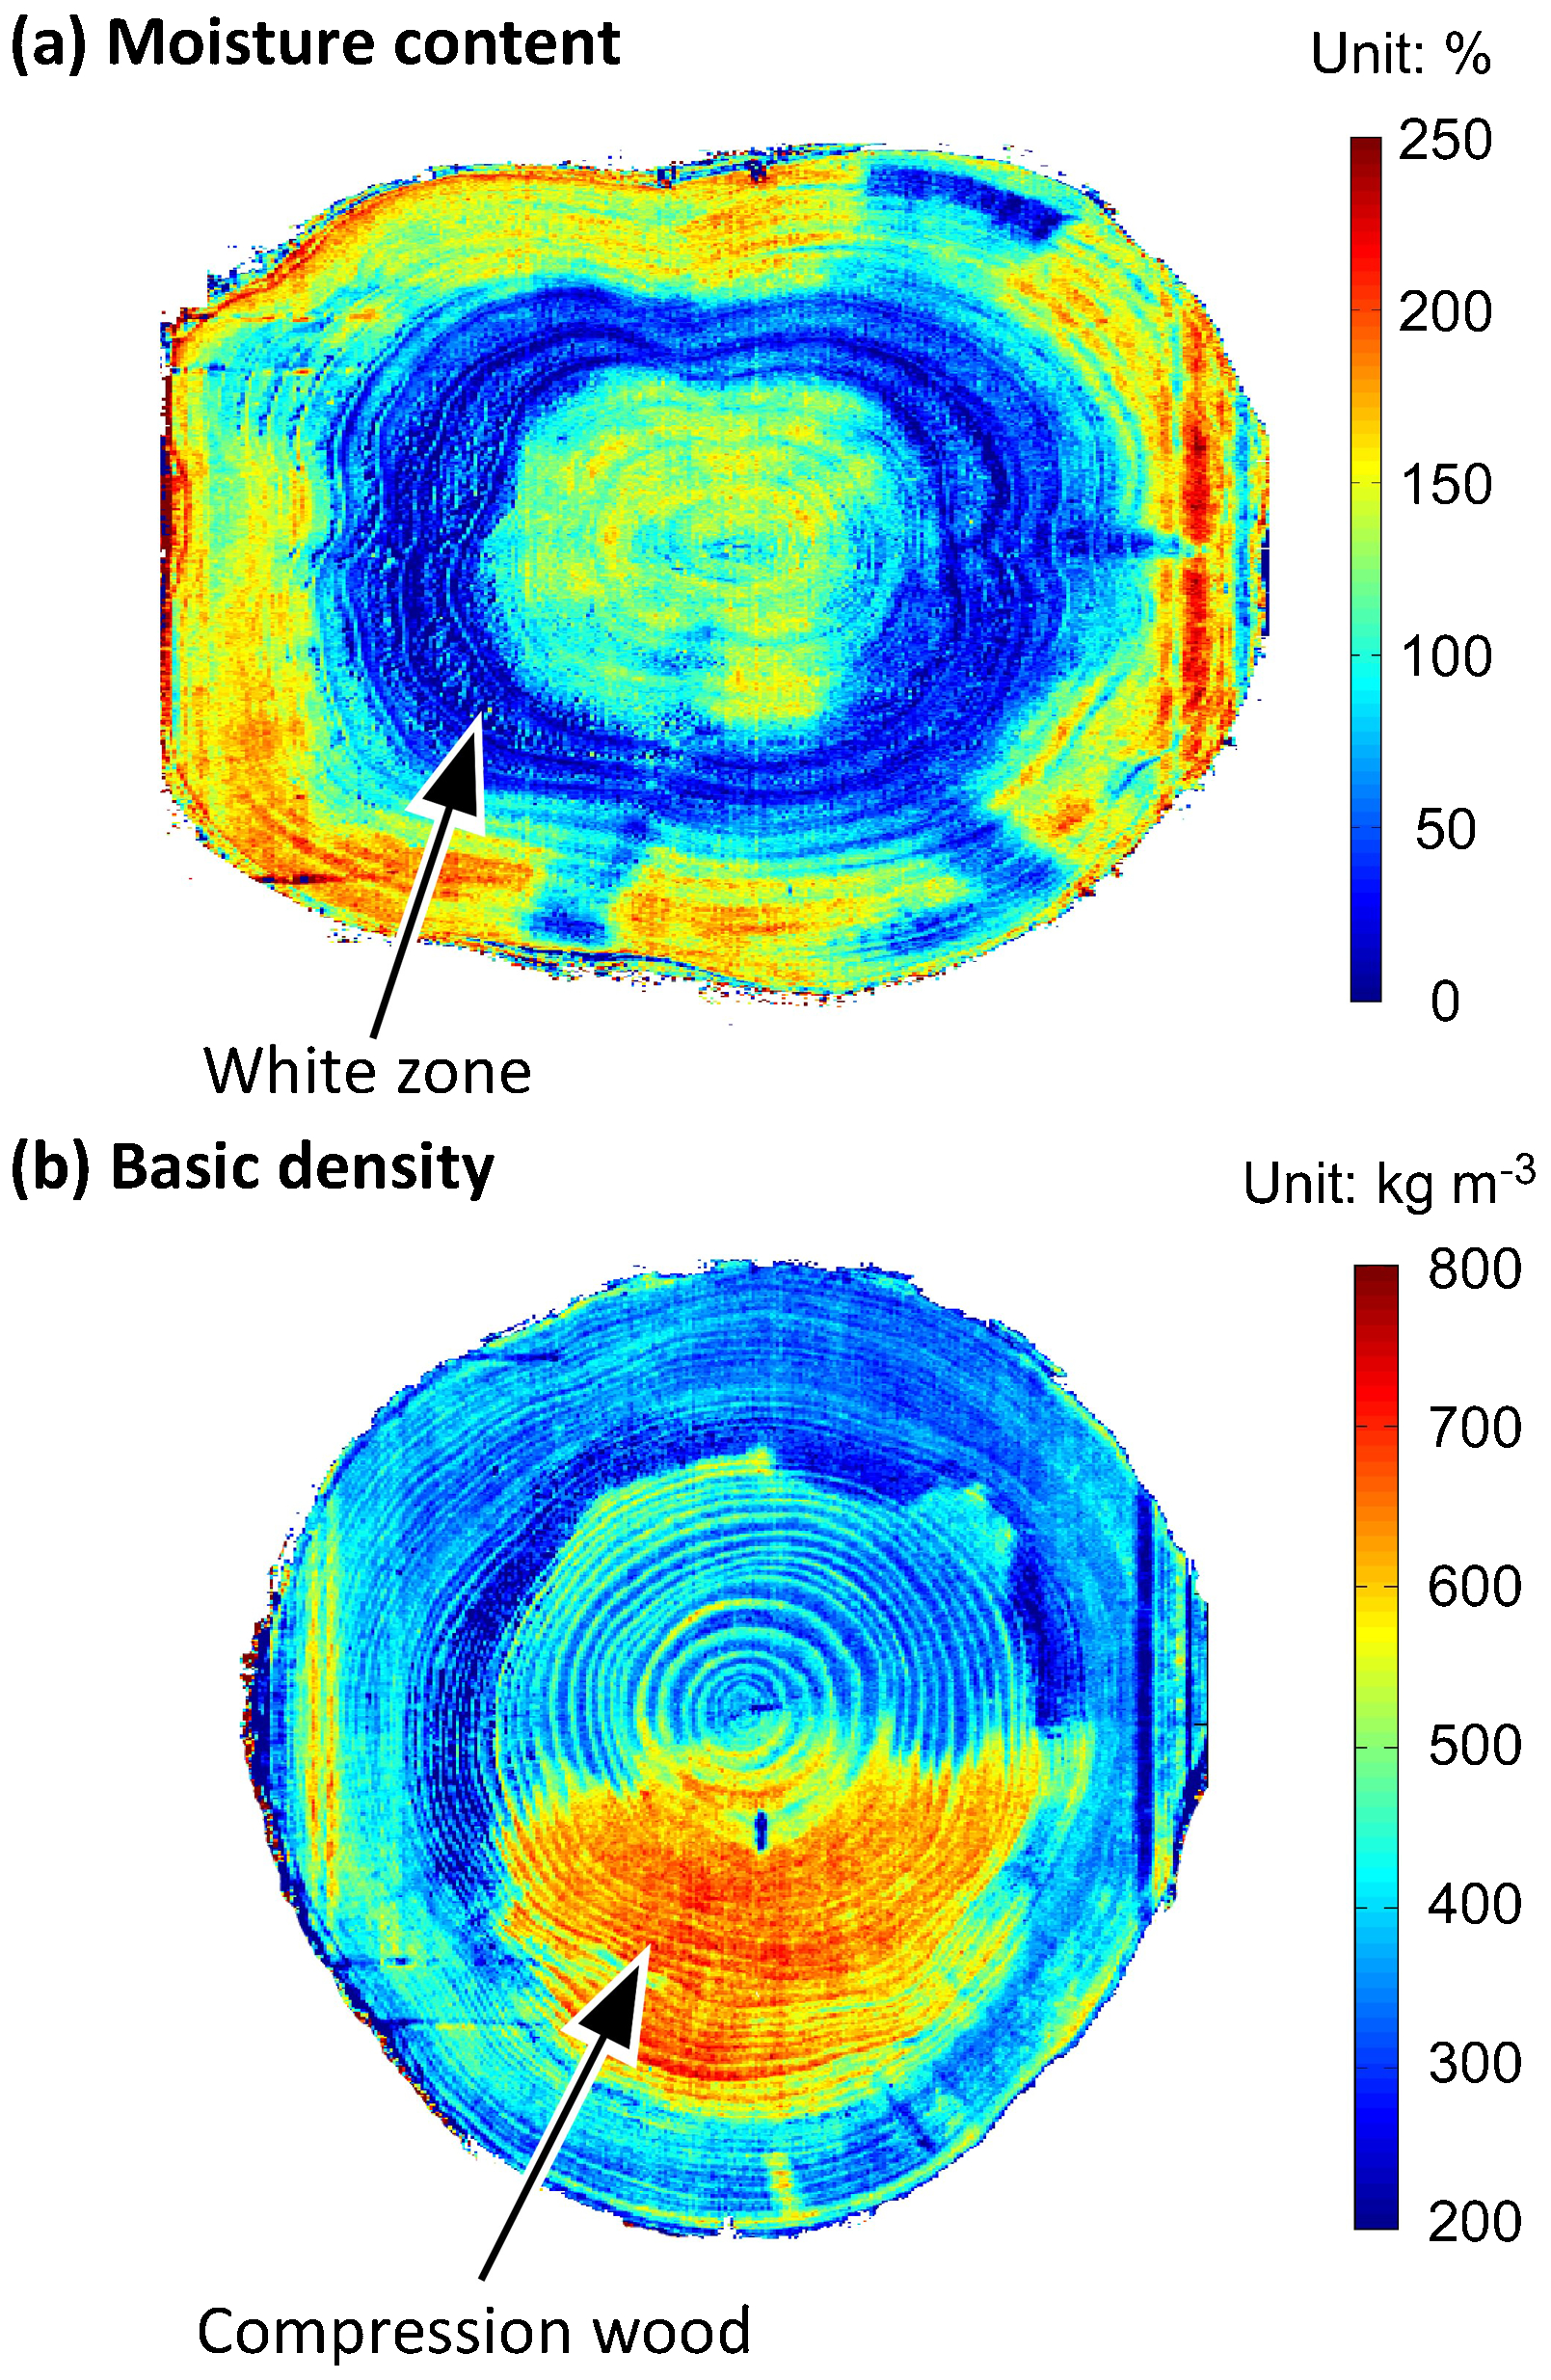
Two-dimensional distribution of near-infrared-predicted a moisture content and b basic density in wood disk
This study clarified that the NIR hyperspectral imaging method can accurately evaluate spatial variation in wood properties such as MC and BD. Our previous study demonstrated that variation in wood stiffness within logs could be evaluated using NIR spectra from log cross-sections (Fujimoto et al. 2013). Hence, the NIR hyperspectral imaging method presents a promising new technique that will improve the assessment of various wood properties of logs.
Acknowledgement
This study was partly supported by a Grant-in-Aid for Scientific Research from the Japan Society for the Promotion of Science (grant no. 25292102 to Satoru Tsuchikawa).