
Abstract
This study examines the strategic investment choices made in pulp and paper industry (PPI) within the last two decades. We first describe investments, initiated projects, and closures of pulp and paper mills and profitability of the 22 largest pulp and paper companies in North America, Western Europe and Japan. We then examine the development and impact of R&D investments by comparing the timing of R&D investments with changes in profitability. The results indicate that the relationship between R&D and profitability is company specific. Our findings indicate further that the logic of R&D investment differs across firms; in some companies, changes in profits cause changes in the R&D investment level, whereas in others the opposite holds. It also seems that the sample companies have not actively sought new market opportunities through innovation activity, but rather by geographical re-location of production.
Introduction
During the development of an industry from the emergence to the maturity phase, the economic landscape changes in many ways. The demand conditions and the nature of market structure evolve over the industry life cycle. In many industries, during the early phase of an industry's development, competition is primarily based on product characteristics and product innovations are significant drivers of an industry's development, but as the industry matures, the products become more standardised and price competition increases (Malerba and Orsenigo 1996, see also Windrum 2005). This has an effect on the economic performance of companies. Intensified competition reduces price–cost margins. During this phase, efficient scale of production rises, mass production in manufacturing becomes common and capital intensity increases because of economies of scale (Utterback 1994, p. 95). In innovation activities, the emphasis shifts from product innovations towards process innovations and cost reduction (Abernathy and Utterback 1988). Finally, when demand growth levels off, the risk of overcapacity is obvious, especially in industries where the investment costs of machinery and plants are high and have long technical lifespans.
When the industry evolves either gradually or through more radical, discontinuous changes, firms face pressure to adapt their activities in keeping with industry changes to remain viable (Jantunen, Sandström and Kuittinen 2009). As an industry evolves towards maturity and decline, firms are confronted with the problems of declining demand and profitability. When the average revenues in the industry are flattening out or diminishing, firms have to find new sources of profits to succeed. New opportunities can be sought from new products or new markets, and hence, firms may seek growth, either by investing in R&D or accomplishing strategic reorientation towards markets in new geographical areas (Kinkel, Kleine and Diekmann 2014; Slepniov, Waehrens and Johansen 2014). Through R&D and other strategic activities, companies may create new knowledge and innovations, develop new capabilities and gain new customer groups.
Companies may renew their business with proactive or reactive strategic reorientations. Often decreased profitability is the factor that triggers organisational changes: ‘Performance below a company's aspiration level has been shown to cause strategic reorientation and firm risk taking’ (Greve 2003, p. 696). Decreased performance may initiate investments that aim to achieve new markets or build new business lines. One possible way to tackle the problem of declining profitability is to invest in R&D to develop new products or to achieve cost savings through process innovations. However, according to the previous literature, the relationship between R&D and performance is not straightforward. On the one hand, R&D can be a reaction to the organisational decline. For instance, by studying the shipbuilding industry Greve (2003) found that companies invested in innovations in response to low performance. Berchicci, Tucci and Zazzara (2014) found that in downturns companies seek for new potentially profitable products, and especially invest in product innovations rather than process innovation. On the other hand, the organisation may decrease the R&D investments during the decline, because of the need for cost savings. Furthermore, there may be bidirectional connection between performance and R&D, leading to circular and cumulative relationship (Bogliacino and Pianta 2013). Hence, in the light of previous research, the relationship between R&D and performance is complex. The role of R&D and nature of innovation activities depend also on industry context (Pavitt 1984; Knott and Posen 2009).
The previous empirical studies suggest that the annual R&D investments reported by the pulp and paper industry (PPI) companies have been relatively low compared to many other industries. For example, according to Norberg-Bohm and Rossi (1998), in the US, PPI R&D expenses as a percentage of sales are approximately 1%, whereas the average for all manufacturing industries is 3%. The average R&D intensity over the last 20 years in the largest European PPI companies is < 1%. One reason for the low figures may be that product differentiation is difficult because of the ease of imitation among the leading companies in the industry (Ghosal and Nair-Reichert 2007). Second, on the process side, instead of developing technology in-house, new technology is often purchased from or developed in collaboration with suppliers (Ghosal and Nair-Reichert 2009). del Rio González (2005) found that as much as 75% of the clean technologies (e.g., wastewater treatment, chlorine free bleaching, etc.) adopted by Spanish PPI companies was provided by suppliers, whereas 20.5% was developed in cooperation with suppliers and only 4.5% was developed within the company. However, the reported R&D investment does not provide an accurate picture of innovation activity in the industry because the incremental development or innovation activity that occurs at the mill level is not reflected in the reported R&D Figs. (Laestadius 1998; Ghosal and Nair-Reichert 2009). In a case study, Laestadius (1998) found that only 21% of the total development cost of certain energy efficient pulping equipment that was developed through the cooperation of an equipment manufacturer and a paper mill was registered as R&D expenditure by either of the two parties. However, productivity enhancing incremental innovation may increase production capacity by approximately 1.5–2% per year, which in the long run may result in competitive differences between companies (Ghosal and Nair-Reichert 2007). This type of innovation promotes survival (Cefis and Marsili 2006), but is not likely to open new market opportunities.
The aim of this study is to examine how PPI companies have responded to the changes in their operating environments and perform a detailed examination of an industry in transition. Authors concentrate especially on changes in location and production choices, and R&D activity. Authors first explore the strategic changes of the 22 large PPI companies in traditional paper production areas (North America, Western Europe and Japan) by examining the types of investments and closures implemented by the companies at both the mill level and the machine/line level. Second, we investigate the geographical aspects of these changes throughout much of the world. Third, we test the relationship between R&D investments and firm profitability by using a cross-correlation analysis to determine whether the relationship between R&D and profitability is company specific.
Research methods
Data
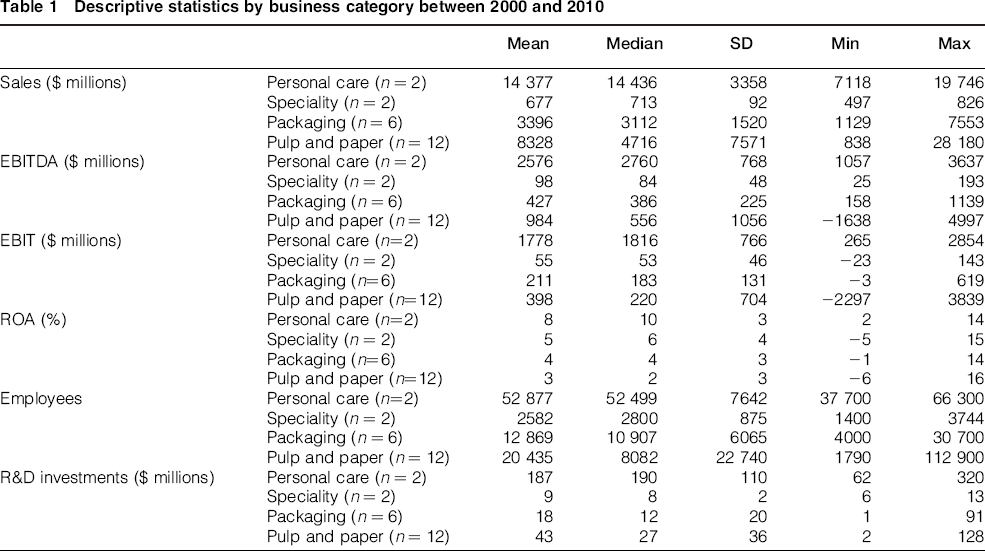
Our sample consists of 10 North American, 5 Western European and 7 Japanese PPI companies. The 22 companies were selected from among the top 100 forest, paper and packaging industry companies ranked by PricewaterhouseCoopers (2010), based on data availability. Paper machine manufacturers and other companies representing other branches of the industry were excluded. For the relevant set of companies, further information (sales, profitability measures and R&D investments) was gathered from the Thomson One Banker database. Capacity changes and the location, type and current status of the mill projects of the selected companies were gathered from RISIs Mill Asset Database during autumn 2012. Some companies in our sample are focused entirely on one area of the pulp and paper business, such as packaging, while the others have multiple business areas. On the basis of the companies’ business segment information, they were classified into four categories: Personal Care (2 companies), Speciality (2 companies), Packaging (6 companies), and Pulp and Paper (12 companies). Table 1 provides descriptive statistics for the categories. The values in Table 1 show that the Personal Care category has largest volume among the sampled firms and has also been most profitable on average. Relative to sales, R&D investments are the largest in the Personal Care and Speciality categories, approximately 1.3% in each.
Descriptive statistics by business category between 2000 and 2010
Cross-correlation function
The simple correlation coefficient is sometimes inadequate for analysing the relationship between two time series variables. This is the case if, for example, one of the time series has a delayed response to the other series or if both series react to a common shock with a delay. It is also possible that an impact of a shock is not restricted to one period but is distributed to several periods. In these situations, the so-called cross-correlation function is a useful alternative to the correlation coefficient. It can be employed to test the lead–lag relationship between two time series at various lags and leads.
If we have two stationary processes, denoted by Xt and Yt, which constitute a bivariate stationary process, the population covariance of Xt and Yt+k depends only on lag k (Chatfield 2001, p. 27)


Respectively, the sample cross-covariance function is defined as (Chatfield 2001, p. 115)
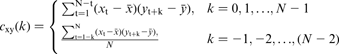
 is the sample mean of the series xt, and
 is the sample mean of the series yt. If the series are stationary, cxy(k) provides an estimate for γxy(k). The sample cross-correlation function providing an estimate for the population cross-correlation function (equation (2)) can be defined now as

Under certain circumstances, the position of the highest cross-correlation may indicate which of the time series is leading the other series. Likewise, the magnitude of this cross-correlation may tell about the strength of the relationship. The problem with the cross-correlation function is, however, that it is not easy to interpret cross-correlation results correctly: the results are highly sensitive to non-stationary and autocorrelation. Therefore, non-stationary time series should be differenced to make them stationary before calculating the cross-correlations.
Results and discussion
Capacity investments and geographical scope of activity
Authors first examine the number of mill closures, greenfield investments and other projects related to the strategic investments made by the sample firms since 1995. The changes have been aggregated at the mill level and the machine/line level. Table 2 presents the different types of investments and closures conducted by the sample firms between 1995 and 2012 at the mill level. The table presents changes in wholly owned mills (own) and changes in partially owned, joint venture (JV) companies.
Mill-level changes by company
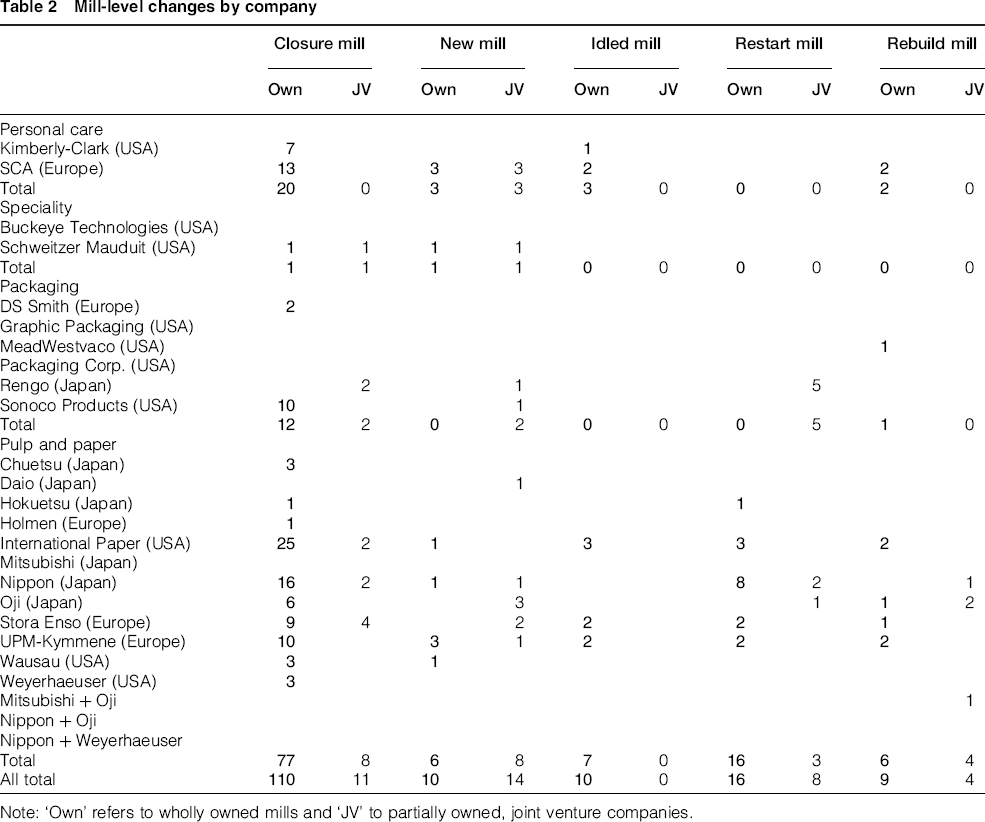
Note: ‘Own’ refers to wholly owned mills and ‘JV’ to partially owned, joint venture companies.
Mill closures have been much more common (110 in wholly owned companies and 11 in joint venture companies) than building new mills (10 and 14). Closures have been implemented in all company categories. Larger companies have been more active in closures than smaller ones. Moreover, new mills have been constructed in all categories, but are most common among joint venture companies, possibly indicating that shared ownership is used as a means of risk management when investing in new mills.
Regarding the changes made at the machine or line level, the rebuilding of machines/lines has been the most commonly implemented project type, as shown in Table 3. In addition to closures, investments in new machines or lines have also been realised. Closures in wholly owned companies were relatively more common than building new machines compared to changes implemented in joint ventures. There are also differences between business categories. In Personal Care, more new machines or lines were developed than the number of old machines removed from service; whereas in Pulp and Paper, closures were more common than building new machines. This could partly reflect the decreased profitability in the pulp and paper sector; however, the difference between the numbers of closed and new machines/lines is small, and therefore the large number of closures may, to some extent, reflect the new geographical centre of production.
Machine/line level changes by company
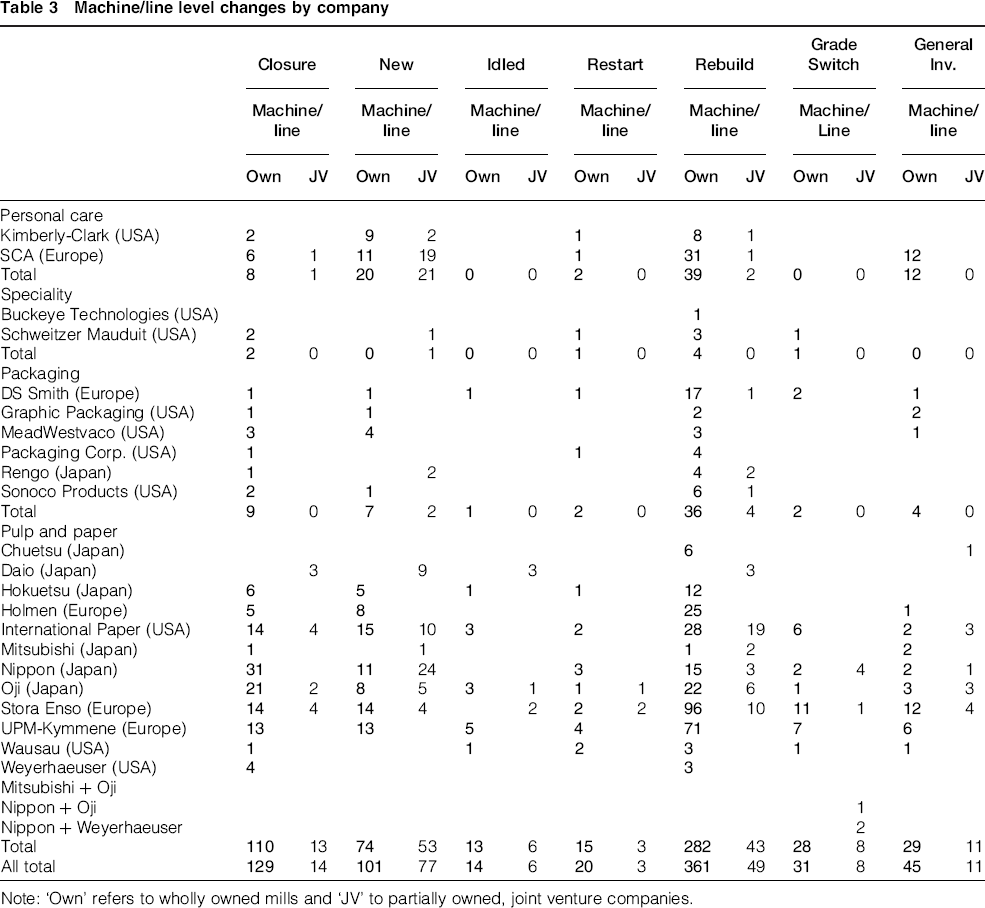
Note: ‘Own’ refers to wholly owned mills and ‘JV’ to partially owned, joint venture companies.
Tables 4 and 5 show the geographical distributions of the different activities. The majority of closures occurred in North America. The high number of closures in Europe and Japan is also remarkable. This is a consequence of overcapacity and diminished paper demand in those markets. Moreover, domestic production in Japan has been replaced by imports from China.
Geographical locations of projects at the mill level
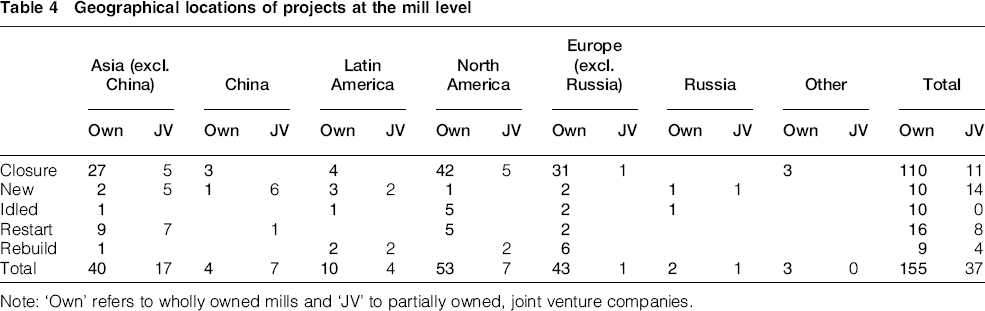
Note: ‘Own’ refers to wholly owned mills and ‘JV’ to partially owned, joint venture companies.
Geographical locations of projects at the machine/line-level
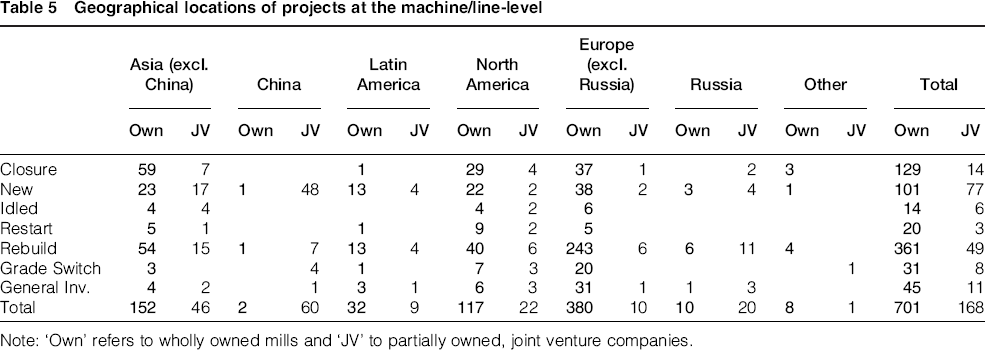
Note: ‘Own’ refers to wholly owned mills and ‘JV’ to partially owned, joint venture companies.
The new mills built in Asia (excluding China) produce pulp (two mills), tissue, office paper, paperboard (two mills), and special paper. In China, six of the seven new mills were built by joint venture companies, and the new Chinese mills produce office paper (two mills), tissue (two mills), special paper, paperboard and magazine paper. Two of the five new mills in Latin America produce pulp, two are tissue mills and one new mill produces office paper. The mill built in North America produces tissue. In Europe, one mill produces tissue and one supercalendered paper. In Russia, the new mills are a pulp mill and a tissue mill. In sum, many of the new mills were built to produce pulp or tissue, but in Asia the investments also include new mills producing office paper, magazine paper and paperboard.
The bulk of mill or machine/line closures were in Asia, Europe and North America, but new machines or lines were also brought into use in these regions. Investments in new machines or lines were most common in Asia, 89 in total. In China, all but one of the new machines or lines were built by joint venture companies. Rebuilding and general investment projects were concentrated in Europe. Rebuilding activities were also quite common in North America and in Asia (Japan). Grade switches were prevalent in Europe, reflecting the shift in market demand (e.g., decreased demand for newsprint).
Regarding the geographical locations of projects (closures or new mills/machines/lines, etc.) at the firm level, it appears that projects are generally located in the company's home country (the headquarters country). However, the large global players, Stora Enso, International Paper, UPM-Kymmene, SCA and, to some extent, Oji appear to focus on growth markets. To determine whether the industry has invested in new openings, we examine the R&D investments of the sampled firms in the next section.
R&D investments and profitability in the PPI
Figures 1 and 2 depict the average R&D investments per sales and average ROA in the companies included in our sample between 2000 and 2010 by business category. R&D intensity in the Personal Care and Speciality paper categories were higher than in Packaging and Pulp and Paper. However, Personal Care and Speciality have also exhibited consistently decreasing R&D intensity over the last decade.
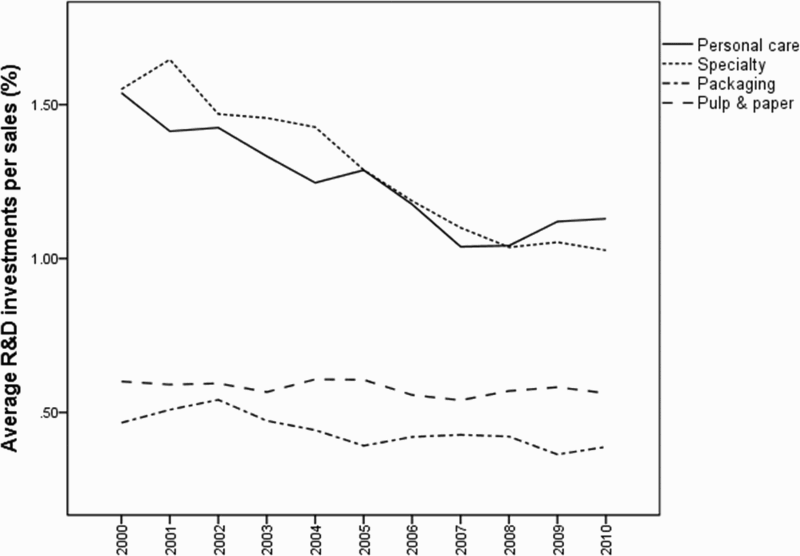
Average R&D investments per sales by business category
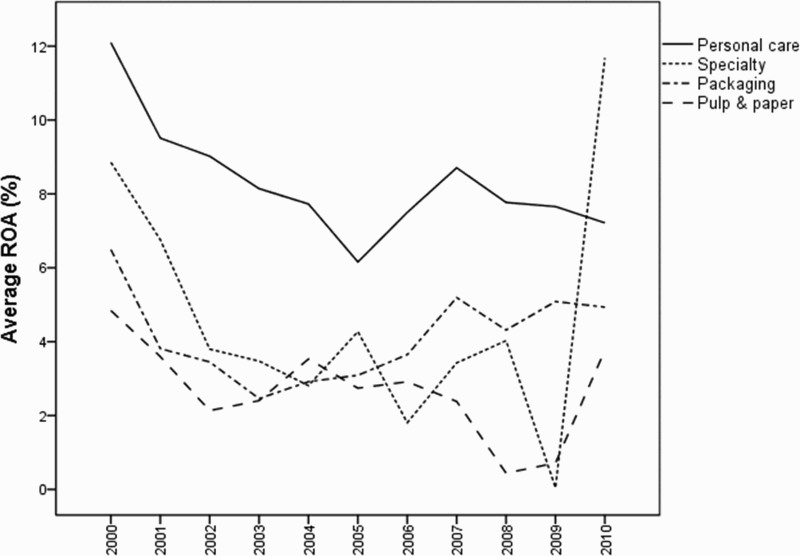
Average ROA by business category
On average, profitability has been decreasing in all business categories. Profitability was highest in the Personal Care. Pulp and Paper was the least profitable category. The sharp, abnormal increase observed for the Speciality paper in 2010 is because of the substantial increase in one company's profitability. Because R&D intensity in the PPI is low and apparently quite stable, we would expect that it could not have a strong effect on profitability at the aggregated level that could be observed in a statistical analysis. In an empirical analysis, Ghosal and Nair-Reichert (2009) did not find a significant relationship between R&D expenditures and the productivity of PPI companies. However, it is possible that companies differ in their R&D intensity-profitability profiles, and therefore, we investigate this relationship using cross-correlation analysis.
Cross-correlations
Cross-correlations are employed to test the lead–lag relationship between R&D investments per sales and ROA at various lags and leads. Cross-correlations help to determine whether one variable is leading the other. Authors used R&D investments per sales as the input variable and ROA as the output variable when categorising the companies into groups using cross-correlation analysis. The maximum number of lags and leads was set at 7 years except for Nippon: Tokyo, Japan (5 years). Augmented Dickey–Fuller tests were employed to test the non-stationary of the variables before cross-correlation analysis. Non-stationary time series were differenced to make them stationary. The results are presented in Table 6.
Cross-correlations: R&D investments per sales and ROA
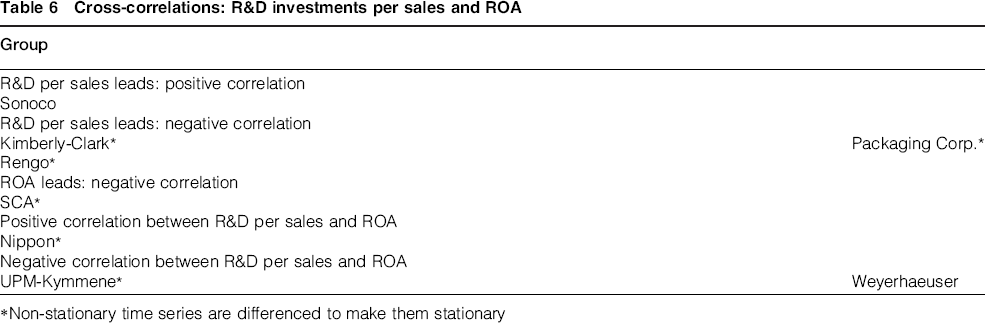
*Non-stationary time series are differenced to make them stationary
Five company groups were identified on the basis of statistically significant cross-correlations. The lag structure between R&D and profitability shows that the impacts of R&D on profitability (or vice versa) were realised within approximately 2 years. One of the companies (Sonoco: Hartsville, South Carolina, USA, a Packaging company) can be described as successfully proactive company, meaning that R&D investments have a positive effect on profitability. In the second group, R&D leads and has a negative correlation with ROA. Three of the companies are included in this group (one Personal Care company, Kimberly-Clark: Dallas, Texas, USA and two Packaging companies, Packaging Corp.: Lake Forest, Illinois, USA and Rengo: Osaka, Japan). The interpretation is that companies in this group do not seek (or attain) profits through R&D. In the next group, R&D follows the changes in profitability. One company (SCA: Stockholm, Sweden, a Personal Care company) is included in this group. The correlation is negative, suggesting that the reaction to decreasing profitability is to invest in R&D. In the last two groups, there is correlation between ROA and R&D, but there is no time-dependent relationship between them. This indicates that there may be a third factor influencing both variables.
Further discussion
Despite the clear need to identify new sources of profit, we have not yet observed any significant changes in the R&D activity of PPI companies operating in traditional markets. This may indicate that these companies do not seek innovation-based growth. This is inline with the findings of Hansen, Juslin and Knowles (2007), which indicate that developing organisational culture in which innovations have an important role may be a challenging task for many of the forest industry companies. If the companies continue to avoid the risks of innovation by outsourcing it to specialised suppliers, they cannot expect any additional profits or improvements in their competitive position. In addition to direct outcomes and financial benefits, R&D activity adds on the ‘absorptive capacity’ of the firm (Cohen and Levinthal 1990). Absorptive capacity increases the ability of the firm to utilise knowledge created outside the company and industry boundaries, and therefore improves the value-creation capacity. Thus, if the firm restrains the R&D activity, it also sets limits to its future options.
As many PPI companies have problems recouping equity costs (Niquidet 2010) and profitability problems are apparent in the industry, new openings are necessary. As PPI companies have little incentive to develop technological innovations because of the rapid diffusion of the benefits of such innovations to competitors (Kivimaa and Mickwitz 2004), a different perspective on innovativeness is required. In innovation activities, products that can be better protected should receive more attention. The development of more efficient production technology delivers costs savings but does not generate new revenue sources. Instead, re-evaluating business strategies may open up new opportunities by delivering new customer types. For instance, recently introduced products, such as biofuels, nanocellulose, and intelligent packaging solutions, offer numerous options for traditional PPI companies to direct their focus to promising new areas.
Conclusions
In this paper, we examined an industry facing broad strategic challenges: the PPI in the Northern Hemisphere. Authors studied the profitability, R&D investments, and changes in production capacity of 22 large PPI companies in North America, Western Europe, and Japan. In general, the studied companies have been quite busy in restructuring the production in terms of production lines and geographic location. It is likely that these changes have required a large part of both their managerial attention and organisational resources. The activity in this type of strategic choices tells that PPI companies have tried to handle the profitability challenges with production-focused actions. Thus, it is not surprising that the innovation activity has not been central during the same period, as the review of R&D indicates. Overall, the examination demonstrates production-oriented ‘dominant logic’ of the PPI.
There are considerable differences between regions with respect to the phase of the PPI life cycle. The increasing use of fast growing tree species as a raw material has further affected what constitutes a competitive strategy in the PPI. Thus, the geographical location of production and consumption and the nature of the business have clearly changed over time. The PPI reacted to these changes by reducing production capacity in mature markets, and a minority of the sample firms has also invested in the growing markets. Traditionally, products in the PPI were undifferentiated, and companies have relied on production technology developed by supplier companies. Therefore, the same technology has been available for all of the companies in the industry. Competition in this sector was not in new products but purely in terms of cost-efficiency. The demand for traditional paper products will continue to grow in Asian markets, but geographically, Asian markets are far away from Europe and North America. The transportation of paper is not economical, and hence, the Asian markets are unlikely to come to the rescue of the European and North American production.
Our empirical findings based on cross-correlation analysis demonstrate that the relationship between R&D and profitability is company specific. This variation cannot be observed when the investigation employs aggregate-level data. On average, the R&D investments are small and of approximately the same size, but companies differ in their ability to profit from R&D investments. Furthermore, our findings indicate that the logic of R&D investment differs across firms; in some companies, changes in profits lead to changes in the R&D investment level, whereas in other companies the opposite logic holds. These results reflect the complex relationship between R&D and profits discussed previously. It is possible that several contingency factors such as company-specific aspiration levels or composition of the organisational slack (absorbed, unabsorbed and potential slack; see Greve 2003) influence on organisational reactions on decline and outcomes of chosen strategic moves. Moreover, companies differ in their value creation capacity (e.g., innovation capabilities), therefore similar R&D inputs result in different outcomes in different companies. In our sample, the relationship between R&D and performance appears to be company specific rather than determined by the shared context (e.g., industry sector).
Our results are subject to some limitations. First, it appears that the early-2000s data on capacity changes and location, type and current status of mill projects may have been partly incomplete. Second, because it is not easy to interpret the sample cross-correlation function correctly (see, e.g., Chatfield 2001), future research might supplement the analysis presented here by additional graphical and numerical tools.