
Abstract
Background
In two-dimensional mammography, a well-known problem is over- and underlying tissue which can either obstruct a lesion or create a false-positive result. Tomosynthesis, with an ability to layer the tissue in the image, has the potential to resolve these issues.
Purpose
To compare the diagnostic quality, sensitivity and specificity of a single tomosynthesis mammography image and a traditional two-view set of two-dimensional mammograms and to assess the comfort of the two techniques.
Material and Methods
One hundred and forty-four women, mainly chosen because of suspicious features on standard mammograms (76 malignant), had a single tomosynthesis image taken of one breast using a novel photon counting system. On average, the dose of the tomosynthesis images was 0.63 times that of the two-view images and the compression force during the procedure was halved. The resulting images were viewed by two radiologists and assessed both individually and comparing the two techniques.
Results
In 56% of the cases the radiologists rated the diagnostic quality of the lesion details higher in the tomosynthesis images than in the conventional images (and in 91% equal or higher), which means there is a statistically significant preference for the tomosynthesis technique. This included the calcifications which were rated as having better quality in 41% of the cases. While sensitivity was slightly higher for traditional mammography the specificity was higher for tomosynthesis. However, neither of these two differences was large enough to be statistically significant.
Conclusion
The overall accuracy of the two techniques was virtually equal despite the radiologist's very limited experience with tomosynthesis images and vast experience with two-dimensional mammography. As the diagnostic quality of the lesion details in the tomosynthesis images was valued considerably higher this factor should improve with experience. The patients also favored the tomosynthesis examination, rating the comfort of the procedure as much higher than regular mammography which might affect screening attendance.
Keywords
Over the past decade great efforts have been made to develop mammographic systems with tomosynthesis capabilities (1). The tomosynthesis principle, where a number of images are taken of the breast over a limited angle, can potentially reduce the anatomic background of tissue surrounding a lesion in the breast. This is done by dividing the image into a stack of slabs that the radiologist can scroll through. The hope is that the lesions will then be easier to diagnose and as a consequence the number of unnecessary recalls will be reduced and the diagnostic certainty will increase.
A variety of configurations of scanning principles and reconstruction techniques have been conceptually studied, including comparisons of these techniques to other types of breast imaging (2–6). There have also been some sizable, published patient studies on the practical comparison between tomosynthesis images and traditional two-view two-dimensional mammograms (7–9).
The tomosynthesis device used in this study is a system dedicated solely to digital breast tomosynthesis (DBT). The system was initially used for a smaller study to confirm the image quality (10).
The purpose of the investigation reported here was to evaluate a possible clinical gain with the DBT technique as compared to conventional two-dimensional (2D), two-view, images using screen-film mammography and digital mammography. This evaluation was done by comparing the diagnostic information in the images and calculating the specificity and sensitivity of the individual techniques.
The discomfort associated with the two types of examination was also investigated as this can be linked to how inclined women are to turn up for the screening examination in the first place (11–13).
Material and Methods
The study was performed from February 2007 to April 2009. In the first part of the study (the 66 patients from February 2007 to June 2008) the DBT images were acquired at XCounter AB in Danderyd, Sweden. The patients were recruited from Karolinska University Hospital (24 patients) and Danderyd Hospital (37 patients), which both provided screen-film reference images. Two patients were also recruited from the Central Hospital of Västerås which, at the time, had a digital system. This was done to get an early indication of the quality of the DBT images compared to digital images.
In the second part (the remaining 81 patients from October 2008) the patients were all recruited at Karolinska University Hospital, which by this time had all digital screening equipment, and the DBT images were acquired using an XCounter system located in the hospital.
Patients
The 144 women in the study all gave their written consent to making a DBT exam of one of their breasts. Approval of the study was given by the local ethics committee to acquire a single breast image of each patient at twice the single 2D image dose. The patients, which were selected and asked if they would like to participate in the study, came from one of the three following groups: the population-based mammography screening program for women aged 40–69 years; women recalled due to abnormalities detected on their screening mammograms; and patients referred for mammography due to clinical reasons. The majority of the women asked to participate had suspicious features on their 2D mammographic image and the aim was to get about 50% malignant patients. Consecutive patients were asked as far as practically possible. Most of these women did accept to participate but there were a few that could not participate for practical reasons.
Image acquisition
The screen-film images at Karolinska University Hospital were acquired using a Diamond mammography system (Instrumentarium, Tuusula, Finland) and the digital images were taken with either Giotto Image SDL (IMS, Bologna, Italy), Giotto Image 3DL (IMS, Bologna, Italy) or Selenia (Hologic, Bedford, MA, USA). The screen-film images at Danderyd Hospital were taken with a Mammomat 3000 (Siemens, Erlangen, Germany) and the digital images at the Central Hospital of Västerås were made with a Senograph DS (GE Healthcare, Chalfont St Giles, UK) and a Senograph Essential (GE Healthcare, Chalfont St Giles, UK). The tomosynthesis system used was an XCounter investigational device described in the next section.
The two-view, 2D reference images used were Cranial Caudal (CC) and Medio Lateral Oblique (MLO). The DBT images were all taken in MLO. Patient positioning and exposure were performed by experienced radiographers from Karolinska University Hospital and Danderyd Hospital and the procedure was monitored by XCounter personnel. When taking the DBT image the instruction to the radiographers was that the compression force should be high enough to give good positioning and no movement during the imaging process.
The tomosynthesis images were acquired as soon as possible after the two dimensional mammograms. In the case of the second part of the study the tomosynthesis system was placed in a room in the hospital, thereby making the time between images less than one hour. In the first part of the study the patient and radiographer had to travel to the location of the system and patients from Karolinska University Hospital always did so on the same day, whereas the patients from Danderyd Hospital typically came within a week. The longest times between the two techniques were the two patients from the Central Hospital of Västerås where it took two and three weeks, respectively. The tomosynthesis examination was always performed before a woman went for further, intervening investigations (e.g. needle biopsy).
All digital images were viewed on DOME E5, 5 Mpixel monitors (Planar Systems Inc., Beaverton, OR, USA) and administered through a DexTop Mammography Workstation (Dexela, London, UK).
Tomosynthesis system
The tomosynthesis images were acquired using a prototype system, XC Mammo −3T, developed by XCounter. The XC Mammo −3T is a dedicated breast tomosynthesis system with a scanning slit design of 48 parallel detector elements distributed over an angular range of ±13° (Fig. 1). The pre-patient collimator restricts the X-ray beam to a set of line beams matching the position of the detector elements. The X-ray source and detector are scanned in a linear motion together with the pre-patient collimator, and each detector line acquires a low dose projection image of the object at a fixed angle. The image area of the detector, 24 × 30 cm, matches that of the compression pad which is located below the collimator (not shown in the figure). During the scan motorized shutters shield the patient from excessive radiation, i.e. only objects that are within the image area are irradiated by the X-rays. It takes 9 s for the detector to pass each given point of the object and the total scan time is 18 s.
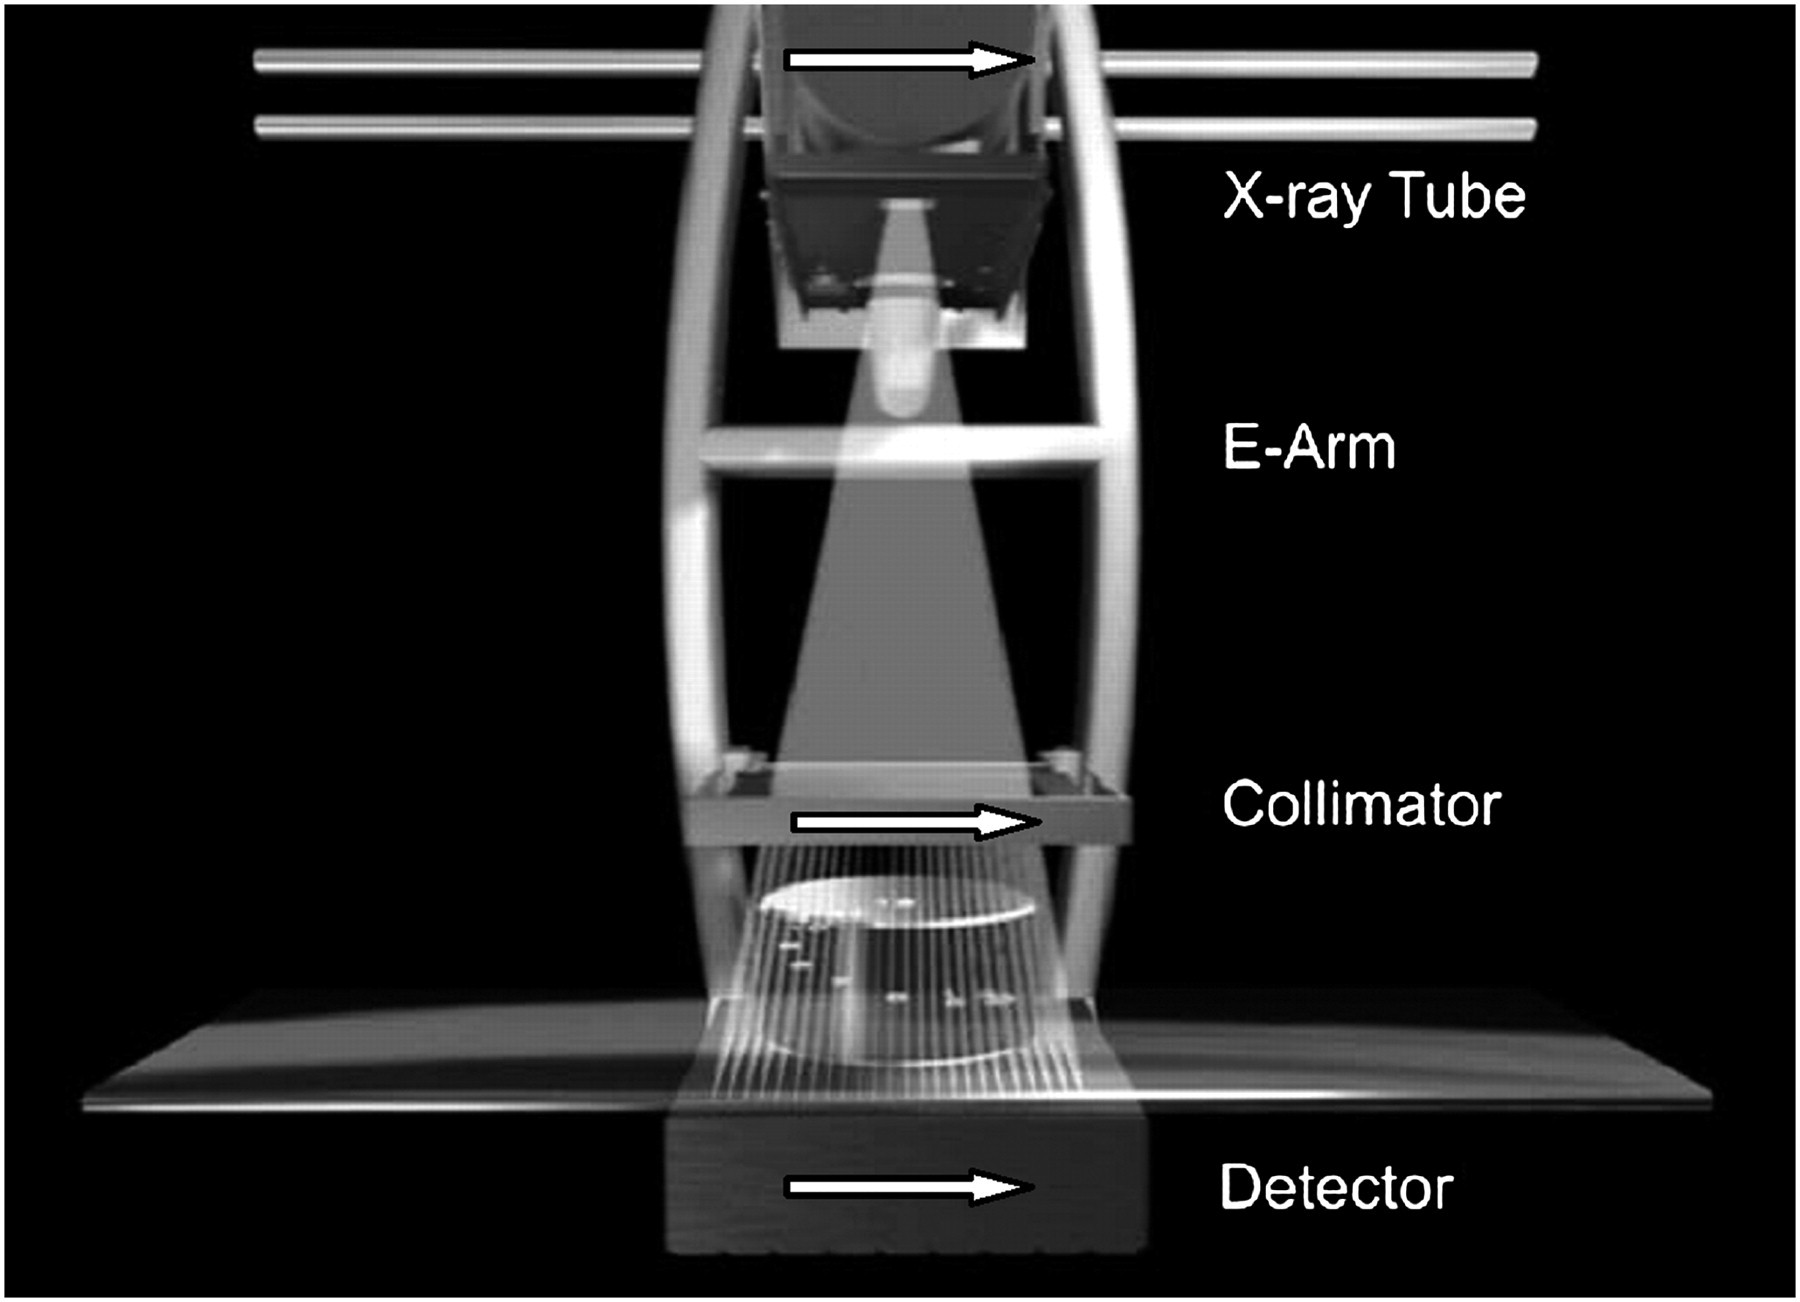
Principle of the slot design scanning of the tomosynthesis system used in the investigation. The ‘E-Arm’ moves from one side to the other during the imaging process resulting in a synchronized movement of the tube, collimator and detector
The detector is based on a photon counting principle which has high efficiency and no electronic noise. The detector box includes a post-collimator providing means of rejection of scattered photons. A detailed description of the detector and the scanning principle can be found in the paper by Maidment et al. (14).
The tomosynthesis images are reconstructed using an iterative algebraic technique which provides superior image quality compared to the more conventional filtered back projection methods (15). The result of the reconstruction was displayed as a stack of slabs with a slab spacing of 1 mm. The displayed slab spacing was not subject to any optimization in this study.
Image evaluation
The evaluation of the mammographic images was performed by two radiologists highly trained in 2D mammography (>30 and >20 years experience, respectively) and with little experience of tomosynthesis images prior to the start of this study (<10 hours of practice). The radiologists had sometimes seen the examinations previously. In those cases a time of between two months up to one year had passed before the individual assessments of the images were made.
The evaluation was divided into two parts. In the first part the techniques were individually assessed for each patient and a form was filled out regarding breast density, lesion types present and overall mammographic impression on the BI-RADS scale, graded according to the following: (0) incomplete; (1) no findings; (2) benign; (3) probably benign; (4) suspicious abnormality; and (5) highly suggestive of malignancy. The second part of the evaluation was a feature comparison where the two techniques were compared side-by-side and the radiologists answered questions about the comparative diagnostic information both in the general impression and in the individual lesions. This section also included an assessment of the size of the observed lesions.
Statistical analysis
A multiple-reader multiple-case (MRMC) receiver operating characteristics (ROC) analysis was performed using the DBM_MRMC software (16–21). The data were processed with the ‘Proper’ binormal model (17). The resulting areas under the ROC curves (AUC) were reported together with a 95% confidence interval. Comparisons of the AUC between the two techniques were based on analysis of variance (ANOVA) to take the performance of two readers into account.
The sensitivity, specificity and accuracy were determined by a threshold between BI-RADS levels 3 and 4. A morphologically proven cancer classified 4 or higher is counted as true-positive (TP) otherwise as a false-negative (FN). If a benign lesion is BI-RADS classified 4 or higher it is a false-positive (FP) while a lower classification is a true-negative (TN). The ratio between TP and the positives, determined by the histopathology report at surgery, defines the sensitivity and the specificity is defined as the ratio between TN and the negatives, as classified in the routine clinical practice. The positive predictive value (PPV) is the ratio between TP and TP + FP and the accuracy is the ratio between TN + TP and the total number of patients. Comparisons of the sensitivity, specificity, PPV and the accuracy are averaged over the two readers and z-tests are performed to find the significance P value of the differences between the two techniques. The results are reported together with a 95% Wilson confidence interval (22). A test is assumed to be significant with P value < 0.05.
Results
The age of the 144 patients in the study ranged from 40–85 years with a mean age of 56.8 years. In total 76 of the patients had malignant lesions and 68 had benign lesions or none. The patients with malignant lesions included one papillary tumor. In the study the patient's left breast was imaged in 78 cases and the right breast in 66.
The average dose used in the examinations was 63% of the double 2D-image dose, i.e. clearly below the allowed limit. The dose in the DBT image was not subject to any optimization or minimization in this study.
The compression force was on average about half the force used in the traditional mammographic examination, with a median value of 58 N.
The breast density of each patient was estimated for both techniques independently as one of the four BI-RADS categories: (1) fatty (2D 12%, DBT 11%); (2) scattered fibroglandular tissue (2D 30%, DBT 44%); (3) heterogeneous fibroglandular tissue (2D 49%, DBT 38%); and (4) mostly fibroglandular tissue (2D 9%, DBT 8%). The result of the assessment shows that the perceived density was slightly lower in DBT than in 2D.
Cancer pathology and appearance
Out of the 76 malignant lesions in the study 41 (54%) were invasive ductal carcinoma (IDC), 10 (13%) invasive lobular carcinoma (ILC), 10 (13%) ductal carcinoma in situ (DCIS), nine (12%) IDC with DCIS, in two cases (3%) invasive ductal and lobular carcinoma (IDLC), one (1%) ILC associated with DCIS, one (1%) ILC associated with LCIS, one (1%) lymphoma and one (1%) papillary tumor. The size of the individual lesions varied from 3–60 mm (and also included a patient with extensive, about 100 mm, DCIS) with a median of 14 mm.
Table 1 shows the two radiologists' classification of the malignant lesions in the breast using either 2D or DBT. The appearance is categorized as densities, architectural distortion, calcification or combinations thereof. An example of a combined lesion can be seen in Fig. 2. As can be seen in Table 1 the distribution of the appearances is roughly the same for the two techniques and the number of missed lesions is the same. It should be noted that the table only indicates which lesions were seen and does not say anything about how likely they were assessed to be malignant.
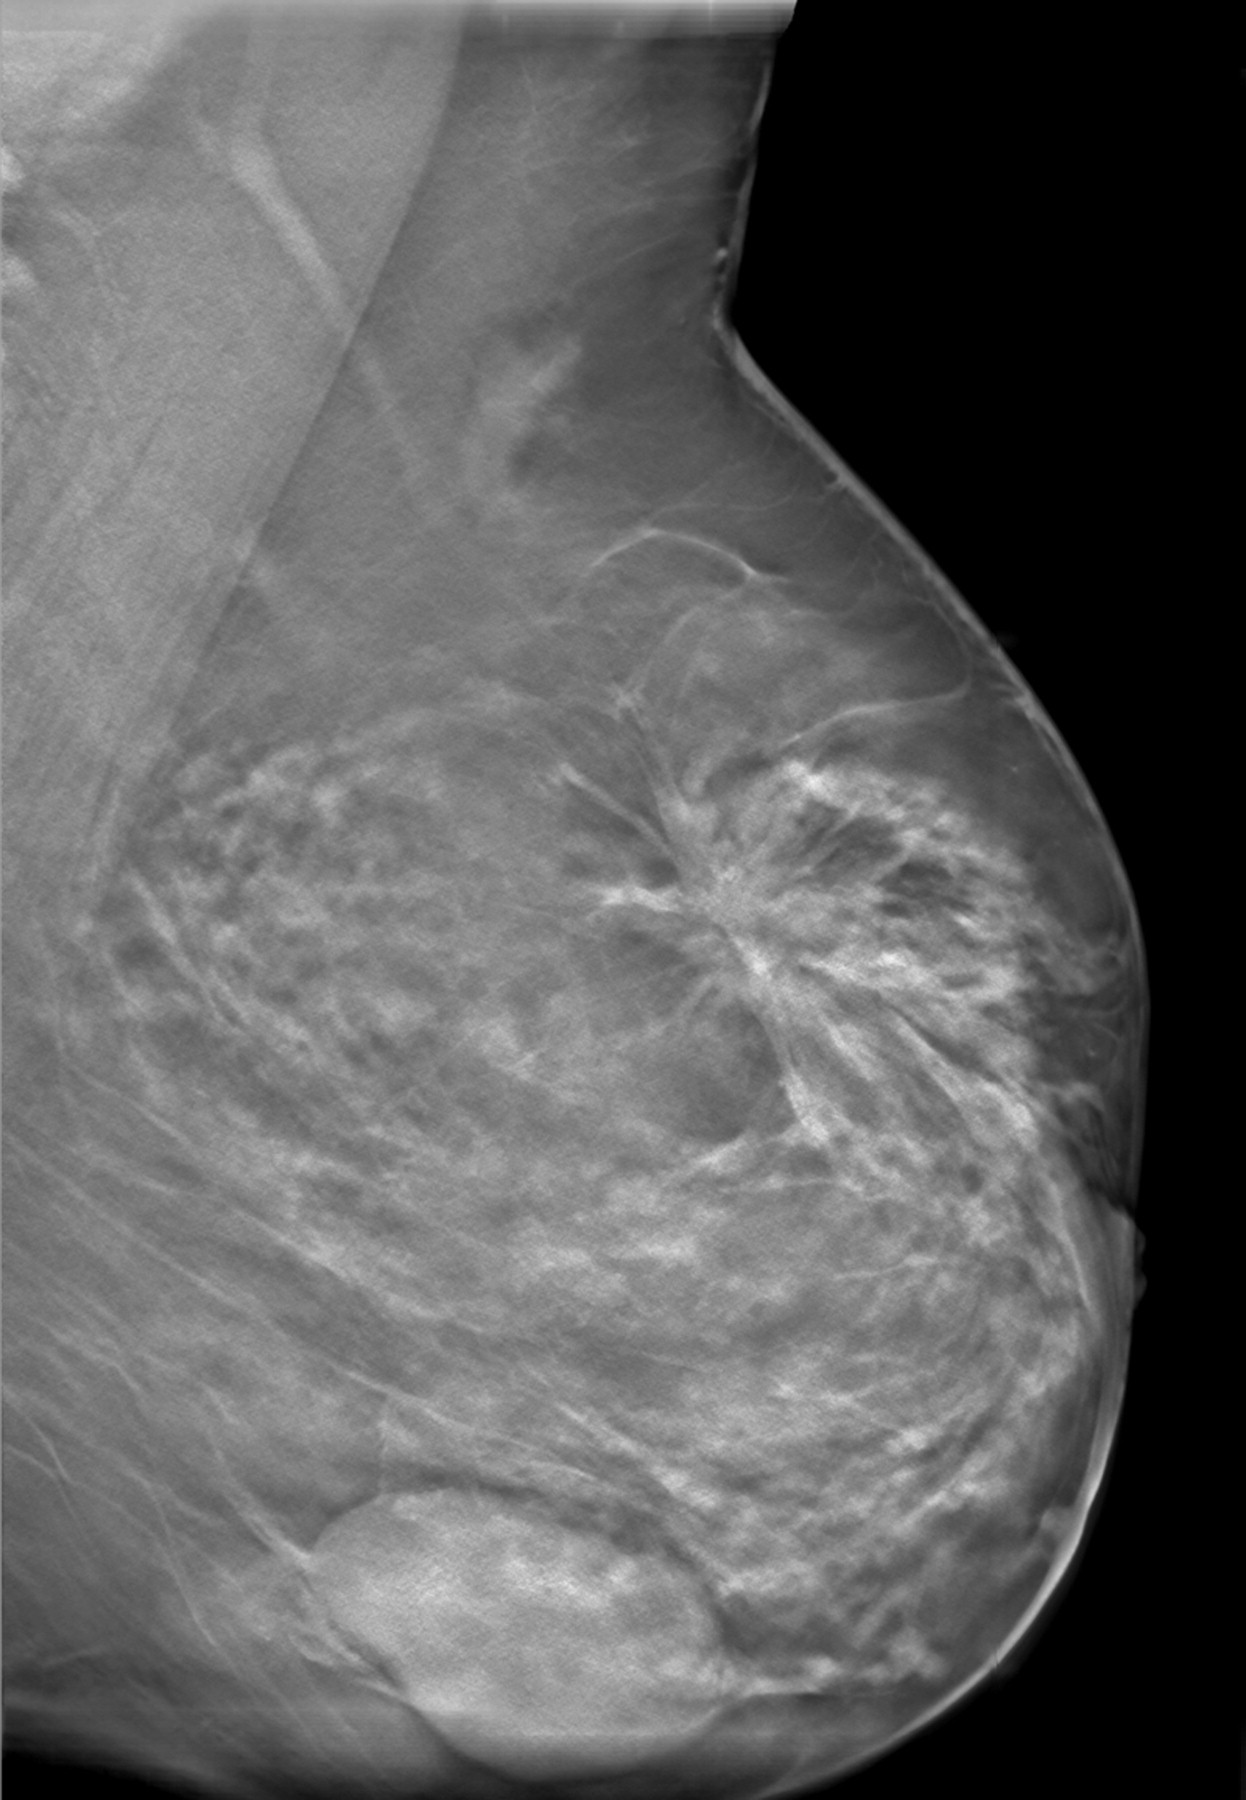
The image shows an example of a tomosynthesis image slice with both a spiculated lesion (invasive lobular carcinoma) and a benign cyst. The result of the lesion classification was that the cancerogenous part of the breast contains densities and an architectural distortion
Result of the classification of the lesions in all malignant patients versus the type of cancer found. The table is the result of the two radiologists' classifications and hence the total number of indications in each type is 152 (76 malignant cases, two radiologists)
Comparison – diagnostic quality
In this part of the study the two 2D images, CC and MLO, were compared side-by-side to the DBT image of the same patient. All patients with registered lesions from the individual assessment of the images, malignant or benign, were included in the comparison (123 cases). The radiologists were asked to rate the general diagnostic information and the lesion diagnostic information in the images and decide if the diagnostic information was better or worse in the DBT mammogram. This was done on a scale from –3 (DBT image much worse than 2D) to 3 (DBT image much better than 2D). The combined result based on the general impression of the images can be seen in Fig. 3. The graph shows that there is a preference for the DBT image in 44% of the cases and the 2D images are preferred in 9%.
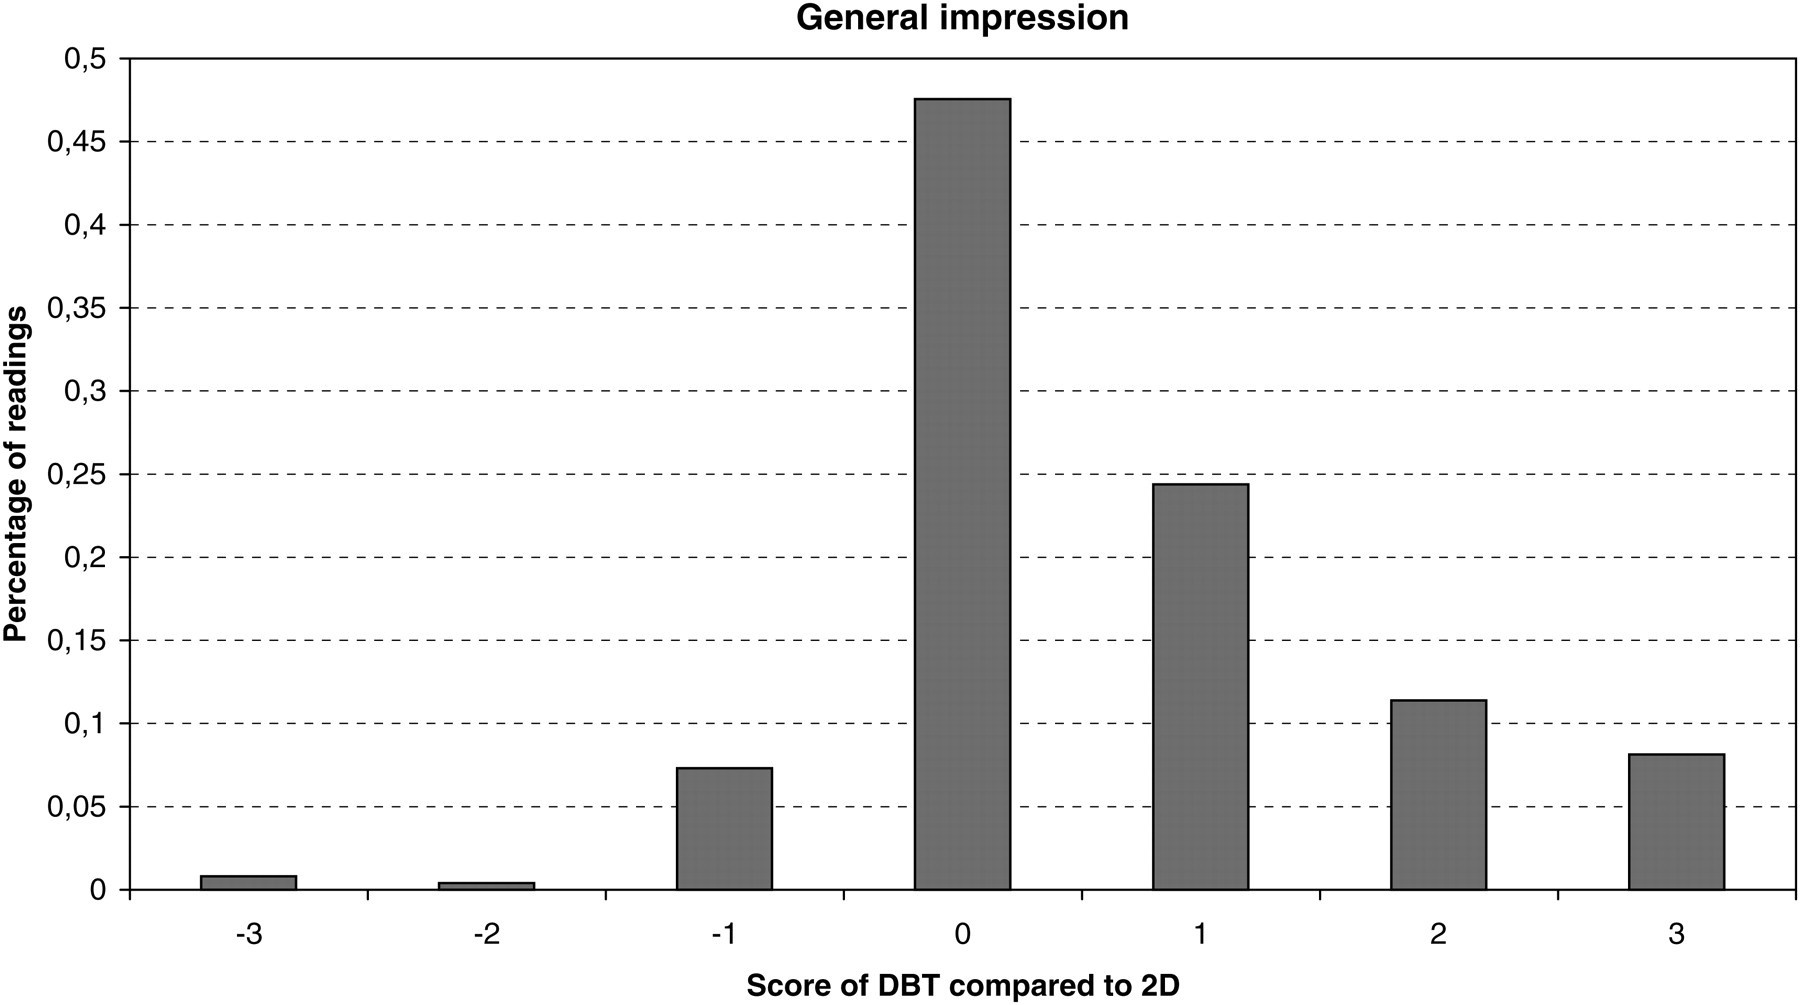
Result of the comparison of images in DBT and 2D. A positive grade indicates that the viewer thinks that the DBT image is superior to the two-dimensional
The next question on the form was to evaluate each lesion, both malignant and benign, seen in the mammograms. The lesions were first classified into one of four categories and in the comparison the distribution was the following: masses (65%); architectural distortion (16%); calcifications (17%); and asymmetric densities (2%). Secondly the diagnostic information of each lesion was rated on the same scale as used previously, i.e. –3 for a comparatively poor result in DBT and 3 for a comparatively good one. The result, which can be seen in Fig. 4, shows that as far as the lesions are concerned the DBT image is preferred for 56% of them and the 2D images are preferred in 9% of the cases. This means that the test that the perceived image quality of the lesions is higher in the DBT images is statistically significant (p = 0.045). The bars in this diagram are also divided into lesion type to clarify which type of lesion has been given which grade. The DBT representation was, on average, preferred irrespective of lesion type.
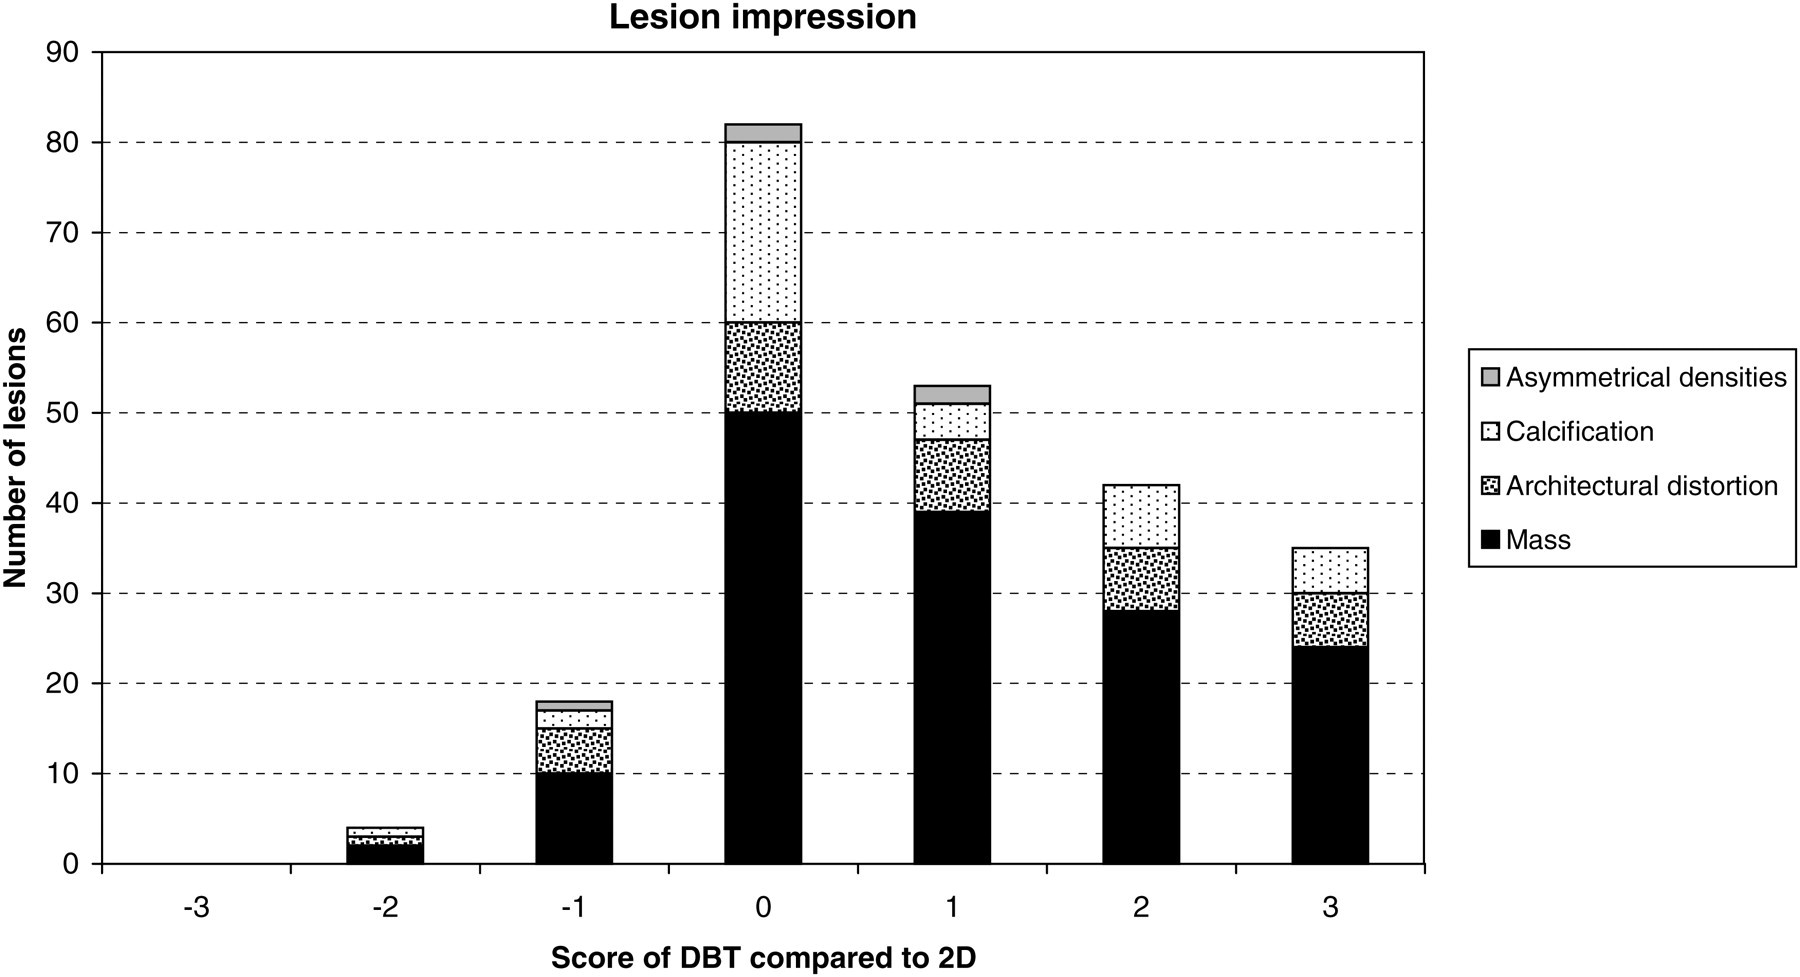
The graph shows the result of the comparison between the impression of the DBT image and the 2D image. It also shows the distribution between different types of lesions in the comparison
In Fig. 5 a comparison can be found between the CC and MLO screen-film images and a slice of the tomosynthesis image of a patient with invasive ductal carcinoma.
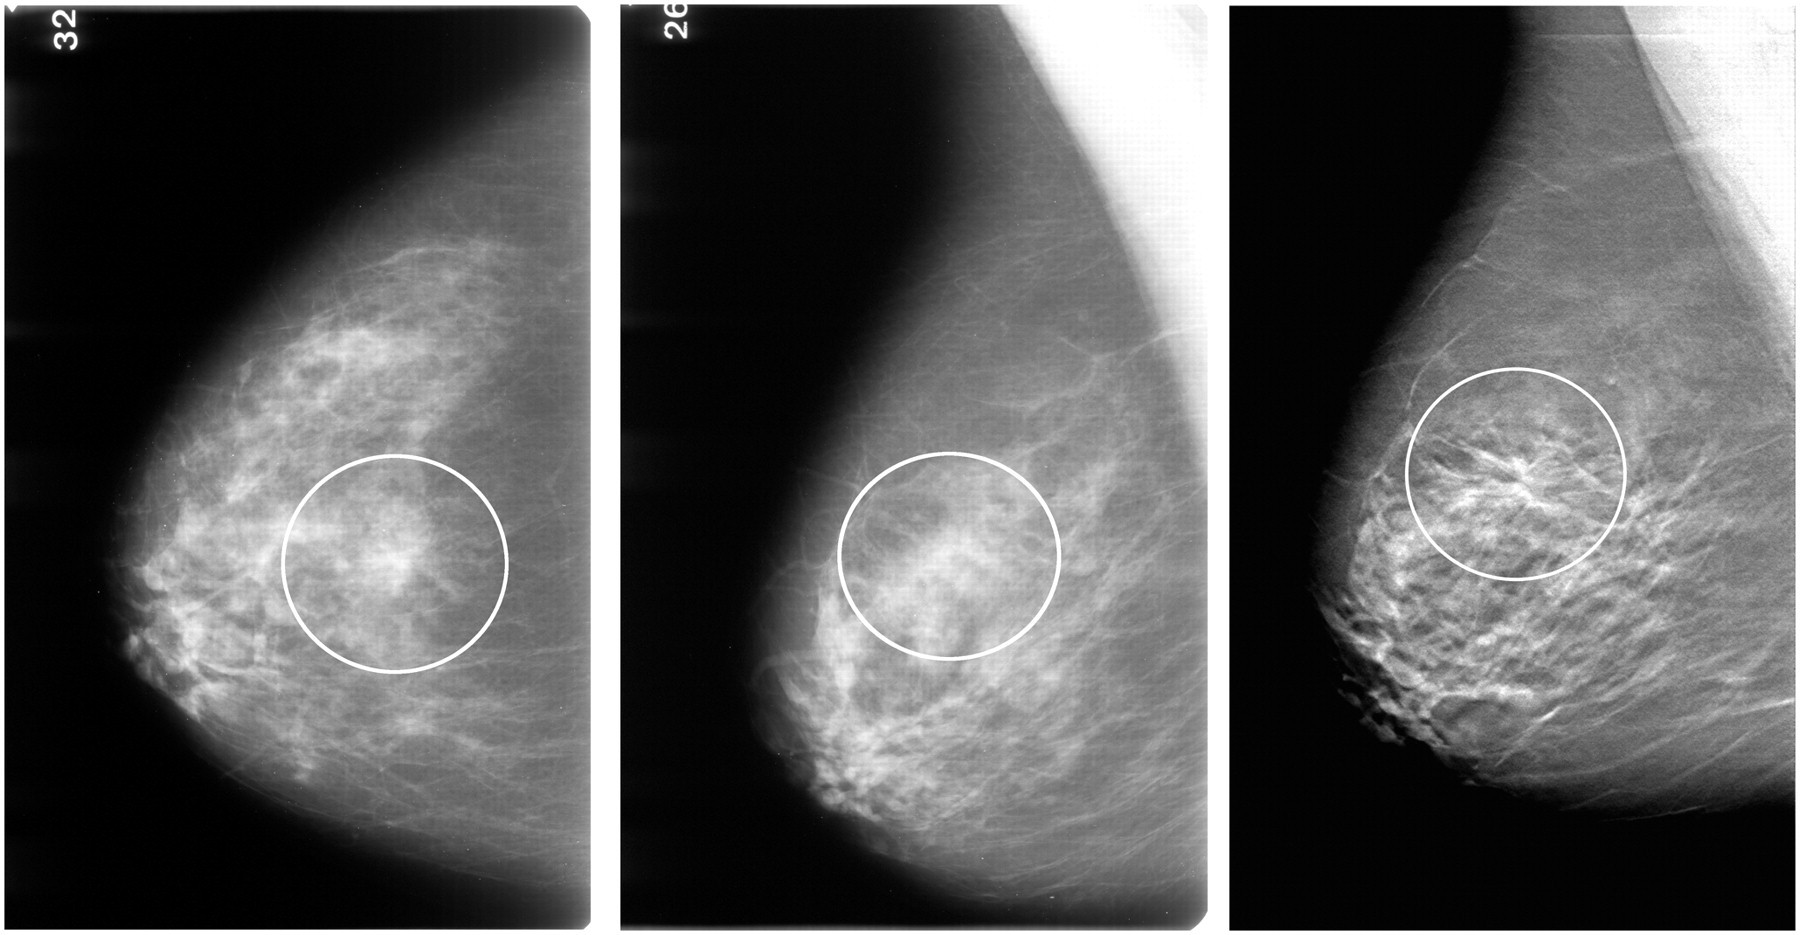
Illustration of the diagnostic quality of two screen-film images (CC to the left, MLO in the middle) classified as 3 and 4 by the two radiologists, respectively, on the BI-RADS scale as compared to a slice of the DBT image (right) of the same patient where the entire DBT image was classified as 5
The last part of the comparative evaluation was that the individual sizes of the lesions were measured for both 2D and DBT. The result of the measurements was then compared to the reported histopathology size. No significant difference could be seen between the two techniques in how well they predicted the size of the lesions.
Accuracy of 2D compared to DBT
The result of the statistical analysis of the image evaluations for each technique individually is presented in Table 2. The results in this table are based on the averaged values of the two readers. Looking at the AUC values we found that the difference between the techniques was 0.007 (95% CI [–0.025] – 0.039). The P value of the hypothesis test that the techniques are different was 0.674, i.e. there was no statistically significant difference in AUC between the two.
The table shows the individual results of each technique
The sensitivity of DBT was slightly lower than the sensitivity of the conventional screening techniques and the difference was found to be 3.9% (95% CI [–4.9%] – 7.3%; P = 0.38). On the other hand the specificity was 5.1% higher (95% CI [–17.6%] – 7.3%; P = 0.41) for the DBT as compared to 2D.
The accuracy was similar between the techniques and the difference was in favor of DBT by 0.3% (95% CI [–7.9%] – 7.2%; P = 0.92). The very small difference in accuracy is due to the fact that the lower value in sensitivity for DBT is compensated by the higher value in specificity. However, as can be seen by the numbers, none of the differences between the two techniques are statistically significant with 95% confidence interval.
In 11 cases of the 304 readings of mammograms with malignant features (76 patients, two techniques and two radiologists) the malignancy was not seen and the mammogram given a BIRADS score of 1 or 2. In three of these the feature was not identified by one of the radiologists in the DBT image, in two cases it was missed by one radiologist in the 2D image, two malignancies were not seen in one DBT image and one 2D image and in one case the result showed that none of the radiologists had seen the signs of malignancy in the DBT image. The average BIRADS densities of these breasts were all between 2.5 and 3.5. The analysis of this very limited number of images does not indicate that the DBT is better in the case of higher density breasts or less reliable in the case of lower density.
Calcifications
Calcifications are common in malignant tumors of ductal origin. Especially ductal carcinoma in situ (DCIS) presents mostly as micro-calcifications. However, calcifications are also common in proliferative ductal disorders, in fibroadenomas, in fibrocystic changes and can also be found in normal breast parenchyma. To separate micro-calcifications representing cancer from those in non-malignant lesions it is of utmost importance to be able to see the size, the shape and also the density of the individual calcification. It is also very important to decide if the calcifications are distributed within branching ducts. A high technical quality of the mammogram is necessary to correctly evaluate calcifications which are the smallest structures. In our study two-view 2D mammography showed a better quality than DBT in only three (8%) of the, all in all, 39 lesions (benign or malignant) presenting as calcifications (Fig. 4). The quality of the calcifications was the same in 20 lesions (51%) and DBT had a better quality in as many as 17 lesions (41%). The distribution of the calcifications within the ducts were more easy to see in DBT and in most of the patients also the single calcifications were more easy to evaluate in the DBT image. An example of the appearance of the calcifications in a plane of a tomosynthesis image can be seen in (Fig. 6).
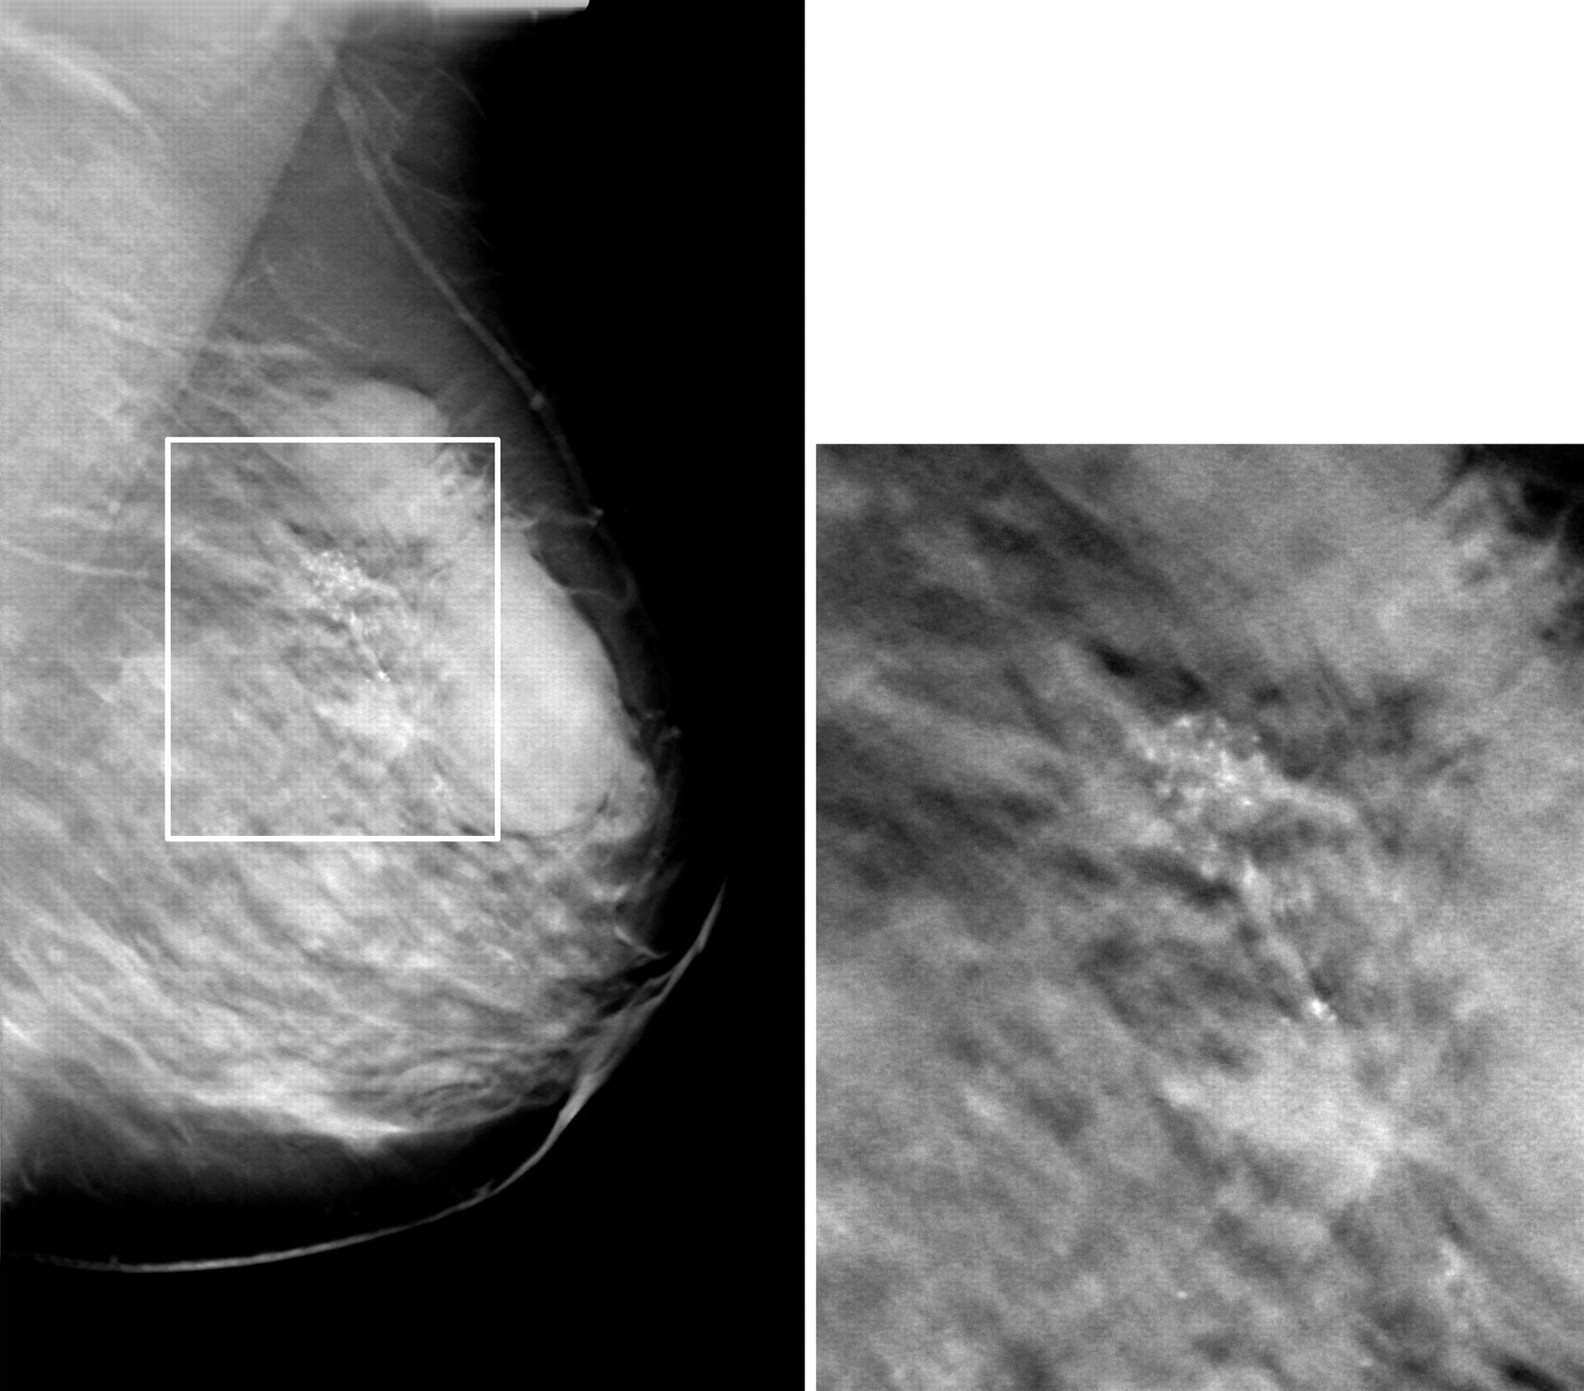
The image shows a slice of a tomosynthesis image of a patient with IDC/DCIS. In the magnification of the image (to the right) the tumor and the calcification cluster can clearly be seen
Patient discomfort
The patients were asked to rate the overall experience of the two dimensional examination and the DBT examination in terms of general comfort. They were given a questionnaire where they were first asked to rate the traditional examination on a 10-graded scale from 1 (‘uncomfortable’) to 10 (‘comfortable’), then they were asked to rate the DBT examination on the same scale and finally to state their preference between the two for their next examination. The result of the individual rating can be seen in Fig. 7.
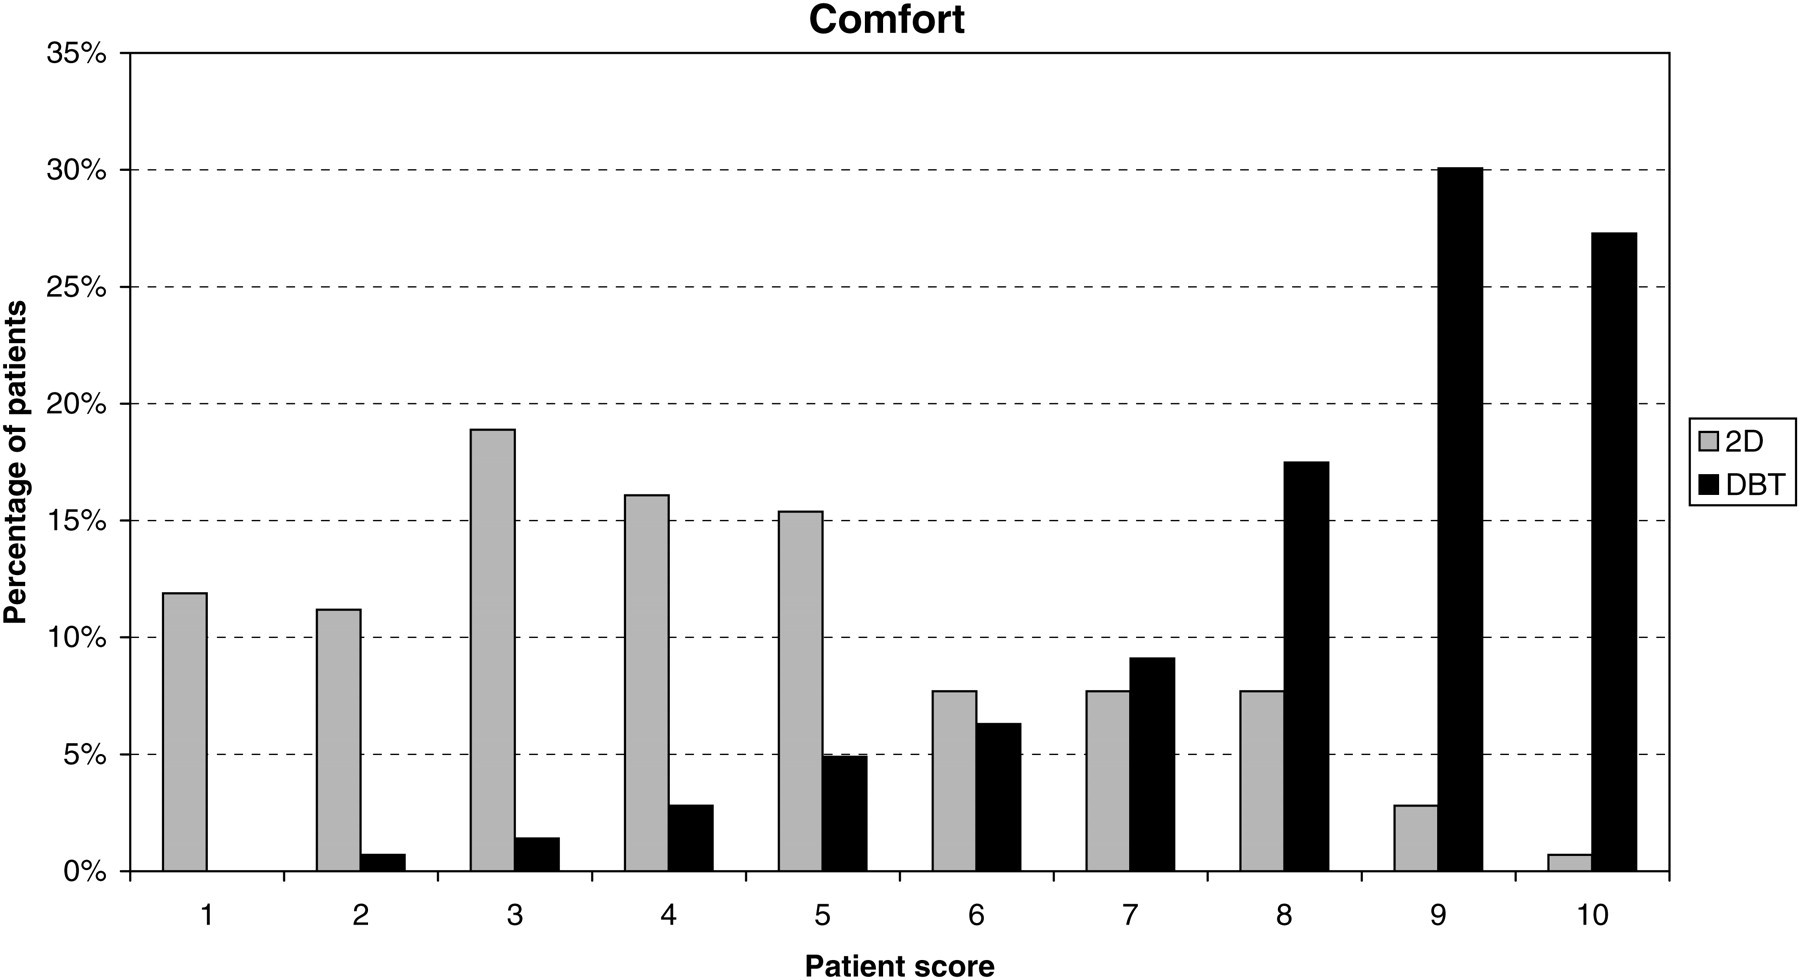
Patient comfort when having a traditional 2D examination and when having a DBT examination
When asked which method of examination they preferred, 97% of the patients answered DBT, none preferred the traditional 2D exam, and 3% had no preference.
Discussion
This study aimed to compare the diagnostic quality of a single tomosynthesis image taken in MLO with a two-view (CC and MLO) set of standard two-dimensional screening images. The purpose was also to evaluate the possible clinical gain of using tomosynthesis imaging by comparing statistical results on measures such as specificity and sensitivity of the two techniques.
The investigation showed that the specificity of the DBT was slightly higher than that of the traditional technique. This would indicate that DBT has the potential to reduce the recall rate due to false-positive results. There have been other results reported which support the indication that DBT would reduce recall rate (23). However, neither the result reported here nor the result referred to had a statistically significant difference between the two techniques.
The sensitivity of the DBT technique was slightly lower than two-dimensional imaging. However, all cancers but one had been noted in a tomosynthesis examination in a clinical scenario, where two radiologists examine each image, with a BI-RADS score of 3 or higher for at least one of the radiologists.
Overall the sensitivity and the specificity were rather high in this study, which can probably be partly attributed to the method by which the patients were selected. We also noted that when changing the criteria for a positive BIRADS score to at least 4 (instead of 3 as used in the calculations of Table 2) the sensitivity decreased to 72% (2D) and 73% (DBT) whereas the specificity reached 94% in both cases. These results are very similar to what has been reported earlier (9).
The higher diagnostic quality of the DBT images suggests that the values of the sensitivity and the specificity as compared to 2D could be improved given sufficient training of the radiologists, a training which was almost non-existent in the beginning of this study. Towards the end of the study both radiologists felt much more comfortable to read the DBT images, which increased the diagnostic confidence. It should also be taken into account that the initial patient selection was based on the 2D images and that the DBT process was strictly restricted to one image per patient without the possibility of retakes.
Regarding the appearance of the calcifications the accounts in the present literature appear to point in different directions. Results can be found which indicate that that calcifications are as detectable in DBT images as they are in digital mammography (7), however there are also studies that have shown that calcifications in tomosynthesis examinations have an inferior image quality as compared to diagnostic mammography (24). The aim in the present study was, however, to evaluate the screening scenario and the relevance of comparing with one which involves the diagnostic result, i.e. also including focal magnification views, can be discussed. For this system and in this study the radiologists were highly in favor of the appearance of the calcifications in the tomosynthesis image, both regarding the visibility of the growth pattern and the appearance of the individual calcifications. One of the limitations pointed out in (24) as accounting of the deficits were the thin slice thickness (1 mm) and in another study the perceived quality of the calcification representation improved significantly with a reformatting of the data-set into 1-cm volumetric units for presentation (25). However, in this study the perception was that the thin slice spacing enabled a good visualization, especially as the growth pattern could be followed through the layers of the tissue. It is possible that the difference between the results regarding the calcifications point to the importance of the role of the detector, the scanning geometry and the reconstruction technique used.
It has been reported that the size of the lesions can be more accurately determined with DBT than with traditional mammography (26). In this study the size assessments were very similar between the two techniques, however, the size estimation of the different images were in this case not made independently but rather in connection with the comparative study which may have compromised the result.
The current study has some severe limitations, the first of which is the number of radiologists reviewing the material in relation to the number of cases studied. To get statistical significance out of the 144 cases the difference between the two techniques would have to be moderate to large which turned out not to be the case. As an example the small difference in AUC observed here would only be statistically significant if it was based on the result from at least seven radiologists (27).
The second major limitation was that the selection of patients did not reflect a normal screening population as this would have given an insignificant number of malignant cases. Instead the choice was, in most cases based, on the findings in the 2D mammograms, and always before interventions, which makes the likelihood for finding something in DBT which has not been seen or suspected on the 2D image very small.
In conclusion, we find that DBT is not inferior to 2D mammography in spite of the fact that the DBT images were taken at a much lower dose than the two-view 2D images, with on average half the compression force and viewed by radiologists much less familiar with the 3D-representation. The perceived diagnostic quality of the tomosynthesis images was decidedly higher than the two-view 2D images both in terms of the impression in general and the lesions in particular. In the case of the lesions the preference was statistically significant.
Footnotes
ACKNOWLEDGMENTS
The authors would like to thank radiologist Per Sundén of Danderyd Hospital for his diligent work on this project and radiologist Ewa Murawa Frodis for the patient selection from the Central Hospital of Västerås. We would also like to acknowledge the dedication and expertise of radiographers Louise Werelius and Karin Andrén of Karolinska University Hospital and Barbro Kruse and Camilla Nordén of Danderyd Hospital.