
Abstract
Background
Three Tesla cardiovascular magnetic resonance imaging (3T-CMR) is increasingly used in clinical practice. Despite many advantages one drawback is that ECG signal disturbances and artifacts increase with higher magnetic field strength resulting in trigger problems and false gating. This particularly affects cardiac imaging because most pulse sequences require ECG triggering. Pulse wave (PW) triggering is robust and might have advantages over ECG triggering.
Purpose
To evaluate differences in left ventricular (LV) function as an integral part of most CMR studies between ECG- and PW-triggered short-axis imaging using 3T-CMR.
Material and Methods
Forty-three patients underwent multiple short-axis cine imaging for LV-function assessment with ECG and PW triggering using standard multibreath hold steady-state free precession. LV-volumes (EDV, ESV), ejection fraction (EF), and mass were determined by slice summation. LV-wall motion was assessed by using a 4-point scoring scale. Bland Altman statistics for inter-observer variability were performed.
Results
ECG triggering failed in 15 patients (34.8%). Thus, analysis was performed in 28 patients (13 with impaired LV function). Difference in volumes (EDV 0.13 ± 1.8 mL, ESV 0.59 ± 1.1 mL), EF (–0.32 ± 0.6%) and mass (0.01 ± 1.1 g) between ECG and PW triggering were very small and significant only for ESV and EF (p ≤ 0.011). In patients with impaired LV function (n = 19) differences were not significant (p ≥ 0.128). Wall motion scores did not differ between ECG and PW triggering (p ≥ 0.295). Inter-observer variability for function measurements was low.
Conclusion
Short-axis cine imaging for LV-function assessment can accurately be performed using PW triggering on 3T magnets, and may be used in clinical practice when ECG triggering is disturbed.
Keywords
Three Tesla cardiovascular magnetic resonance imaging (3T-CMR) is increasingly being used in clinical practice due to improved signal-to-noise ratio and higher spatial resolution compared to 1.5 Tesla CMR (1–4).
Despite many advantages of 3T-CMR one drawback is the fact that ECG signal disturbances and artifacts increase with higher magnetic field strength resulting in trigger problems, false gating, and compromises in image quality (5–8). This particularly affects cardiac imaging because most pulse sequences require ECG triggering for image acquisition to achieve high image quality. In fact, at our institution, ECG signal disturbances are present in about 35% of the patients, which makes accurate and reliable ECG triggering, image acquisition, and image analysis difficult (Fig. 1). The main reason for ECG distortions in the CMR environment is the magnetohydrodynamic effect (5, 8) which may lead to incorrect R-wave detection.
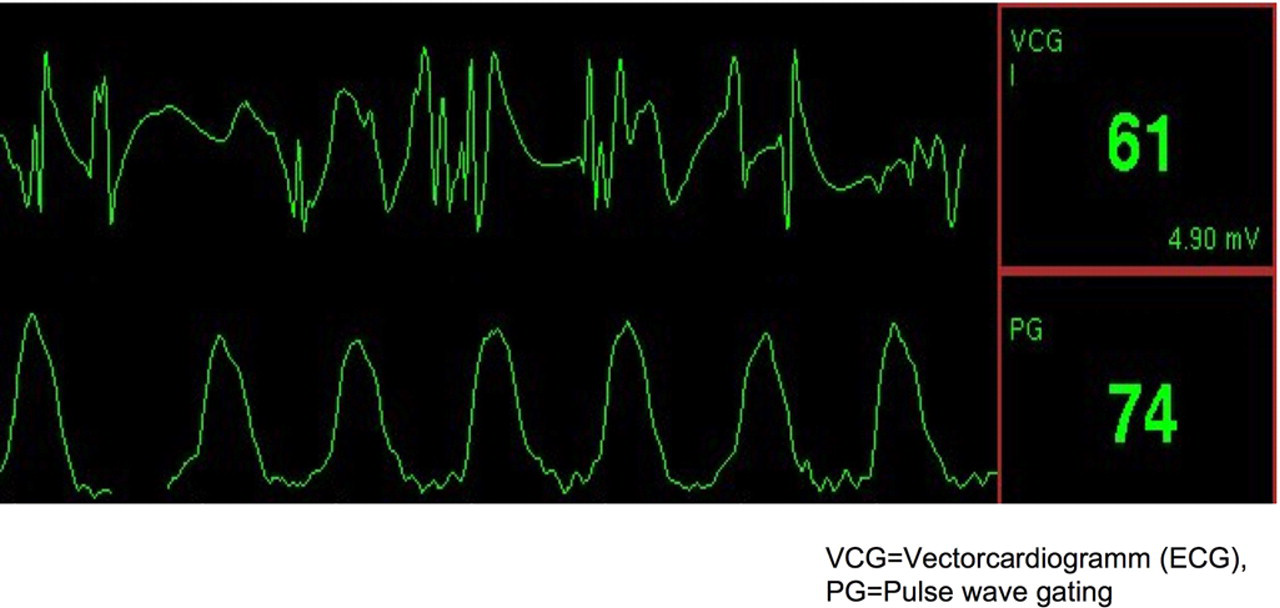
Example of an online ECG and a pulse wave at a 3 Tesla magnetic resonance scanner. Note that the T-wave of the ECG is as high as the R-wave, and ECG signal disturbances. This often causes trigger problems resulting in reduced image quality and difficulties in image analysis. PG = pulse wave gating
One approach to potentially overcome these limitations may be pulse wave triggering in which image acquisition is triggered on the peak of the pulse wave generated from a finger or ear clip. Pulse wave triggering seems to be robust and might be advantageous to ECG triggering, especially in patients with ECG signal disturbances on 3T-CMR.
Ventricular function assessment is an integral part of most CMR studies, and multislice short-axis cine imaging has become the gold standard for accurate ventricular function assessment (9–17). We therefore sought to evaluate the differences in left ventricular function measurements between ECG (R-wave) and pulse wave triggering using standard two-dimensional steady-state free precession gradient echo short-axis image acquisition (18, 19) and 3T-CMR in both patients with preserved and impaired left ventricular function.
Material and Methods
Patients
Forty-three patients (14 women, mean age 54 ± 17 years, range 33–76 years, 12 patients with impaired left ventricular function, 17 patients with coronary artery disease and regional wall motion abnormalities) underwent 3T-CMR for left ventricular function assessment. Subjects with contraindications to CMR were not enrolled (18). Informed consent was obtained before the CMR examination in all cases. The study was conducted according to the principles of the Declaration of Helsinki and was approved by the institutional ethics committee.
Image acquisition
CMR was performed with a 3.0 Tesla magnet (Signa HDxt 3.0T; GE Healthcare, Waukesha, WI, USA) using a dedicated, phased array, cardiac coil (HD Cardiac Array, eight channels, eight elements) and retrospective electrocardiographic (R-wave) gating as well as pulse wave triggering.
The ECG signal was recorded by using a commercially available physiological acquisition controller (PAC) box (version 5112668) and four magnetic resonance compatible electrodes (Ambu Bleu Sensor MRX ECG electrodes, ref.# MRX-00-S/32; Ambu A/S, Ballerup, Denmark) that were placed on the subjects' chest area according to the Einthoven triangle configuration. Three ECG lead signals were acquired using an non-magnetic amplifier (0.5Hz–20Hz). The lead signal with the highest R-wave and the fewest artifacts was choosen for ECG triggering.
Peripheral pulse was generated from a finger clip placed on the index finger of the right or left hand. The pulse wave was then used for pulse wave triggering.
ECG and pulse wave triggering were performed in random order using identical slice positioning and slice offset. Acquisition of ECG and pulse wave triggered short axis stacks were performed immediately after each other.
Real-time scout images in axial, sagittal, and coronal planes were used to localize the cardiac position within the thorax and to plot double oblique, orthogonal, short- and long-axis imaging planes of the left ventricle.
For standard short-axis cine imaging (18) a multibreath hold two-dimensional imaging sequence with steady-state free precession (2D-SSFP), constant radiofrequency pulsing and with parallel imaging – (20) (acceleration factor 2) was used (18). On the basis of horizontal and vertical long-axis images, a stack of short-axis images were planned perpendicular to the interventricular septum. To cover the entire left ventricle, multiple short-axis images were acquired from the base of the heart (atrioventricular ring) to the apex with 8-mm slice thickness and 2 mm gap during breath holding. The breath hold duration for each slice was 6–10 s, depending on the heart rate. All images were reviewed by two experienced physicians (BS and SS) at the time of CMR examination to ensure that all left ventricular myocardium (from the base through the apex) was included in the scan.
The parameters for standard 2D-SSFP are displayed in Table 1. Representative image examples for ECG and pulse wave triggered short-axis images are given in Fig. 2.
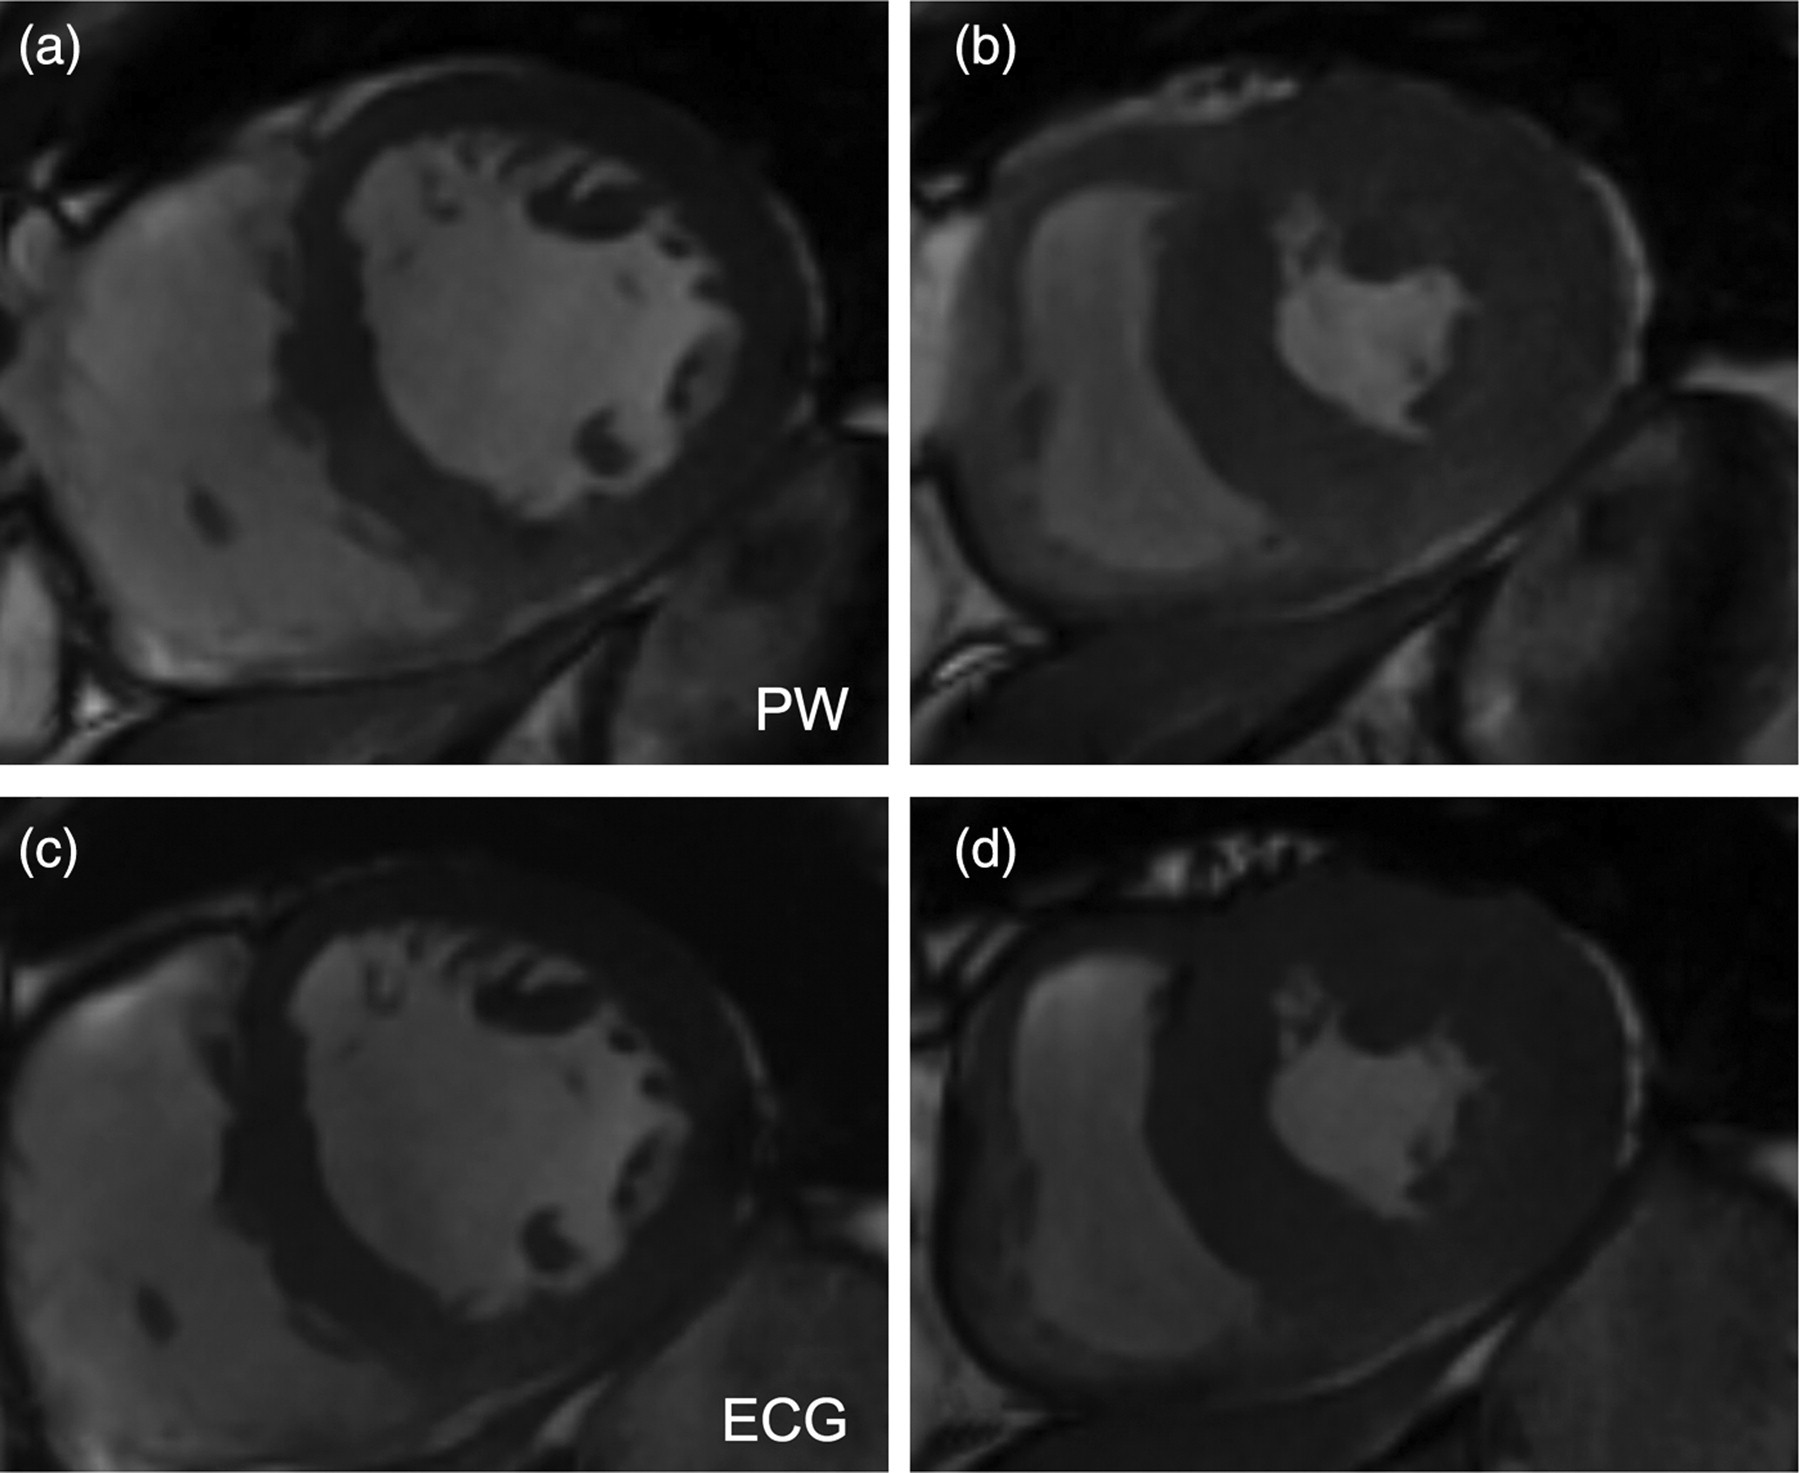
Image examples of short-axis slices at the mid-ventricular level in end diastole (a, c) and end systole (b, d). Images were acquired ECG triggered (a, b) and pulse wave (PW) triggered (c, d). Note: there is no visible difference in image quality and timing within the heart cycle
Pulse sequence parameters
2D SSFP = two-dimensional steady-state free precession gradient echo pulse sequence
Analysis
Analysis for both the short-axis stack acquired with ECG triggering and the short-axis stack with pulse wave triggering was performed by consensus of two experienced physicians (MW, BS) who were blinded to patient clinical history, diagnostic findings, and acquisition type (pulse wave triggering, ECG gating) with a commercially available computer software program (ReportCard 4.0, RC 4.3.1_FW0309; GE Healthcare, Waukesha, WI, USA) as previously described (21, 22).
Contour tracing was aided by reviewing the multiple-phase scans in the cine mode. For left ventricular volume assessment, end diastole was defined visually as the phase with the largest volume, and end systole as the phase with the smallest volume. At the base of the heart, slices were considered to be in the left ventricle if the blood was at least half surrounded by ventricular myocardium. For the basal slice the contours were traced up to the junction of the atrium and the ventricle. Blood volume up to the aortic valve was included in the left ventricular volume. The epicardium and endocardium of the left ventricle were traced with a cursor in each end-diastolic and end-systolic slice and the sum of the marked areas used to calculate the total volume. Tracings were performed with papillary muscles and trabeculations included to the left ventricular cavity and volumes (Fig. 3). It was taken care that ventricular base and apex on both ECG and pulse triggered short-axis images were defined according to the same criteria described above to ensure that differences in volumes and mass would only be due to the trigger method (ECG versus pulse wave triggering).
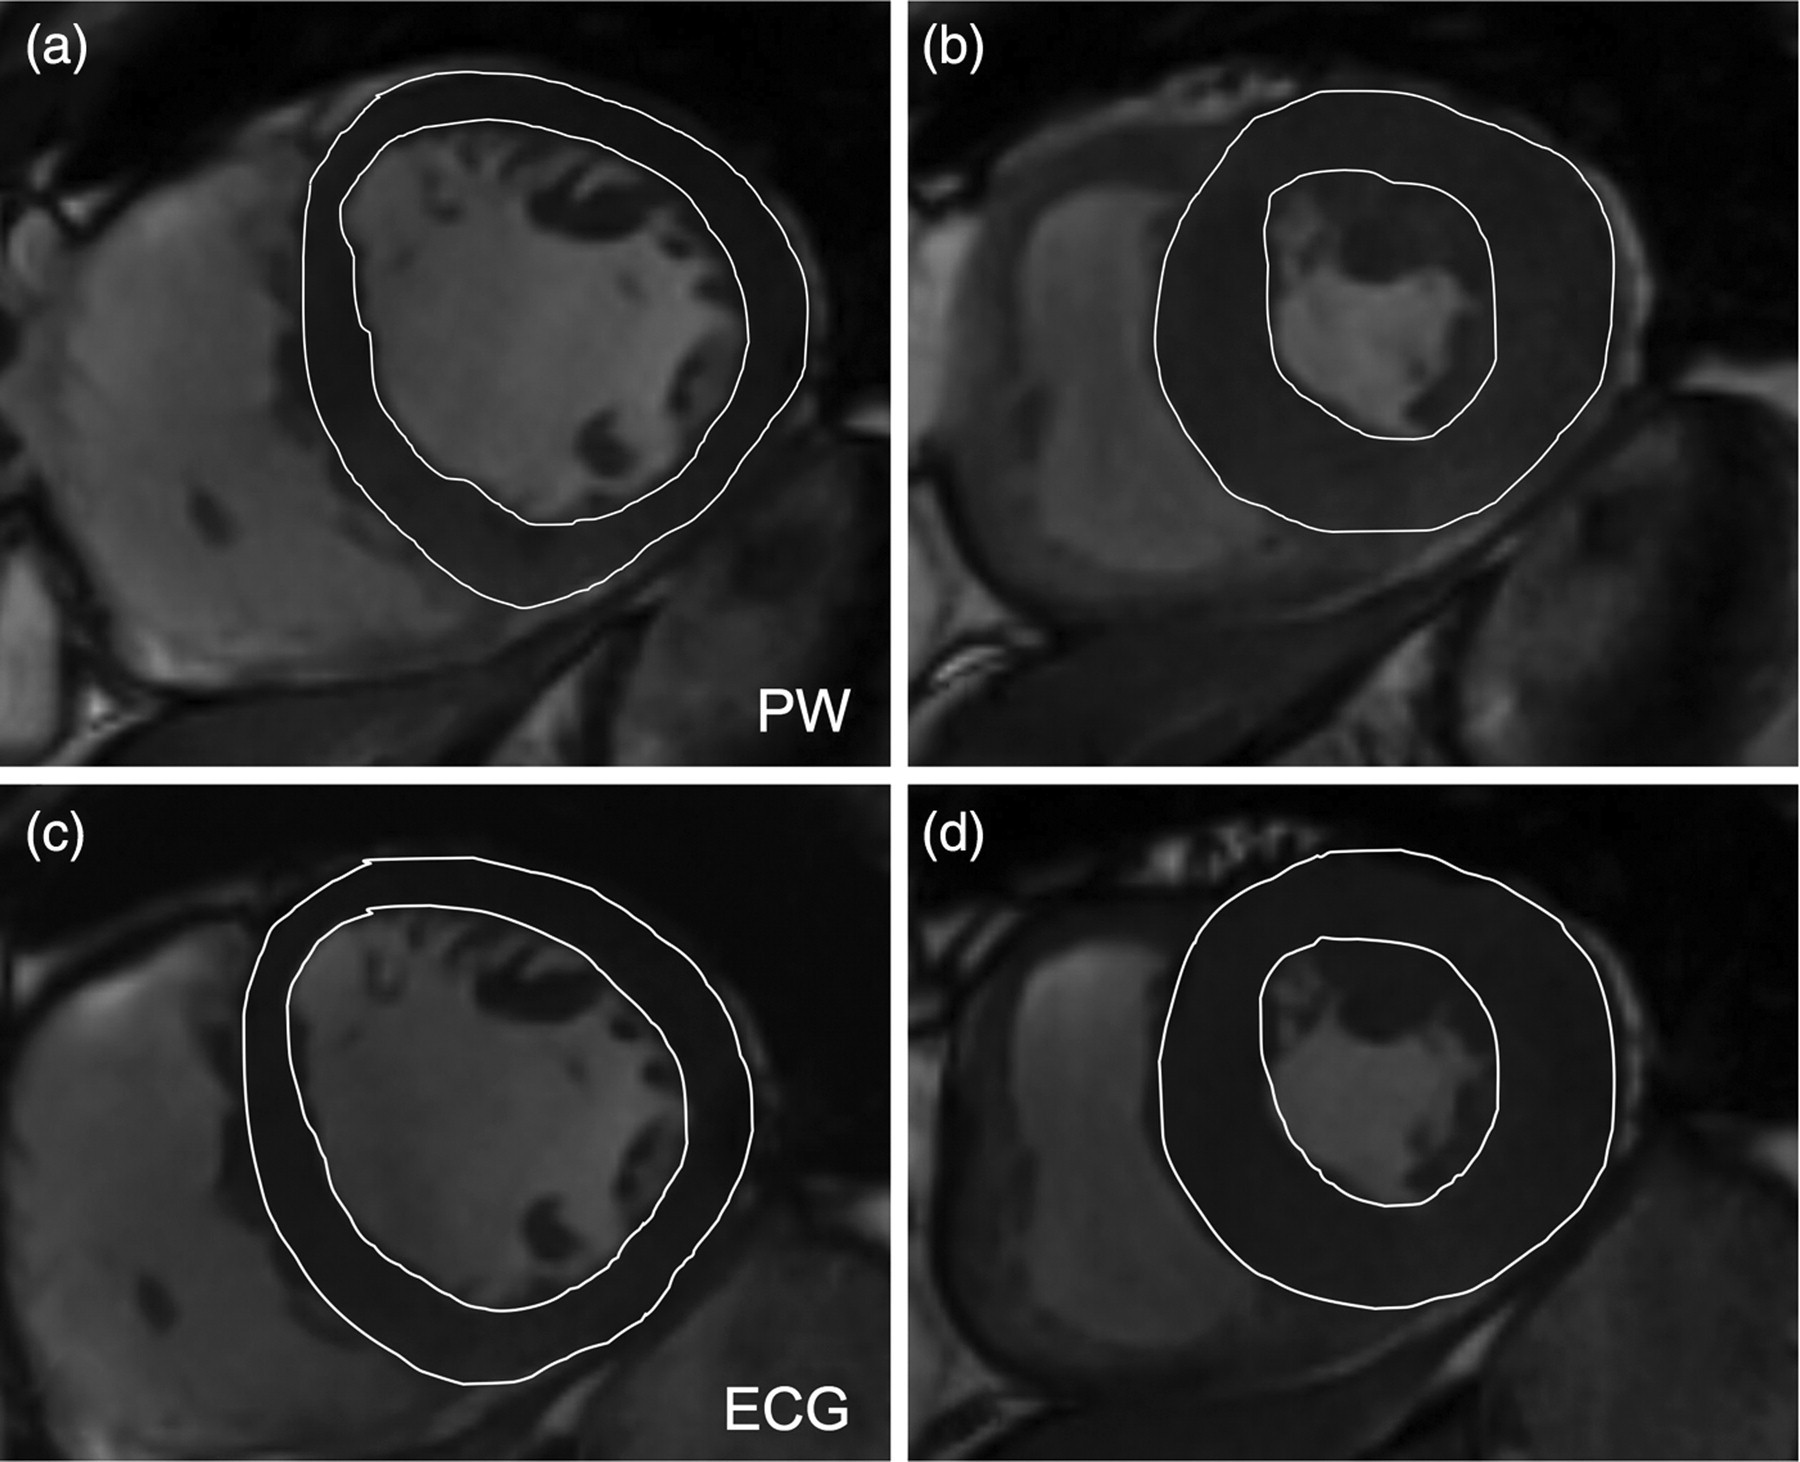
Image examples of short-axis slices at the mid-ventricular level in end diastole (a, c) and end systole (b, d). Images were acquired pulse wave (PW) triggered (a, b) and ECG triggered (c, d). Note, there is no visible difference in endocardial and epicardial drawings between ECG and pulse wave triggering
Left ventricular end-diastolic volume (EDV) and end-systolic volume (ESV) were calculated from the sums of the outlined areas using the slice summation method. Left ventricular ejection fractions (EF) were calculated from the formula EDV–ESV/EDV x100. Left ventricular mass was calculated on the basis of EDV and the epicardial end diastolic volume measurement, and determined as a product of myocardial volume and specific gravity: (Epicardial end diastolic volume – EDV) * 1.05.
Wall motion scoring
Wall motion abnormalities were scored visually by consensus of two experienced observers (MW, BS) for both techniques (ECG and pulse wave triggering) using the standard 17 segment model (23) and a 4-point scoring scale: 1 = normal, 2 = hypokinetic, 3 = akinetic, 4 = dyskinetic.
Visual image quality scoring
Consensus reading was performed on all cine imaging datasets in a blinded and random order by two observers (BS, MW). Image quality was assessed by using a 3-point scoring scale: 1 = poor (left ventricular borders are markedly blurred and/or can hardly be defined), 2 = good (left ventricular borders are moderately to mildly blurred, and/or can reasonable be defined), 3 = very good (left ventricular borders are sharply defined).
Reproducibility
The entire data-set of all subjects was re-analyzed by a third experienced observer (NK) to assess inter-observer variability for volume, EF and mass measurements. The observer was blinded to the previous results. The second analysis was performed at least 10 days after the first analysis.
Statistical analysis
Continuous data are expressed as mean ± SD, except where noted. Comparisons between analysis methods were made using the Wilcoxon matched-pairs signed-ranks test. All statistical tests were two-tailed; p < 0.05 was considered significant. Inter-observer reproducibility were assessed using the method of Bland and Altman (24). Statistical analysis was performed with Stata 10.1 (Intercooled Stata 10.1 for Windows).
Results
All subjects had regular sinus rhythm. The heart rate was not different between short-axis imaging with ECG and pulse wave triggering (68.3 ± 7.2 bpm versus 67.8 ± 8.3 bpm, p = 0.81).
ECG triggering was successful in 28 patients (65.1%) and failed in 15 patients (34.9%). These 15 patients had ECG trigger problems due to artifacts and/or high T-waves on ECG, and were excluded from analysis because the comparison to pulse wave triggering could not be performed. Pulse wave triggering was successful in all patients. Thus, analysis was performed in the 28 patients (nine women, mean age 57 ± 18 years, range 35–75 years, seven patients with impaired left ventricular function, 12 patients with coronary artery disease and regional wall motion abnormalities) with both reliable ECG and pulse wave signals.
The image acquisition time for standard 2D SSFP short-axis imaging was 194 ± 10 s with ECG triggering and 195 ± 11 s with pulse wave triggering. The second set of short-axis images was acquired 48 ± 7 s after the first stack of short-axis images.
Left ventricular function ECG versus pulse wave triggering
Left ventricular end-diastolic (EDV), end-systolic volumes (ESV), stroke volume (SV), ejection fraction (EF), and mass measurements with ECG and pulse wave triggering, and the differences in volumes, EF and mass between both trigger methods are displayed in Tables 2 and 3, respectively. There were no significant differences in EDV, SV, and mass between the two trigger methods (ECG compared to pulse wave triggering, p ≥ 0.179). Differences were significant only for ESV and EF (p ≤ 0.011). However, these differences were very small (0.59 ± 1.1 mL for ESV and 0.32 ± 0.6% for EF, Table 3). Bland Altman plots of the differences between the two methods are displayed in Fig. 4.
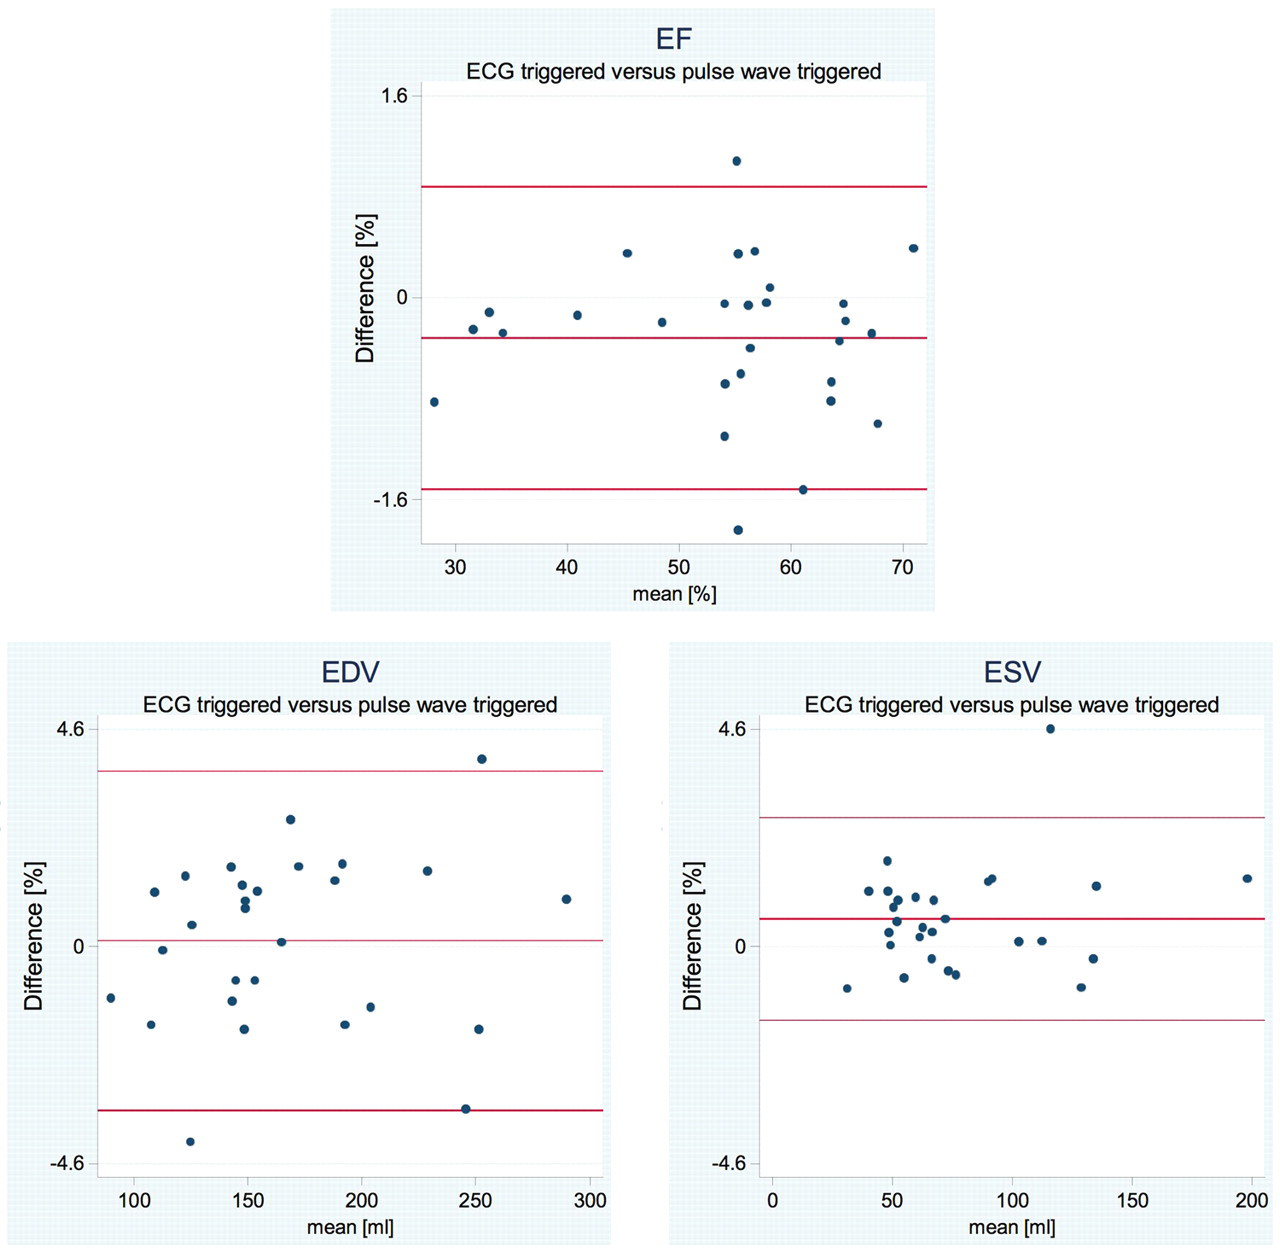
Bland Altman plots for the comparison between pulse wave triggering and ECG triggering for ejection fractions (EF), end-diastolic volumes (EDV), and end-systolic volumes (ESV)
Volumes (EDV, ESV, SV), ejection fraction (EF) and left ventricular mass calculated from short-axis images acquired ECG and pulse wave triggered
EDV = end-diastolic volume, ESV = end-systolic volume, SV = stroke volume, EF = ejection fraction, SD = standard deviation
Differences between volumes (EDV, ESV, SV), ejection fraction (EF) and left ventricular mass calculated from short-axis images acquired ECG and pulse wave triggered
*Wilcoxon signed-rank test
EDV = end-diastolic volume, ESV = end-systolic volume, SV = stroke volume, EF = ejection fraction, SD = standard deviation
In patients with impaired left ventricular function, volumes (EDV, ESV, SV), EF and mass were not significantly different between ECG triggering and pulse wave triggering (p ≥ 0.128).
Wall motion scoring
Wall motion abnormalities were present in 15 patients with ECG and in the same 15 patients with pulse wave triggering (anterior in eight patients, lateral in four patients, inferior in six patients, and septal in five patients; six patients had >1 wall motion abnormalities). Wall motion scores did not differ between ECG and pulse wave triggering (p ≥ 0.295).
Visual image quality scoring
The image quality between the short-axis image acquired with ECG triggering and those acquired with pulse wave triggering was similar (2.85 ± 0.3 versus 2.82 ± 0.4, p = 0.33; Fig. 2).
Reproducibility
Inter-observer variabilities for short-axis cine imaging with ECG triggering and pulse wave triggering are displayed in Table 4. Bland Altman plots (Fig. 5) showed good agreement for left ventricular function measurements between the two observers.
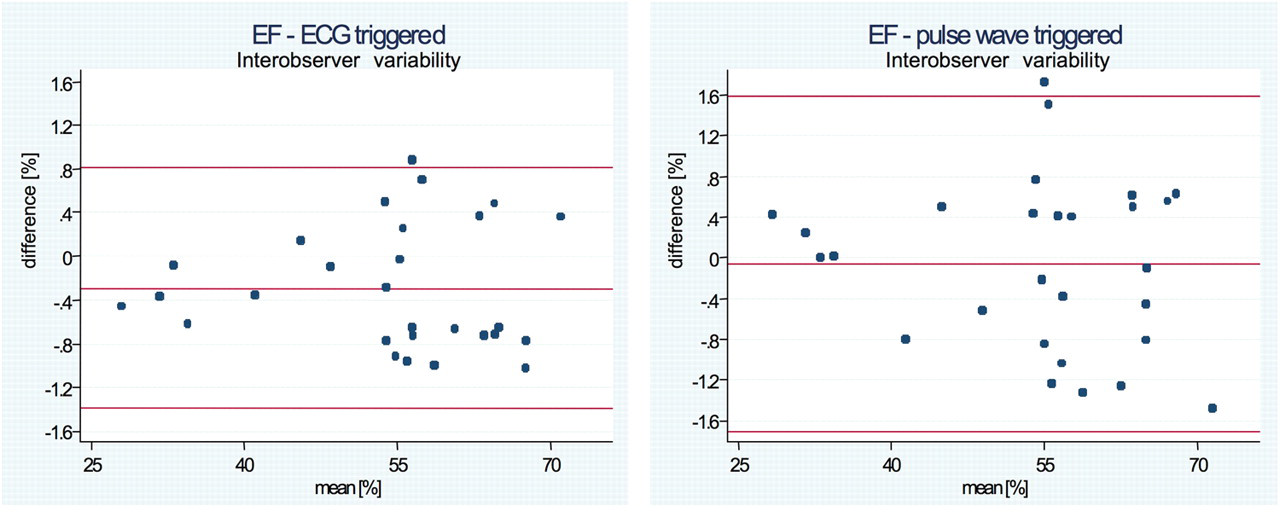
Bland Altman plots of the inter-observer variability for ejection fraction (EF) between the two observers
Difference in volumes (EDV, ESV, SV), ejection fraction (EF) and left ventricular mass between the two observers, and limits of agreement
EDV = end-diastolic volume; ESV = end-systolic volume; SV = stroke volume; EF = ejection fraction; SD = standard deviation
Discussion
We studied the differences in left ventricular function measurements between retrospective ECG gating and pulse wave triggering using standard steady-state free precession short-axis cine imaging and 3T-CMR in patients with preserved and impaired left ventricular function. To our best knowledge this is the first study that systematically compared volume, EF, and mass measurements with pulse wave triggering to ECG triggering using 3T-CMR short-axis cine imaging and retrospective gating.
We found differences in volumes, EF and mass between the two trigger methods to be very small and significant only for ESV and EF (p ≤ 0.011) in patients with preserved left ventricular function. These small differences (0.59 ± 1.1 mL for ESV and 0.32 ± 0.6% for EF) may not be of clinical relevance. In addition, left ventricular function and mass measurements were highly reproducible between the two observers for both ECG and pulse wave triggering.
The image quality between ECG and pulse wave triggering was similar (p = 0.33), and endocardial and epicardial borders could precisely be visualized with both trigger methods (Fig. 2).
However, distinctions regarding the timing/start of image acquisition between ECG and pulse wave triggering and the more clumsily shape of the pulse wave might have contributed to the small differences in the results. With pulse wave triggering, image acquisition might have started slightly later within the cardiac cycle (during ventricular systole) compared to ECG triggering. The reason is that the pulse wave velocity peaks a little later than the R-wave occurs on the ECG. However, the pulse sequence used for image acquisition was retrospectively gated and thus, supposed to cover the entire cardiac cycle. Volume, ejection fraction and mass measurements should therefore not have been affected. Nevertheless, due to the broader shape of the pulse wave its peak is more difficult to define and may slightly vary between the cardiac cycles. This could explain the small differences in the results.
The main reason for ECG signal disturbances and distortions is the magnetohydrodynamic effect. When a conductive fluid travels through a magnetic field, a voltage in the direction orthogonal to both the magnetic field lines and the direction of flow of the fluid is induced (5, 25, 26). This phenomenon is called ‘magnetohydrodynamic effect’. The magnitude of the voltages produced by the magnetohydrodynamic effect is determined by the velocity of flow of the fluid, the diameter of the tube through which the fluid is flowing, and the strength of the magnetic field (5, 25, 26). CMR typically relies on the use of an ECG signal to synchronize segmented data acquisition to the cardiac cycle (18). Thus, acquisition is synchronized to the R-wave as the waveform with the largest magnitude. Hence, achieving good image quality greatly depends on a reliable trigger signal in order to guarantee that accurate data collection always starts at the same point of the cardiac cycle. However, accomplishing an accurate R-wave peak detection, and thus, a correct synchronization is often obstructed by the high corruption levels of the ECG signal due to the magnetohydrodynamic effect, especially when high resolution imaging is performed and high static magnetic fields as well as strong and fast switching gradients are used (5). Patients often have to be removed from the bore of the magnet in order to reposition the electrodes and obtain a reliable signal. The magnetohydrodynamic effect is typically observed during the ST-segment and at the beginning of the T-wave. This can potentially cause the magnitude of the T- wave to become greater than the R-wave and may lead to incorrect R-wave detection resulting in difficulties for ECG-gated CMR (5, 8, 27). As scanners evolve to higher magnetic field strengths (3 Tesla and higher) in clinical use, the magnetohydrodynamic effect worsens the quality of the ECG, and adversely affect the diagnostic usefulness of the ECG in the magnet (5, 8, 27). In addition, abnormalities of the patient's body habitus (e.g. scoliosis), chest geometry (e.g. expanded chest due to chronic obstructive pulmonary disease), and cardiovascular pathologies such as pericardial effusions may lead to ECG signals with low amplitudes and/or morphologies that make it difficult to obtain accurate ECG referencing. Pulse wave triggering might be a way to overcome these limitations.
Several approaches for CMR gating such as cancellation of the magnetohydrodynamic effect (28), vectorelectrocardiography (29), and self-gating (6, 28, 30) have been investigated to overcome the limitations of ECG in the CMR environment. Of those, self-gating might be the most promising approach, especially for high field magnets. This is a technique in which changes in the raw magnetic resonance data over time are used to form a signal that may be used for retrospective synchronization of data to the cardiac cycle. The self-gating signal is typically produced by sampling the center of k-space repeatedly during cine data acquisition by interleaving the collection of non-phase encoded k-space lines (6, 30). The main advantages of the self-gating approach are the following: (a) The self-gating signal does not suffer from the multiple sources of interference that corrupt the ECG; (b) Self-gating does not require a lead system, resulting in more patient and operator convenience, and reduced patient set-up time. Recently, acoustic triggering has been proposed for high field CMR with promising results (31, 32). However, to our best knowledge, none of these approaches has been implemented in clinical practice.
The vectorelectrocardiography algorithm used in our study resulted in a high failure rate (35%) due to unreliable R-wave detection. Other vector-ECG algorithms (29) may be more reliable and robust in high magnetic fields such as 3 Tesla.
There are several limitations of this study. We did not include patients with atrial fibrillation or other kinds of arrhythmias. Varying cardiac cycle lengths (e.g. in patients with atrial fibrillation) may compromise the accuracy of pulse wave triggering. In addition, pulse wave triggering may not be reliable applicable to patients with peripheral vascular disease. We aimed to demonstrate that pulse wave triggering is reliable in patients with preserved and impaired left ventricular function, and may be preferred in patients with ECG signal disturbances on high field magnets. Further studies need to be performed to test whether pulse wave triggering is also robust in patients with cardiac arrhythmias and peripheral vascular disease.
In conclusion, three Tesla standard multibreath hold short-axis cine imaging for left ventricular function and mass assessment can accurately be performed using pulse wave triggering. Pulse wave triggering may be used in clinical practice in patients with ECG distortion and trigger problems.