
Abstract
Background
Multidetector spiral computed tomography (CT) has opened the possibility of quantitative evaluation of emphysema extent in the whole lung. Visual assessment can be used for such a purpose, but its reproducibility has not been established.
Purpose
To assess agreement of detailed assessment of pulmonary emphysema on whole-lung CT using a visual scale.
Material and Methods
Thirty patients with chronic obstructive pulmonary disease underwent whole-lung inspiratory CT. Four chest radiologists rated the same 22 ± 2 thin sections using a visual scale which defines a range of emphysema extent between 0 and 100. Two of them repeated the rating two months later. Inter- and intra-operator agreement was evaluated with the Bland and Altman method. In addition, the percentage of emphysema at –950 Hounsfield units in the whole lung was determined using fully automated commercially available software for 3D densitometry.
Results
In three of six operator pairs and in one of two intra-operator pairs the Kendall τ test showed a significant correlation between the difference and the average magnitude of visual scores. Among different operators the half-width of 95% limits of agreement (95% LoA) was wide ranging between a score of 14.2–27.7 for an average visual score of 20 and between 18.5–36.8 for an average visual score of 80. Within the same operator the half-width of 95% LoA ranged between a score of 10.9–21.0 for an average visual score of 20 and between 25.1–30.1 for an average visual score of 80. The visual scores of the four radiologists were correlated with the results of densitometry (P < 0.001; r = 0.65–0.81).
Conclusion
The inter- and intra-operator agreement of detailed assessment of emphysema in the whole lung using a visual scale is low and decreases with increasing emphysema extent.
Pulmonary emphysema is along with chronic bronchitis the main pathological substrate of chronic obstructive pulmonary disease (COPD) that is an emerging cause of morbidity and mortality worldwide. Pulmonary emphysema is pathologically defined as an abnormal permanent enlargement of the air spaces distal to the terminal bronchioles, accompanied by destruction of alveolar walls, without obvious fibrosis (1). Computed tomography (CT) demonstrates in vivo pulmonary emphysema as areas of low attenuation, and this has several relevant clinical implications. First, while COPD is usually not diagnosed until it is symptomatic and moderately advanced, morphologic imaging with CT is able to detect early emphysema in asymptomatic subjects, and follow its progression over time (2–8). Second, it enables to phenotype COPD patients by measuring in each patient the contribute of emphysema to the functional obstructive pattern of the disease, a relevant issue in order to define therapy and prognosis (7, 8). Last, the capability to evaluate non-invasively the regional attenuation values can help to identify among emphysematous patients those who could benefit from a surgical approach (7, 8).
Multidetector spiral CT by enabling acquisition of contiguous thin collimation sections covering the whole lung in a single breath-hold has considerably augmented the possibility of quantitative evaluation of emphysema extent (6–8).
In general, quantification of pulmonary emphysema detected by CT can be pursued with different approaches including visual (9, 10), densitometry (11–13), and texture analysis (14–17) with their respective merits and drawbacks.
Visual rating is relatively simple, can be performed by radiologists and pulmonary physicians, is relatively independent from scanning protocol and does not require any software. For these reasons it is currently used in daily practice and in clinical investigations alone or in combination with densitometry (5, 18–26). It is based on classification of emphysema into generally five categories of increasing extent, namely 0%, 1–25%, 26–50%, 51–75%, and 76–100%. Visual rating was developed when few sections of the lung were obtainable with sequential CT (9). In multidetector spiral CT acquisitions visual assessment can be made comprehensively, on the whole lung or in three portions (typically the upper, mid, and lower) of the lung (5, 18, 19), or in a detailed way, namely slice-by-slice, in a variable number of CT sections (21–23). It is conceivable that only a detailed assessment might be sensitive enough to reveal small changes over time of pulmonary emphysema extent.
The main limitation of visual rating of pulmonary emphysema is the operator-dependence.
So far the reproducibility of the visual rating for assessment of pulmonary emphysema has been incompletely and variably addressed. In particular inter- and intra-operator agreement was investigated using the correlation coefficients (18, 20, 22) or the kappa statistics (19, 21, 23). The latter entails two basic options: (a) direct use of the visual rating in the case of the comprehensive evaluation; (b) creation of a variable number of classes, typically 5, 10, or 20 classes, from the individual composite visual score of the subject, in the case of the detailed evaluation (23). However, visual rating scores of pulmonary emphysema should be treated as a continuous variable when a large number of sections are assessed (27).
In this study the Bland-Altman method to estimate the inter- and intra-operator agreement of the visual rating was performed on a large number of sections for detailed assessment of the pulmonary emphysema extent on whole lung CT. For comparison we also obtained 3D densitometry of the lung in the same patients using fully automatic commercially available software.
Material and Methods
The hospital ethical committee approved the study and informed consent was obtained by all patients.
Patients
Thirty consecutive clinically stable patients with COPD (28) (23 men and 7 women; age 68 ± 8 years, range 52–81 years; packs/year 47 ± 23, range 6–120) were enrolled. They were classified according to the degree of airways obstruction as stated in the Global Initiative for Chronic Obstructive Lung Disease (GOLD) program (29) as follows: four patients were in GOLD class 1, 13 in class 2, 12 in class 3, and one in class 4.
Their clinical and functional characteristics were previously reported in a study in which only inter-operator agreement of the detailed visual assessment of pulmonary emphysema extent in the whole lung was addressed using kappa statistics (23).
Among pulmonary function tests (PFTs) we selected diffusing capacity of the lung for carbon monoxide (DLCO), functional residual capacity (FRC), residual volume (RV), and total lung capacity (TLC) to be correlated with the results of the detailed visual assessment of pulmonary emphysema and whole lung densitometry.
CT examination
All CT examinations were performed on a 16-row detectors scanner (Sensation 16; Siemens, Erlangen, Germany) using a detector configuration of 16 × 0.75 mm, 140 kVp, 150 effective mAs, tube rotation time of 750 ms, and a pitch of 1.5. A single spiral acquisition was obtained from the apex to the base during one breath-hold obtained at end inspiration. The acquisition time was 8–12 s. Dose modulation was not applied during scanning.
As recommended (8) data were reconstructed in two modes: one, for visual scoring, with thin (1 mm) sections, sharp filter (B70S) and 1 mm reconstruction increment; the other, for densitometry, with the 5-mm-thick sections, smooth filter (B31S) and 5 mm reconstruction increment.
No intravenous contrast material was administered.
Visual rating
Four chest radiologists with at least 10 years of experience visually rated pulmonary emphysema extent. Two of them heretofore labelled as ‘expert’ radiologists, had previously scored more than 500 CT examinations for pulmonary emphysema, using the scale adopted in the present study or others. The ‘expert’ radiologists were requested to repeat visual scoring 2 months after the first rating session. The four chest radiologists were blinded to the assessment of the other operators and the ‘expert’ radiologists to their first assessment. All the operators were aware that the patients had COPD, but they did not know the results of the GOLD classification and of the pulmonary function tests.
To rate the extent of emphysema the operators utilized the scale proposed by Goddard et al. (9). In consideration of the prohibitive time needed to evaluate all the 1 mm thick sections covering the entire lungs they were requested to perform the score on every 10 thin section from the apex to the base. To reduce the source of inter- and intra-operator variability, the operators were provided the position number of the sections to be evaluated in all patients, which were determined by a radiologist not involved in the visual assessment. The mean number of sections evaluated for each patient was 22.1 ± 2.3 (range 18–27). The mean time for the entire detailed visual scoring was 5.15 min (range 4.10–6.5 min).
Each section was assessed individually and the right and left lungs were graded separately according to the percentage area showing changes consistent with emphysema, namely areas of low attenuation, lung destruction, or vascular disruption. No distinction was made among centrilobular emphysema, panlobular emphysema, paraseptal emphysema, and bullous emphysema: all these were considered altogether as contributing to the overall extent of the emphysema in the selected sections. A score of 0 was assigned if there was no abnormality; a score of 1 was given if less than 26% of the lung parenchyma showed emphysema changes; a score of 2, 3, and 4 was assigned when emphysema changes involved 26–50%, 51–75%, or more than 75% of the lung parenchyma. Examples of the visual rating are provided in Fig. 1. The patient's emphysema score was then calculated by adding the emphysema scores for each side and section and dividing by the total possible maximal score (number of sections multiplied by 4 and by 2). Therefore, a patient without emphysema should score zero, whereas a patient with an overall extent of emphysema greater than 75% of lung parenchyma should score 100.
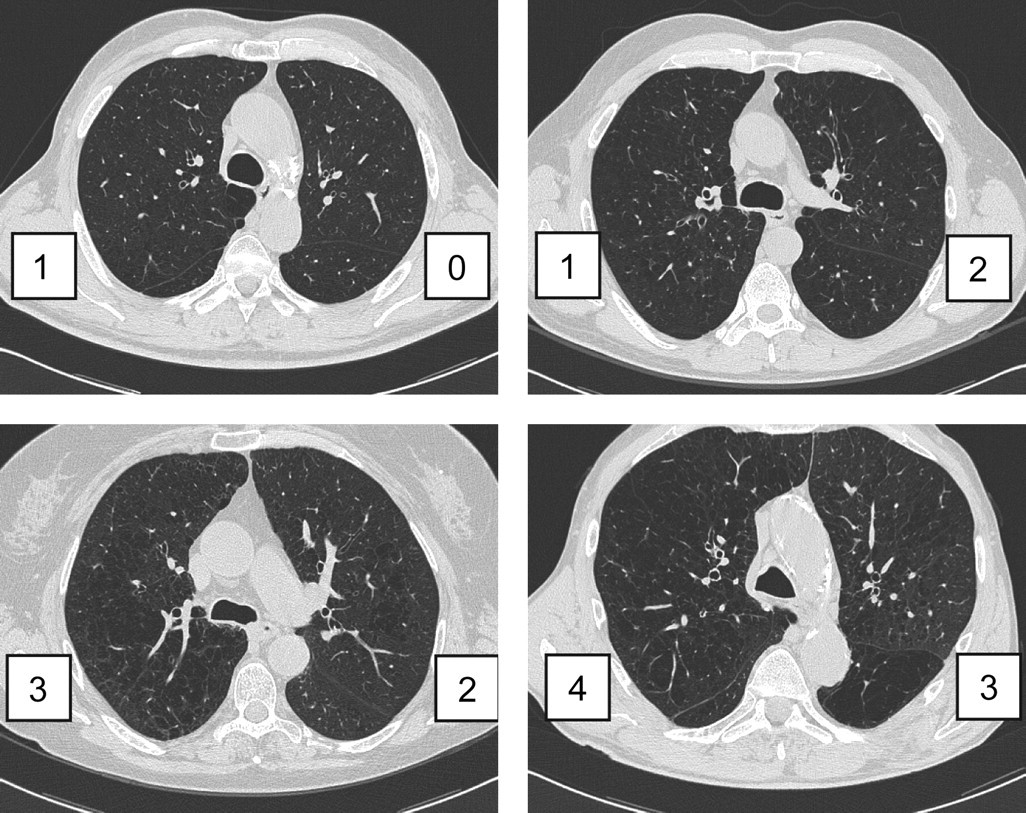
Examples of visual rating of extension of pulmonary emphysema on CT according to Goddard scale
Visual assessment was carried out on a remote work-station (Leonardo; Siemens, Erlangen, Germany). Although visualization at a window width of 1,500 HU and window level (–500 HU) was recommended, the operators were free to modify these settings.
Densitometric evaluation
Two of the chest radiologists (one ‘expert’) independently performed the densitometric evaluations twice in the 30 CT examinations with a minimum interval of two weeks between the first and the second measurement and of 2 months from the last visual scoring.
For densitometry they used the ‘InSpace’ (version 2009A.17, Siemens) software which calculates several densitometric parameters variably correlated to the macroscopic and microscopic extent of pulmonary emphysema (2) including the relative area at –950 HU (RA950) on the whole lung volume after 3D segmentation. For the present work, segmentation was based on the threshold automatically computed by the system. Although the threshold also can be selected by the operator, the software does not allow manual correction of the segmented object. The quality of each 3D segmentation was visually checked by the operator before inclusion of the densitometric data in the analysis. The mean time for 3D segmentation of the whole lung was 11 s (range 7–13 s).
Statistical analysis
Since the visual score arises from observations which can only take certain numerical values, they can be thought as numerical discrete data. Nevertheless, the visual score can assume a large number of different possible values when a large number of sections are considered. Hence we treated visual score as continuous data for the statistical analyses (27). To measure the inter- and intra-operator agreement of the visual score of emphysema extent we used the Bland and Altman method (30–32). Preliminarily a Kendall τ test was carried out in the case of both inter- and intra-operator agreement to explore if there was a significant (P ≤ 0.05) correlation between the difference and the average magnitude of the visual scores. In the case of inter-operator agreement all pairs of operators were separately analyzed for a total of six pairs. Presence of a significant correlation between difference and the average magnitude of visual scores prevents to find a single standard deviation (SD) estimate for all data range. To overcome this difficulty, a regression approach for non-uniform differences was used, as recommended (32). Since some operators showed a significant Kendall τ test and others did not (see Results section), in order to homogeneously treat and present the data we decided to extend the regression approach to all possible operator combinations.
To describe the variability of measurements, we used the half-width of 95% limits of agreement (LoA) which can be simply computed by the following formula: (upper 95% LoA – lower 95% LoA)/2.
A simple descriptive statistics of the densitometric results was performed. Moreover the Pearson r correlation coefficient between the result of densitometry and the detailed visual score of the four radiologists was calculated.
The correlation of the results of the PFTs with those of the visual and densitometric measurements was assessed with the Spearman rank correlation test. For the visual scores we considered the first scoring obtained by each radiologist.
Results
The averaged (among four raters) mean visual score in the 30 patients was 36 ± 29 (range 0–92) and the distribution of emphysema extent is shown in Fig. 2.
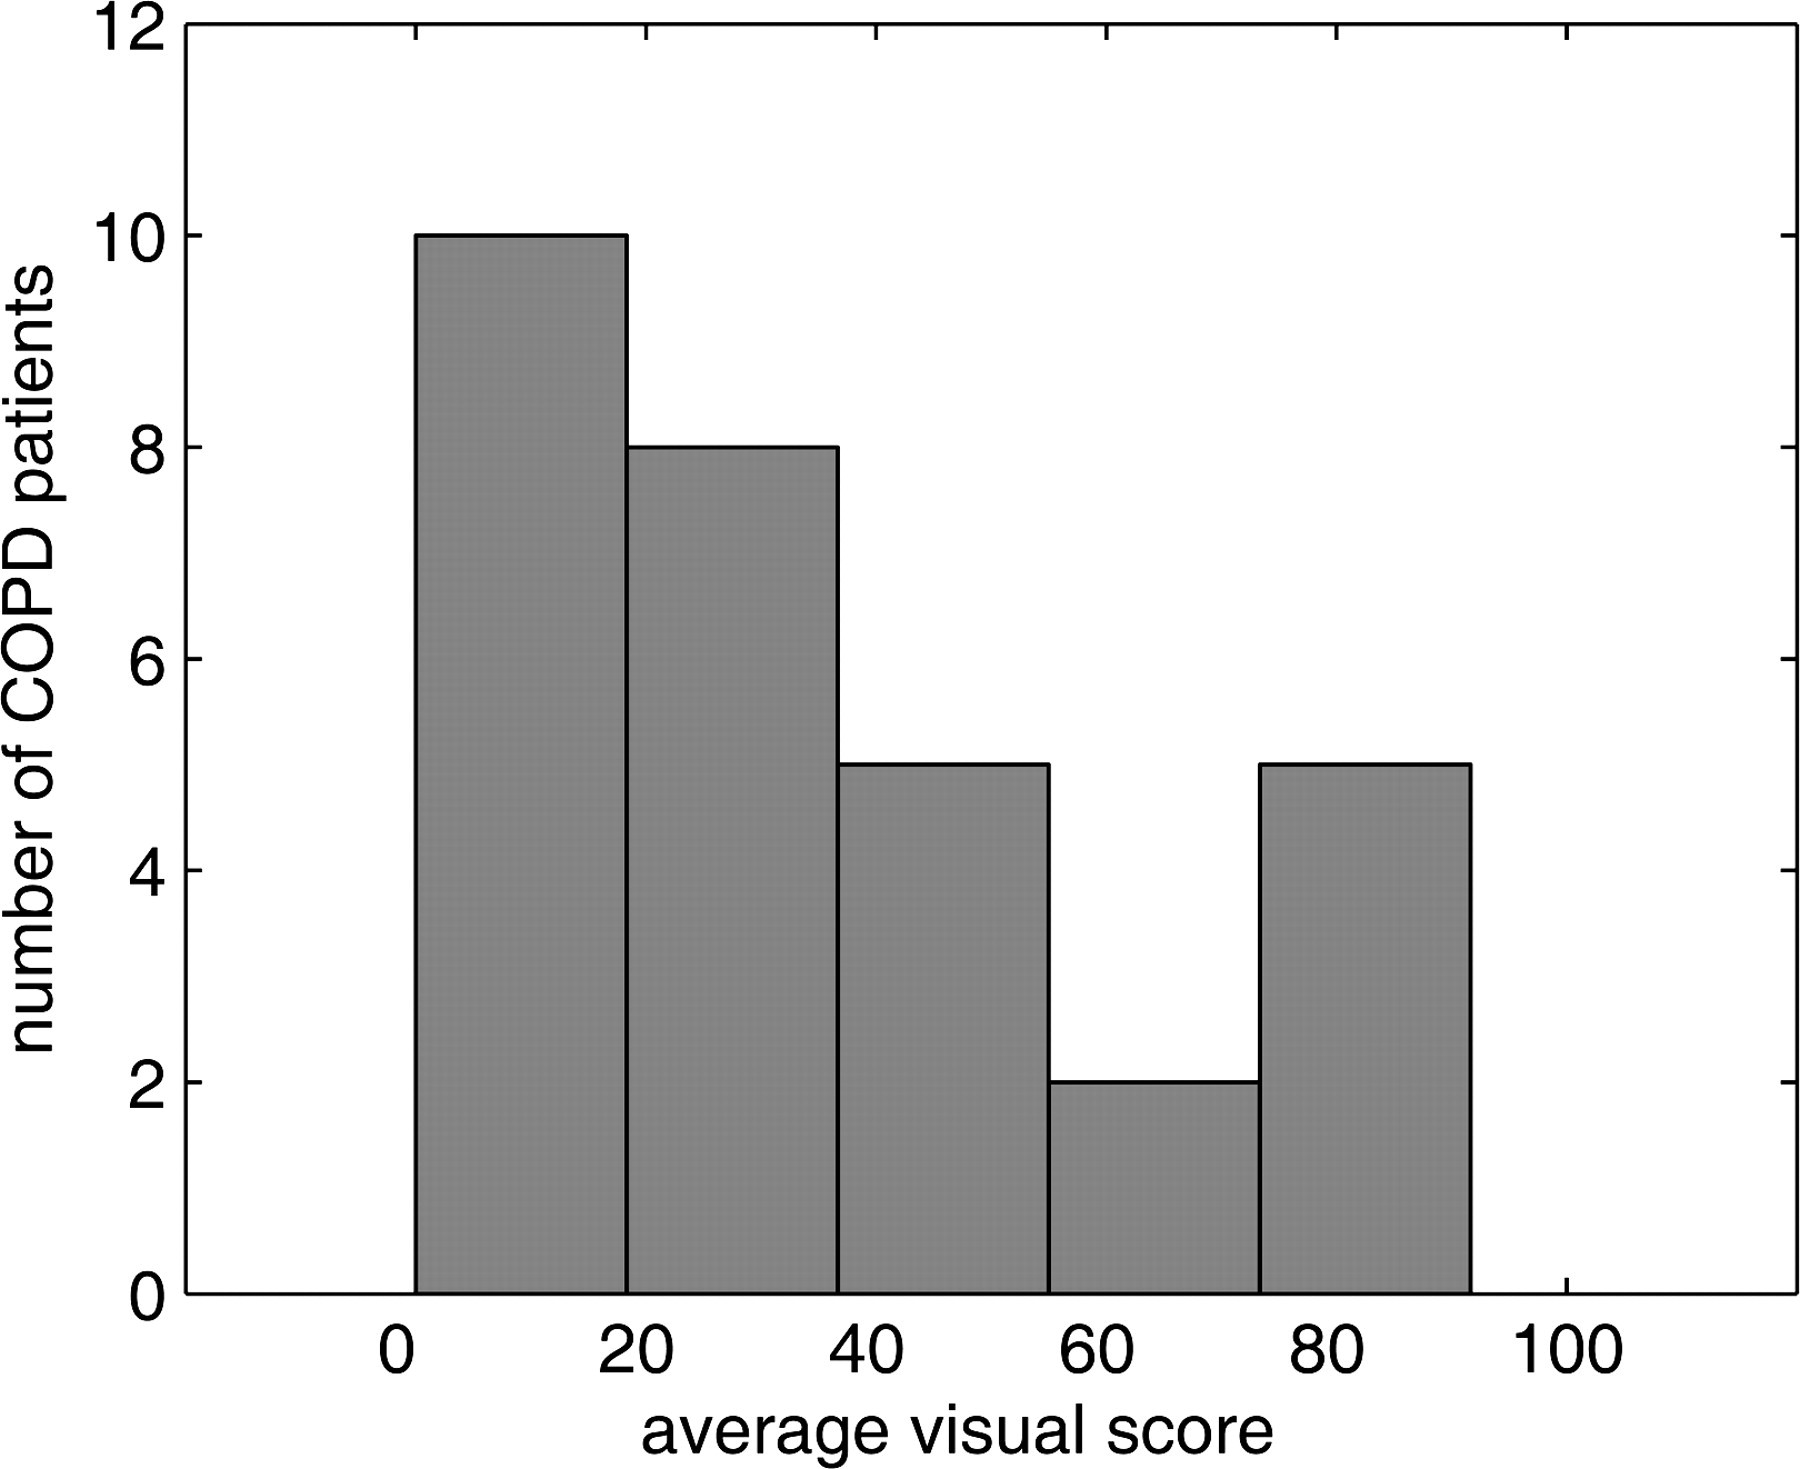
Histogram distribution of the average visual score of the extent of pulmonary emphysema on CT performed by 4 raters in 30 patients with COPD. Dividing the sample in fifths it is observed that the majority of patients had no or little extent of emphysema belonging to the first quintile, and the minority of patients had moderate emphysema
Visual inter-operator reproducibility
In three of six operator pairs the Kendall τ test showed a significant correlation between the difference and the average magnitude of visual scores (Table 1, Fig. 3). Moreover the mean difference lines were invariably shifted from the zero line and showed varying slopes.
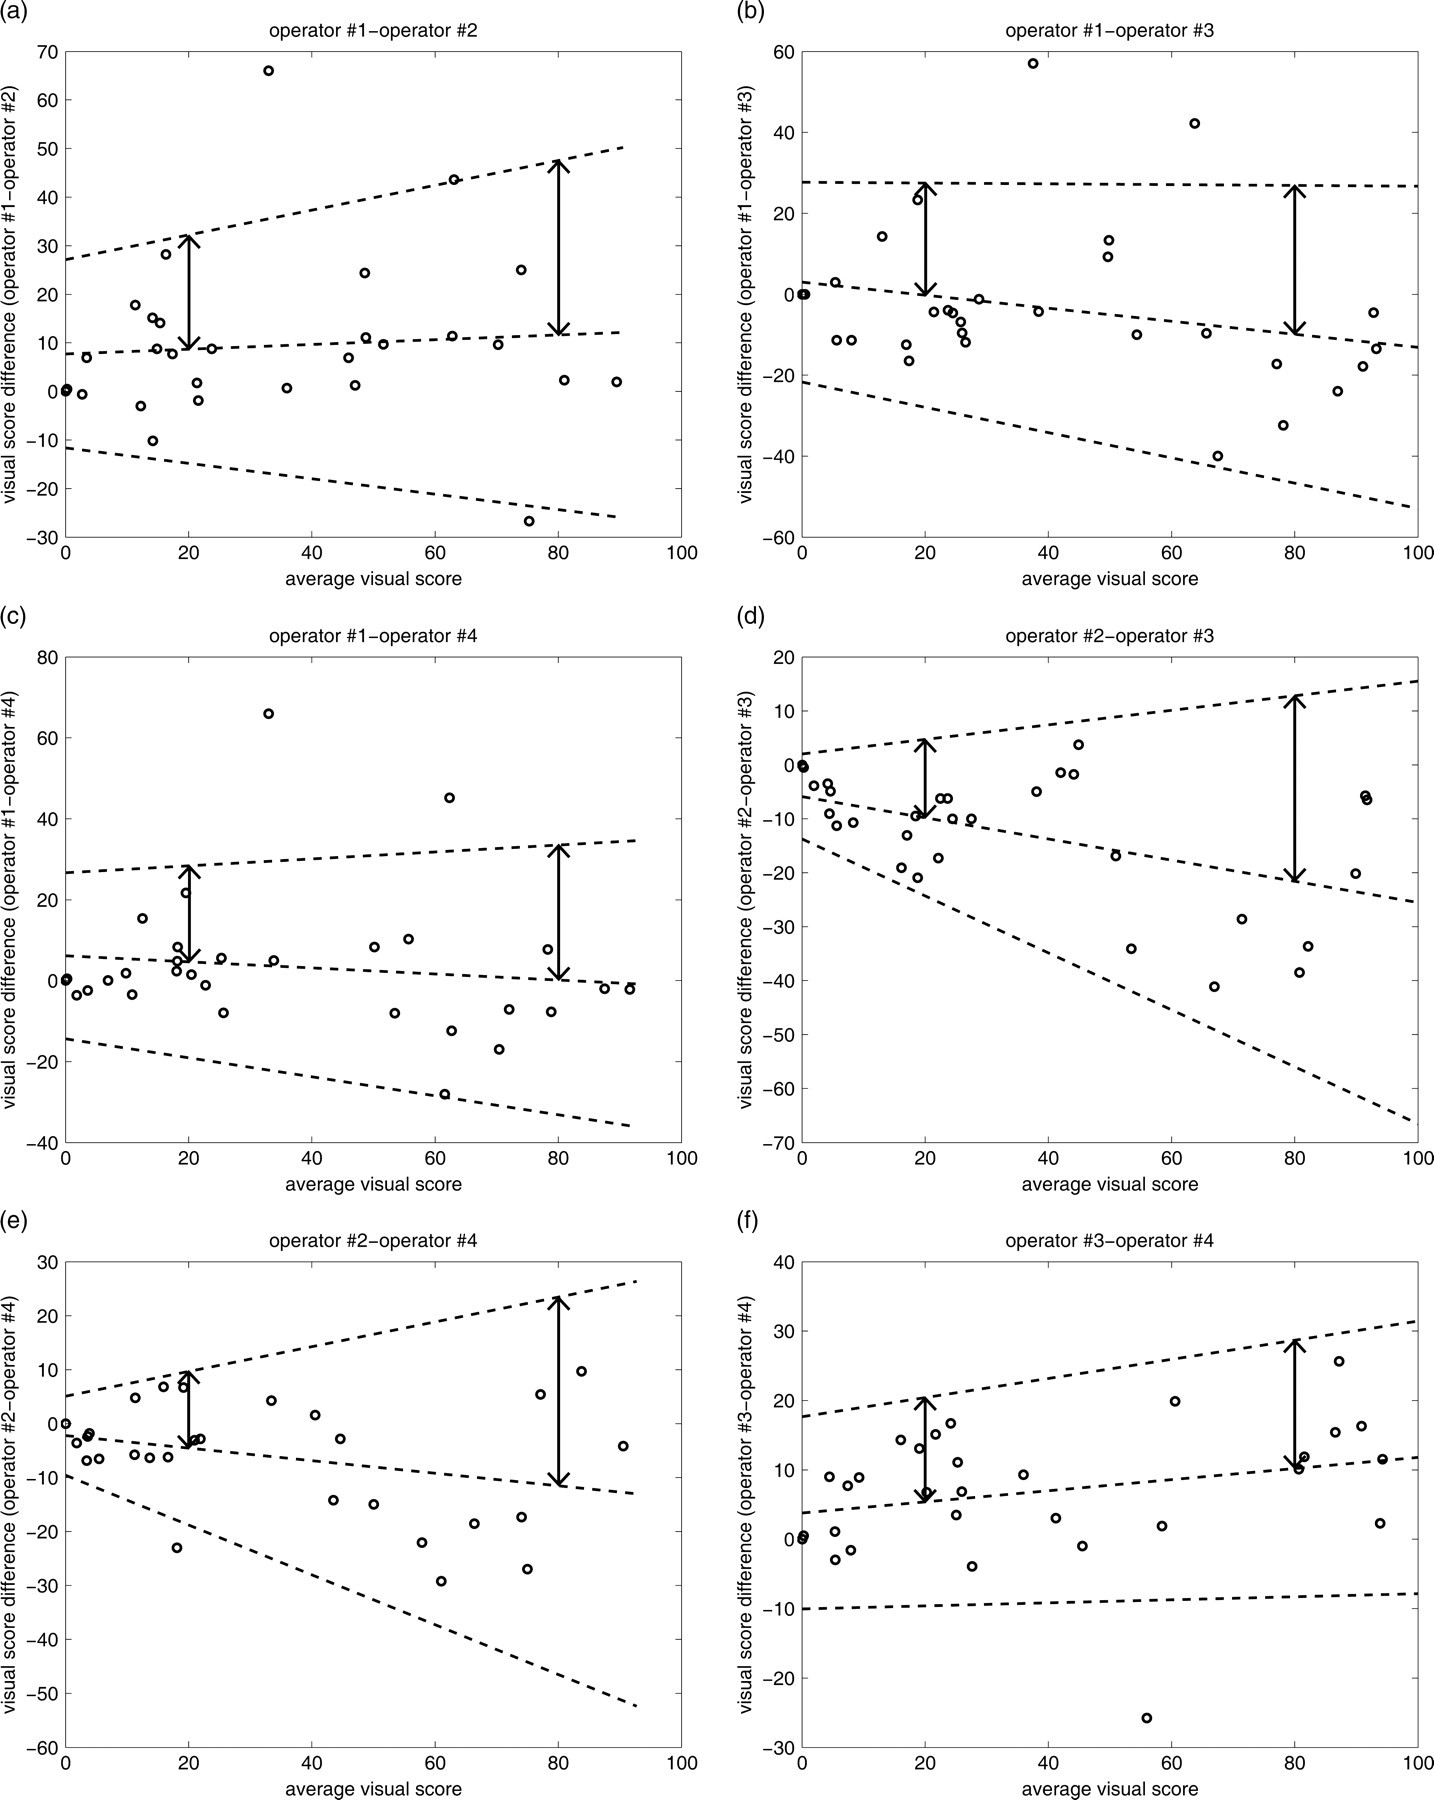
(a–f) Inter-operator reproducibility. For each pair of operators the plot shows the difference against the average measurement along with the mean difference and 95% limits of agreement using the regression approach. The vertical arrows identify the half-width 95% LoAs for the case of visual rating of 20 and 80. Note that the mean difference lines are shifted from the zero line and show varying slopes
Results of Kendall τ test between the difference and the average magnitude of visual scores along with half-width of 95% limits of agreement between different operator pairs and within the same operator at low (20) and high (80) visual score are shown
Among different operators the half-width of 95% LoA ranged between 14.2–27.7 for an average visual score of 20 and between 18.5–36.8 for an average visual score of 80 (Table 1).
Visual intra-operator reproducibility
In one of the two expert radiologists the Kendall τ test showed a significant correlation between the difference and the average magnitude of visual scores of the two successive readings (Table 1, Fig. 4). Moreover the mean difference lines were invariably shifted from the zero line and showed varying slopes.
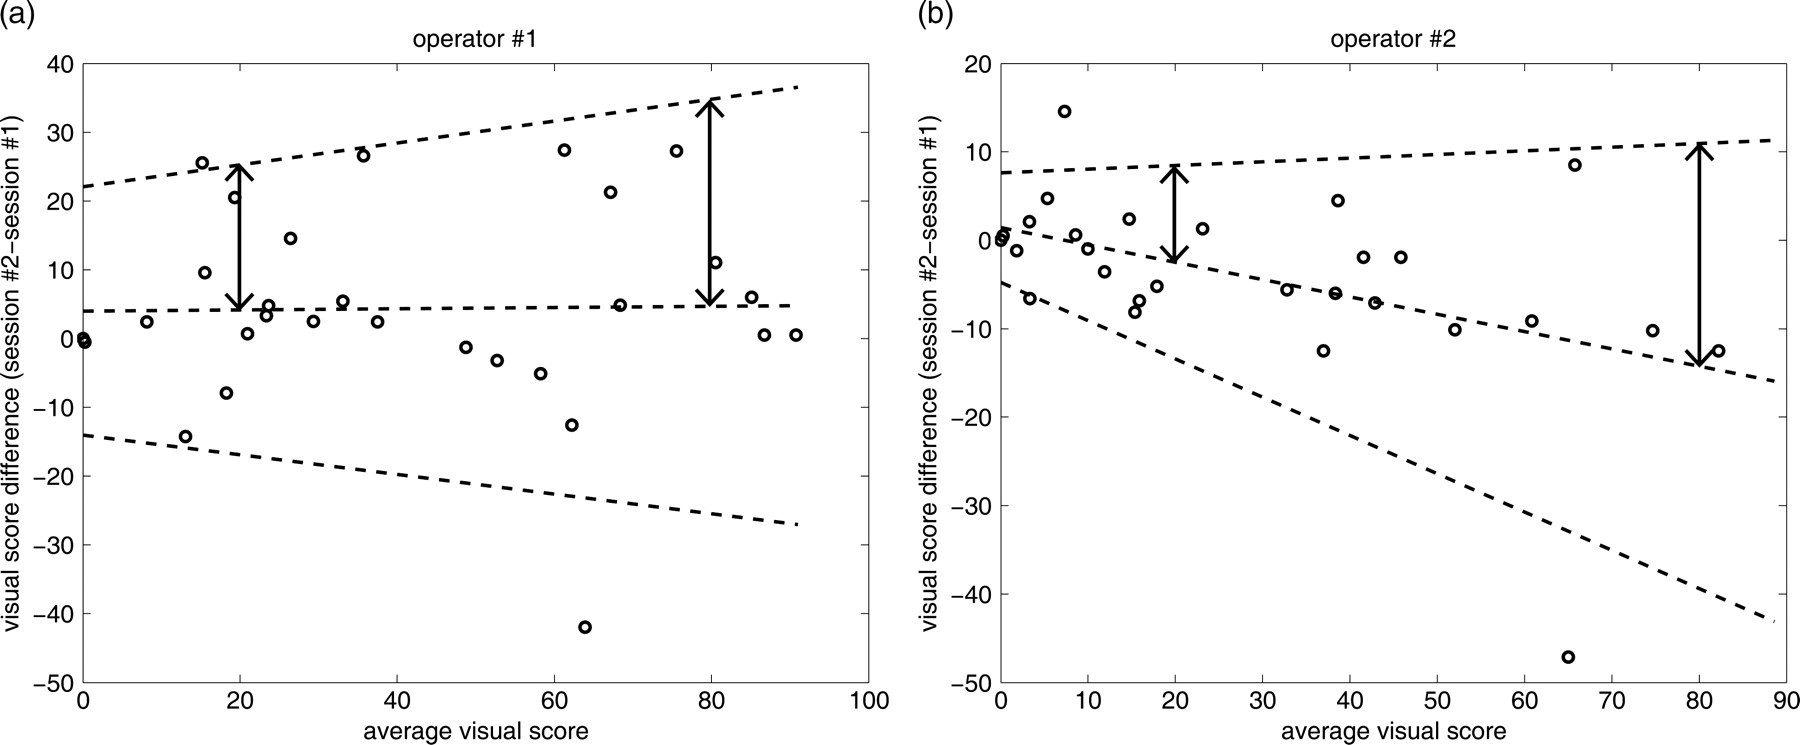
(a, b) Intra-operator reproducibility. For each pair of operators the plot shows the difference (session #2–session #1) against the average measurement along with the mean difference and 95% limits of agreement using the regression approach. The vertical arrows identify the half-width 95% LoAs for the case of visual rating of 20 and 80. Note that the mean difference lines are shifted from the zero line and show varying slopes
Within the same operators the half-width of 95% LoA ranged between 10.9–21.0 for an average visual score of 20 and between 25.1–30.1 for an average visual score of 80 (Table 1).
Whole-lung densitometry
In one patient segmentation failed since it included within the segmented lung the air contained in a distended colon.
The RA950 values measured by the two operators were identical also on the two measurement sessions of the same operator and were 9.3 ± 8.6 (range 0–29.4).
The correlation between the RA950 and the detailed visual scores of the four radiologists was invariably significant (P < 0.001) (Pearson r average for the eight visual readings = 0.75; range 0.65–0.81) with higher values for the two ‘expert’ radiologists (range 0.69–0.81) as compared to the others (0.65–0.72).
Correlation with PFTs
The correlation coefficients between the results of PFTs, on the one hand, and the detailed visual rating of pulmonary emphysema and the whole lung RA950, on the other hand, are reported in Table 2. The correlation of DLCO with both visual assessment and densitometric evaluation was significant with R values for the four operators in a range between –0.61 and –0.76 and slightly higher than that of RA950 (–0.56). Of the other PFTs only the FRC was significantly correlated with the results of the visual assessment in two operators.
Spearman rank correlation coefficients between visual and whole lung densitometric evaluation of pulmonary emphysema and pulmonary function tests in 30 patients with COPD
*‘Expert’ radiologist
† P < 0.01
DLCO = diffusing capacity of the lung for carbon monoxide; FRC = Functional Residual Capacity; RV = Residual Volume; TLC = Total Lung Capacity; % pred = percentage of the predicted value; RA950 = whole lung relative area at −950 HU
Discussion
Our study demonstrates that detailed assessment of the extent of pulmonary emphysema in whole lung CT using a visual scale has a low inter- and intra-operator reproducibility, which is dependent on the visual score magnitude. In our opinion the main reason of the low inter- and intra-operator agreement resides in the difficult differentiation in COPD patients between areas of emphysema and low attenuation areas due to air trapping in inspiratory CT scans.
We included in this prospective study only patients with COPD in whom severity of pulmonary emphysema on CT is usually evaluated. We utilized state-of-the-art CT scanner technology and examination protocol. The readers were chest radiologists who adopted a simple visual scale widely utilized in scientific reports and clinical practice which takes into account only extent of pulmonary emphysema. In a prior study performed on three sections obtained with sequential CT (20) this scale showed a better inter-operator reproducibility than a scale taking into account extent and severity of emphysema (10).
The optimal number of sections to be visually rated for assessment of extension of pulmonary emphysema has not been established. In several studies a restricted number of sections were evaluated, typically three: at the carina and 5 cm above and 5 cm below (20, 24). However, evaluation of a large number of sections has become easily obtainable with multidetector spiral CT and is preferable for three reasons. First, it tends to reduce the inter-observer disagreement because it exercises an averaging effect. Second, it appears preferable for assessment of a diffuse and heterogeneously distributed disease as pulmonary emphysema (9, 22, 23). Third, it is probably fundamental if progression of emphysema over time has to be detected, since the latter might be subtle and hard to be perceived by a comprehensive evaluation using only five categories of emphysema extent.
In prior studies which adopted other measurements to assess the agreement of visual rating of pulmonary emphysema a good inter- and intra-operator agreement was reported (18, 20–22). Admittedly, a direct comparison of our results with those in previous studies is not possible because of numerous different variables including types of patients, experience of the readers, number of sections to be evaluated, type of visual rating and statistical approach. In particular, in some studies the correlation coefficient for parametric (Pearson r) or non-parametric (Spearman R) data was used as a measurement of agreement of visual scores (18, 20, 22). However, as extensively discussed by Bland and Altman (31, 33), the use of both is clearly inappropriate. In fact, the correlation coefficients measure the strength of a relation between two variables, not the agreement between them; a perfect agreement is observed only if the data points lie along the line of equality, but a perfect correlation (i.e. unitary) is obtained if the points lie along any straight line (31). In addition the correlation coefficient depends on the range of the variables and ignores any systematic bias between them (33). However, if we apply to our data the measurements of agreement used in prior studies a consistency of the results emerges. In fact the r correlation coefficient in the present data-set ranged between 0.82 and 0.96 for the six operator pairs and between 0.88 and 0.97 for the same operator with a substantial overlap with the values reported in previous studies (18, 20, 22).
Also the kappa values in our data sample (range between 0.16–0.41 for pairs of operators and between 0.39–0.47 for the same operator both considering 10 classes of increasing extent of emphysema) were similar to the corresponding figures in a prior study (23), which used this approach for detailed assessment of pulmonary emphysema.
For the purpose of comparison two of our radiologists performed 3D densitometry twice in our 30 COPD patients using fully automated commercially available software. As expected the results of the four segmentation and density measurements were identical and correlated with the visual assessment (7, 8, 18) especially of the ‘expert’ radiologists. However, the fact that automated segmentation consistently failed to distinguish air contained in the colon from that contained in the lung of one patient confirms one of the limitations of the densitometry as a stand-alone approach. Other relevant limitations of densitometry include dependence from the technical features of data acquisition (scanner, and its calibration, tube current and voltage, collimation, inspiratory volume) and postprocessing (kernel, software) and uncertainties about the optimal methodology (7, 8, 34, 35). As a matter of fact, although it is widely thought that the modern trend is towards quantitative densitometric CT analysis for the evaluation of emphysema (7, 8), all the above difficulties has hindered application of lung densitometry in the routine daily practice, especially for comparison of data of patients examined with different scanners (18).
In our small sample of COPD patients the detailed visual assessment of emphysema extent as rated by all the four operators correlated significantly with DLCO which is one of the PFTs more closely correlated with emphysema severity at histopathological examination (22). Similar correlation coefficients between visual score and DLCO were reported in previous studies (20, 22). Also the strength of the correlation of DLCO with whole lung RA950 overlaps with that previously reported (7).
We recognize two limitations of our study.
First, the operators did not have the opportunity to train their readings on cases in which the radiological–pathological correlation was available (21). However, such a possibility is the exception rather than the rule in the domain of the clinical investigations (5, 18–20, 22–24). Admittedly, also prior training with reference images would have improved reader concordance, especially in the case of non-expert radiologists, but this was not obtained in our study. Finally, lack of reference images during readings which could theoretically have improved the agreement were, in our opinion, compensated by indication to the operators of the position number of the sections to be evaluated.
Second, we did not explore operator variation in visual reading of serial examinations of the same subject but this requires a different study design. However, given the results of the present study, it is unlikely that detailed visual assessment might be sensitive and robust for longitudinal study of progression of emphysema.
In conclusion, our study indicates that detailed visual assessment of pulmonary extent on whole lung CT although appealing because of its simplicity and independence from both technical features of scanning and software resources is characterized by low the inter- and intra-operator agreement which decreases with increasing emphysema extent.