
Abstract
Epidemiological studies have shown an association between the intake of cola beverages and chronic kidney diseases. Experimental evidence for the negative effects of cola intake on kidneys is lacking. Male Wistar rats had ad libitum access to water (control group) or three different sugar-sweetened cola beverages for three months. Despite very high cola intake (daily cca 140 mL), no differences were found in body weight, kidney weight, glomerular morphology, oxidative and carbonyl stress or expression of selected marker genes in the renal cortex. Interestingly, all groups consuming cola beverages had lower blood glucose levels during an oral glucose tolerance test, suggesting improved insulin sensitivity. Despite hyperfiltration (5–6-fold increase in diuresis), cola beverages had no effect on assessed parameters of renal function, histology, gene expression or oxidative stress. Moreover, cola intake seems to increase creatinine clearance and to decrease plasma levels of urea. In our study increased insulin sensitivity and altered renal functional parameters were observed in rats receiving cola beverages for three months. Whether the findings are due to the short duration of the study or interspecies metabolic differences should be uncovered in further studies. Even more interesting might be the analysis of effects of cola intake in animal models of diabetes.
Introduction
Sugar-sweetened beverages are associated with weight gain in epidemiological studies. 1 The increased consumption of cola beverages is especially assumed to be partly responsible for the obesity epidemics. 2 Similar indices point towards a role of cola intake in the pathogenesis of osteoporosis, diabetes and kidney diseases. 3,4 However, surprisingly little experimental data are available to prove these associations.
Epidemiological studies have shown that cola intake is a risk factor (odds ratio [OR] 2.1) for chronic kidney diseases. 5 The induced renal damage has been hypothesized to mediate the negative effects on bone metabolism. 6 Chronic cola consumption might contribute to renal dysfunction via several mechanisms including increased glucose load, phosphate intake and carbonyl stress. Cola beverages are a source of nutritional melanoidins, although not as rich as previously thought. 7 The intake of melanoidins – food-derived advanced glycation end products (AGEs) – contributes to kidney damage. 8 The precise mechanism is not clear, but the receptor-mediated induction of inflammation and/or apoptosis via RAGE (receptor for AGEs) seems to be of major importance.
The cola beverages do not differ considerably regarding their major components – water, glucose–fructose syrup and caffeine. Taste differences are caused by different contents of minor additives. Whether various cola beverages affect health differently is not known.
The aim of our experiment was to evaluate the effects of intake of cola beverages on renal functions, oxidative stress and glucose metabolism in rats.
Materials and methods
Animals
Adult male Wistar rats (n = 40, age 2 months, Velaz, Prague, Czech Republic) were housed in a room with 12/12 light–dark rhythm and controlled environment (air temperature and humidity). During the whole duration of the study the animals had ad libitum access to standard pellet chow (Slovak Academy of Sciences, Dobrá Voda, Slovakia) except for fasting blood sampling. The experiment was approved by the local Ethics committee of the Comenius University.
Experimental design
After one week of acclimatization, the animals were randomized into four groups (10 rats per group) – Control (CTRL), Kofola™ (KF; sugar 80 g/L, caffeine 100 mg/L, energy 1400 kJ/L), Coca cola™ (CC; sugar 110 g/L, caffeine 100 mg/L, energy 1800 kJ/L) and Pepsi cola™ (PC; sugar 115 g/L, caffeine 110 mg/L, energy 1750 kJ/L). The rats had ad libitum access to the respective cola beverage or tap water. The beverages were bought in a local food store. The drinking flasks were cleaned and decarbonated beverages (pH 2.9–3.0 for all decarbonated beverages) were prepared three times a week. Body weight liquid and pellet consumption was monitored weekly. After three months, rats were placed into metabolic cages (Tecniplast, Buguggiate, Italy) for 24 h. Random glycemia were measured before and urine was collected during the stay in the metabolic cages. After overnight fasting, blood samples were taken from the tail. An oral glucose tolerance test was performed with 2 g/kg body weight of glucose (40%) load via gavage. Blood glucose measurements were performed after first and second hour using a standard glucose meter (Precision QID, MediSense, Oxfordshire, UK). The rats were finally sacrificed by exsanguination under total anesthesia (thiopental sodium, 25 mg/kg). Blood was collected from the cannulated aorta into heparin tubes. Plasma was stored frozen in aliquots after centrifugation until analysis. Kidneys were rapidly taken and weighted and parts of renal cortex were frozen in liquid nitrogen for biochemical assays and RNA isolation, and the remaining kidney tissues were fixed in formaldehyde (4%) for histological examination.
Morphometry
Formalin-fixed and paraffin-embedded renal tissues were stained with hematoxylin eosin and periodic acid-Schiff (PAS) for overall histological and morphometric evaluation. A digital microscope (Optika Microscopes, Bergamo, Italy) connected to a PC was used for acquiring images of glomerular tufts. Glomerular tuft area was analyzed in 50 glomeruli per kidney using the UTHSCSA ImageTool 3.0 software (
Biochemical analysis
Creatinine and urea were measured using standard biochemistry (Hitachi Auto Analyzer 911; Hitachi, Tokyo, Japan; and adequate kits from Roche Diagnostics, Basel, Switzerland). Insulin was measured in fasting plasma using a commercially available ELISA kit (DRG Instruments, Marburg, Germany). Insulin resistance index HOMA-IR (homeostatic model assessment of insulin resistance) was calculated according to the formula: fasting insulin (μIU/mL) × fasting plasma glucose (mmol/L)/22.5.
Oxidative stress
Parameters of oxidative stress were measured in 10% homogenates of renal cortex. Fructosamine was determined using nitroblue tetrazolium according to a modified protocol by Chung et al. 9 Total antioxidant capacity (TAC) was measured using 2,2′-azino-bis-3-ethylbenzthiazoline-6-sulfonic acid according to a protocol by Erel. 10 Thiobarbituric acid method was used for the determination of malondialdehyde as described previously. 11 All parameters measured in kidney homogenates were adjusted for the protein content. 12
Realtime polymerase chain reaction
Total RNA was isolated using the TRI-Reagent (MRC, Cincinnati, OH, USA) from the renal cortex. The concentration and quality of isolated RNA was measured using the NanoDrop ND-1000 (Nanodrop Technologies, Wilmington, DE, USA). Fifty nanograms were used as a template for reverse transcription and realtime polymerase chain reaction (PCR) using the QuantiFast SYBR Green RT-PCR Kit (Qiagen, Hilden, Germany). Peptidylprolyl isomerase A was chosen as a housekeeping gene for the calculation of relative gene expression. Specific primers used in this study are summarized in Table 1. Melting curve analysis was used for the assessment of specificity of the PCR products.
Primers used for the realtime polymerase chain reaction
PPIA, peptidylprolyl isomerase A; TGF-beta, transforming growth factor beta; SOD2, superoxide dismutase 2; RAGE, receptor for advanced glycation end products
Statistical analysis
Results were analyzed using analysis of variance with least significant difference post hoc test. Data are presented as mean + SD or mean + SEM (results of the relative gene expression). XLStatistics 5 and Microsoft Excel 2007 were used for the analysis. P values less than 0.05 were considered significant.
Results
There were no significant differences between the groups in body weight (Figure 1a) or in pellet chow consumption (Figure 1b). The rats consumed all cola beverages in high amounts. The volume consumed by the rats per day was up to three times higher than the water intake in the CTRL group (Figure 1c; P < 0.001). This explains the extremely high diuresis reaching 140 mL/d (Figure 1d; P < 0.001). The consumption of cola beverages did not cause an increase in kidney weight (Figure 2a) or any significant differences in plasma creatinine (Figure 2c). On the contrary, plasma levels of urea were lower by cca 50% in all experimental groups when compared with the CTRL group (Figure 2b; P < 0.001). Creatinine clearance was higher by cca 100% in rats drinking cola beverages (Figure 2d; P < 0.05). No morphological changes have been found in the area (Figure 3a) or in the PAS positivity (Figure 3b) of the glomerular tufts. The expression of selected genes (interleukin 6, transforming growth factor beta [TGF-beta], superoxide dismutase 2 [SOD2], RAGE) was not affected by the intervention, although some subtle effects may have been hidden due to high interindividual variability (Figures 3c–f).
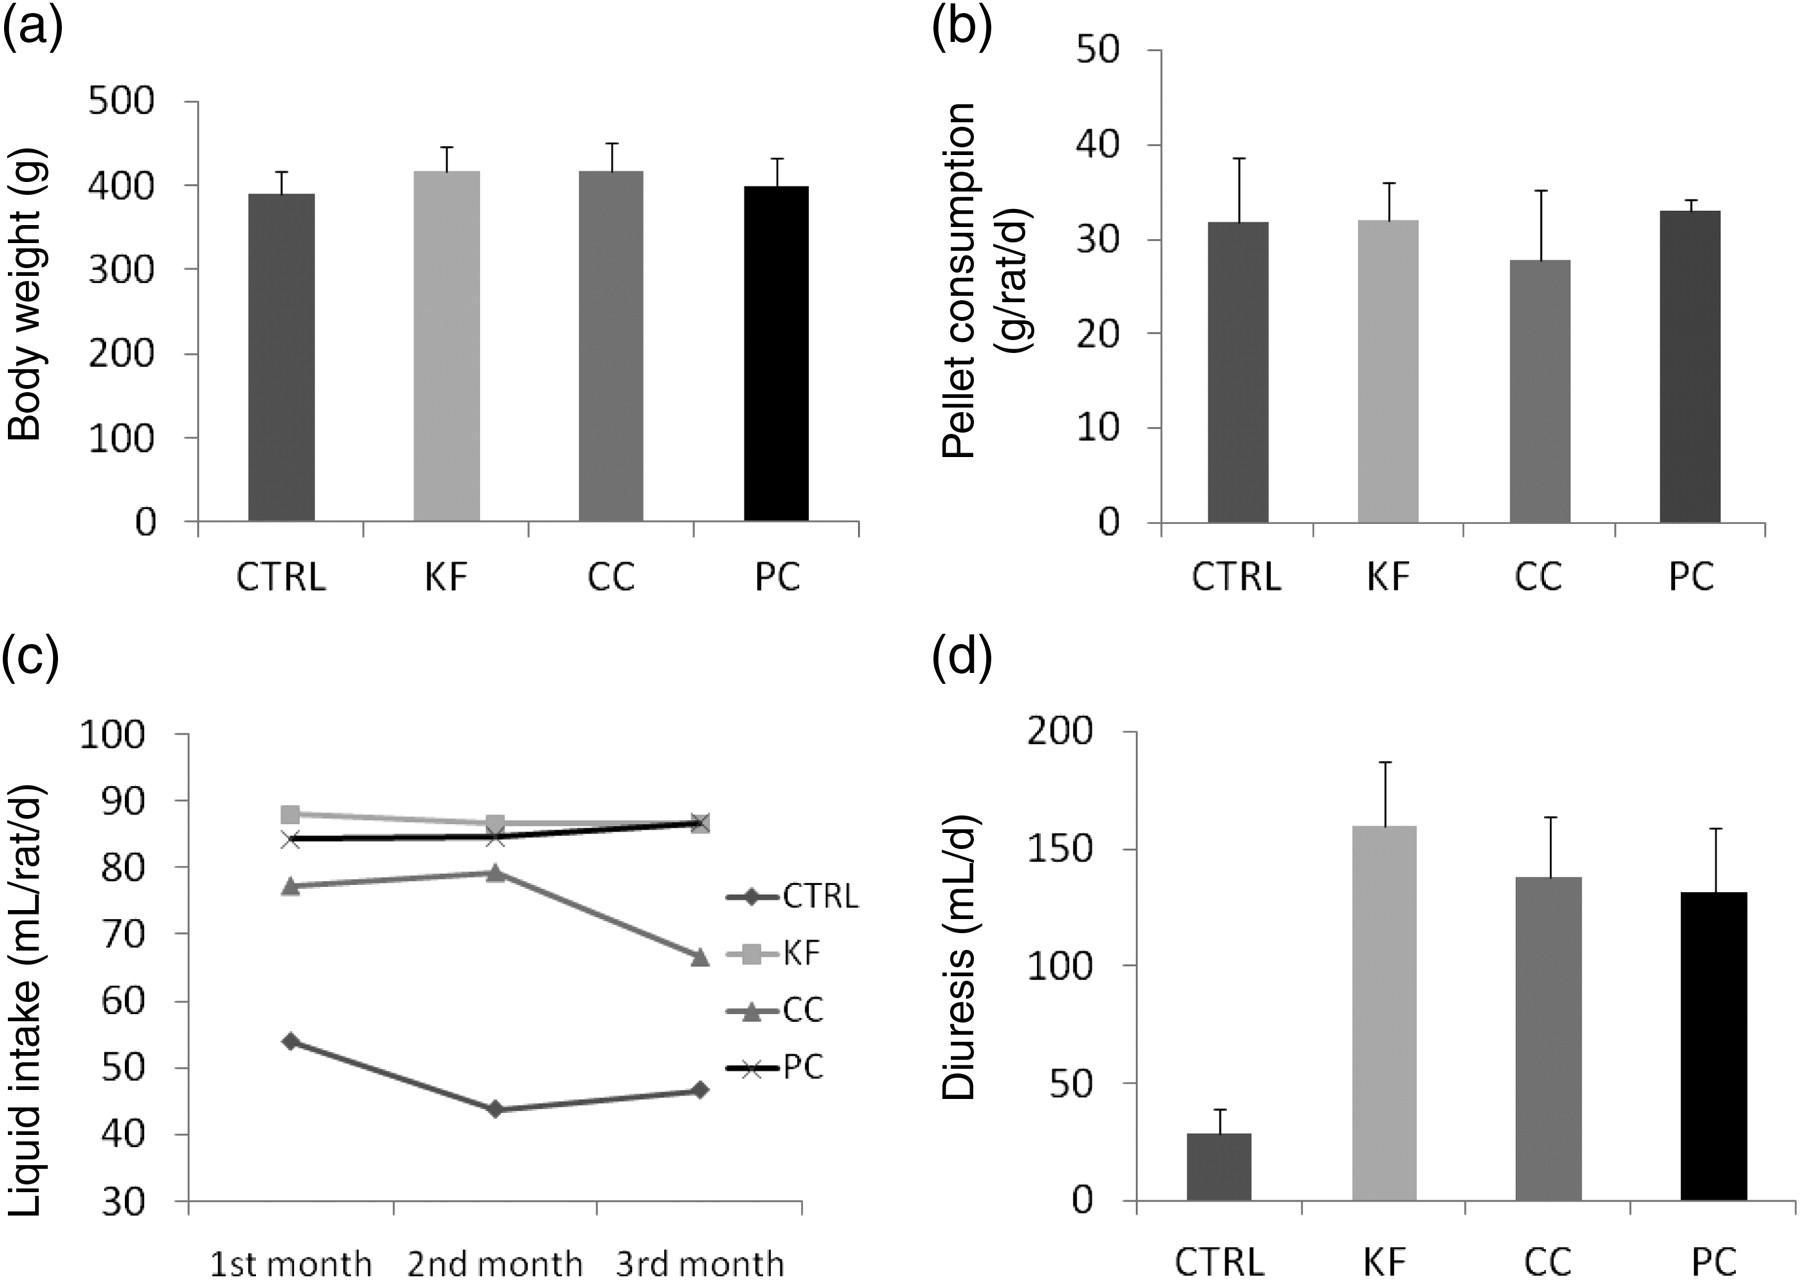
Basic parameters after three months of cola intake: means (c) and means + SD (a,b and d) are shown
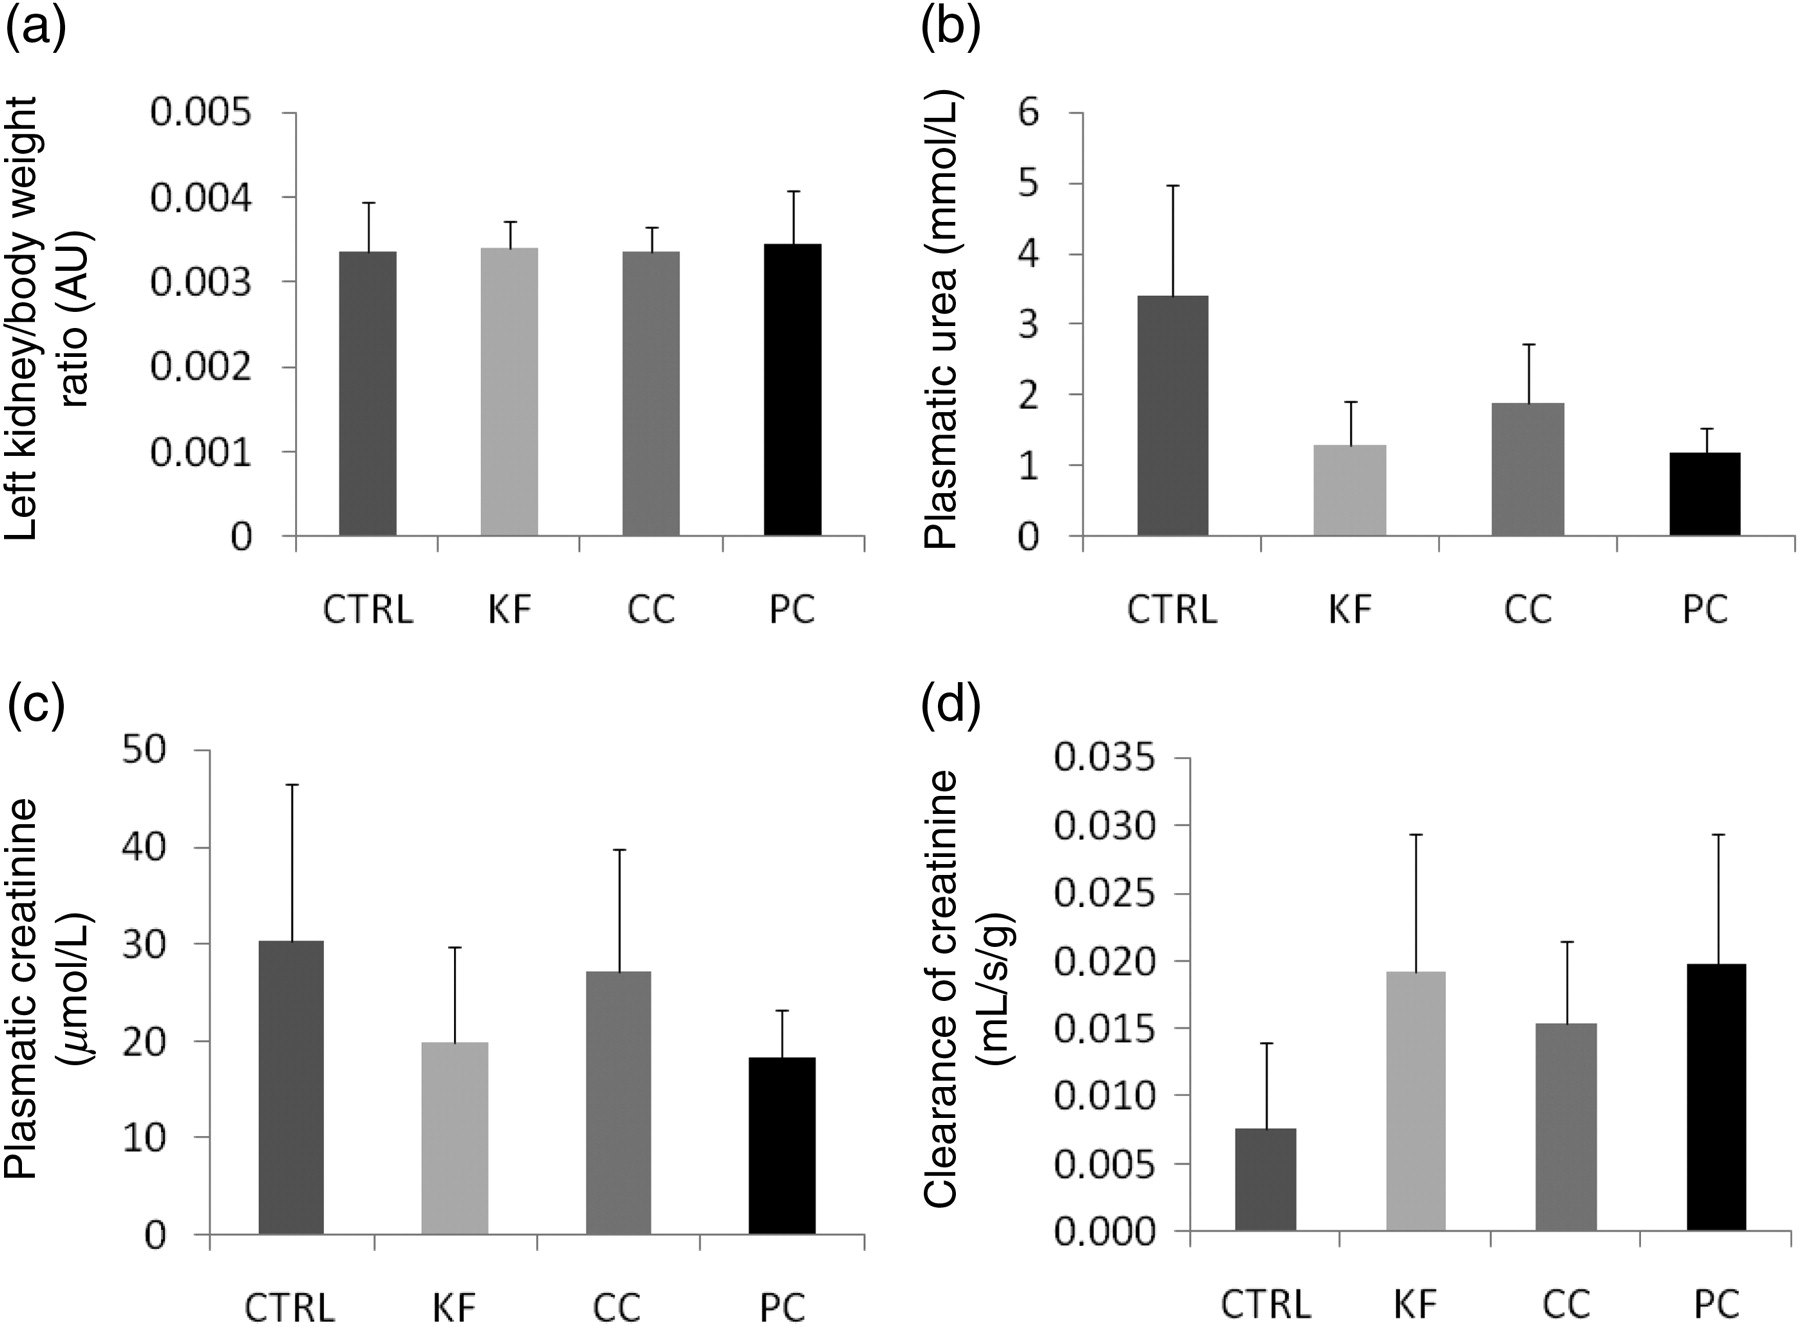
Kidney weight (a) and renal functional parameters (b, c, d; means + SD are shown)
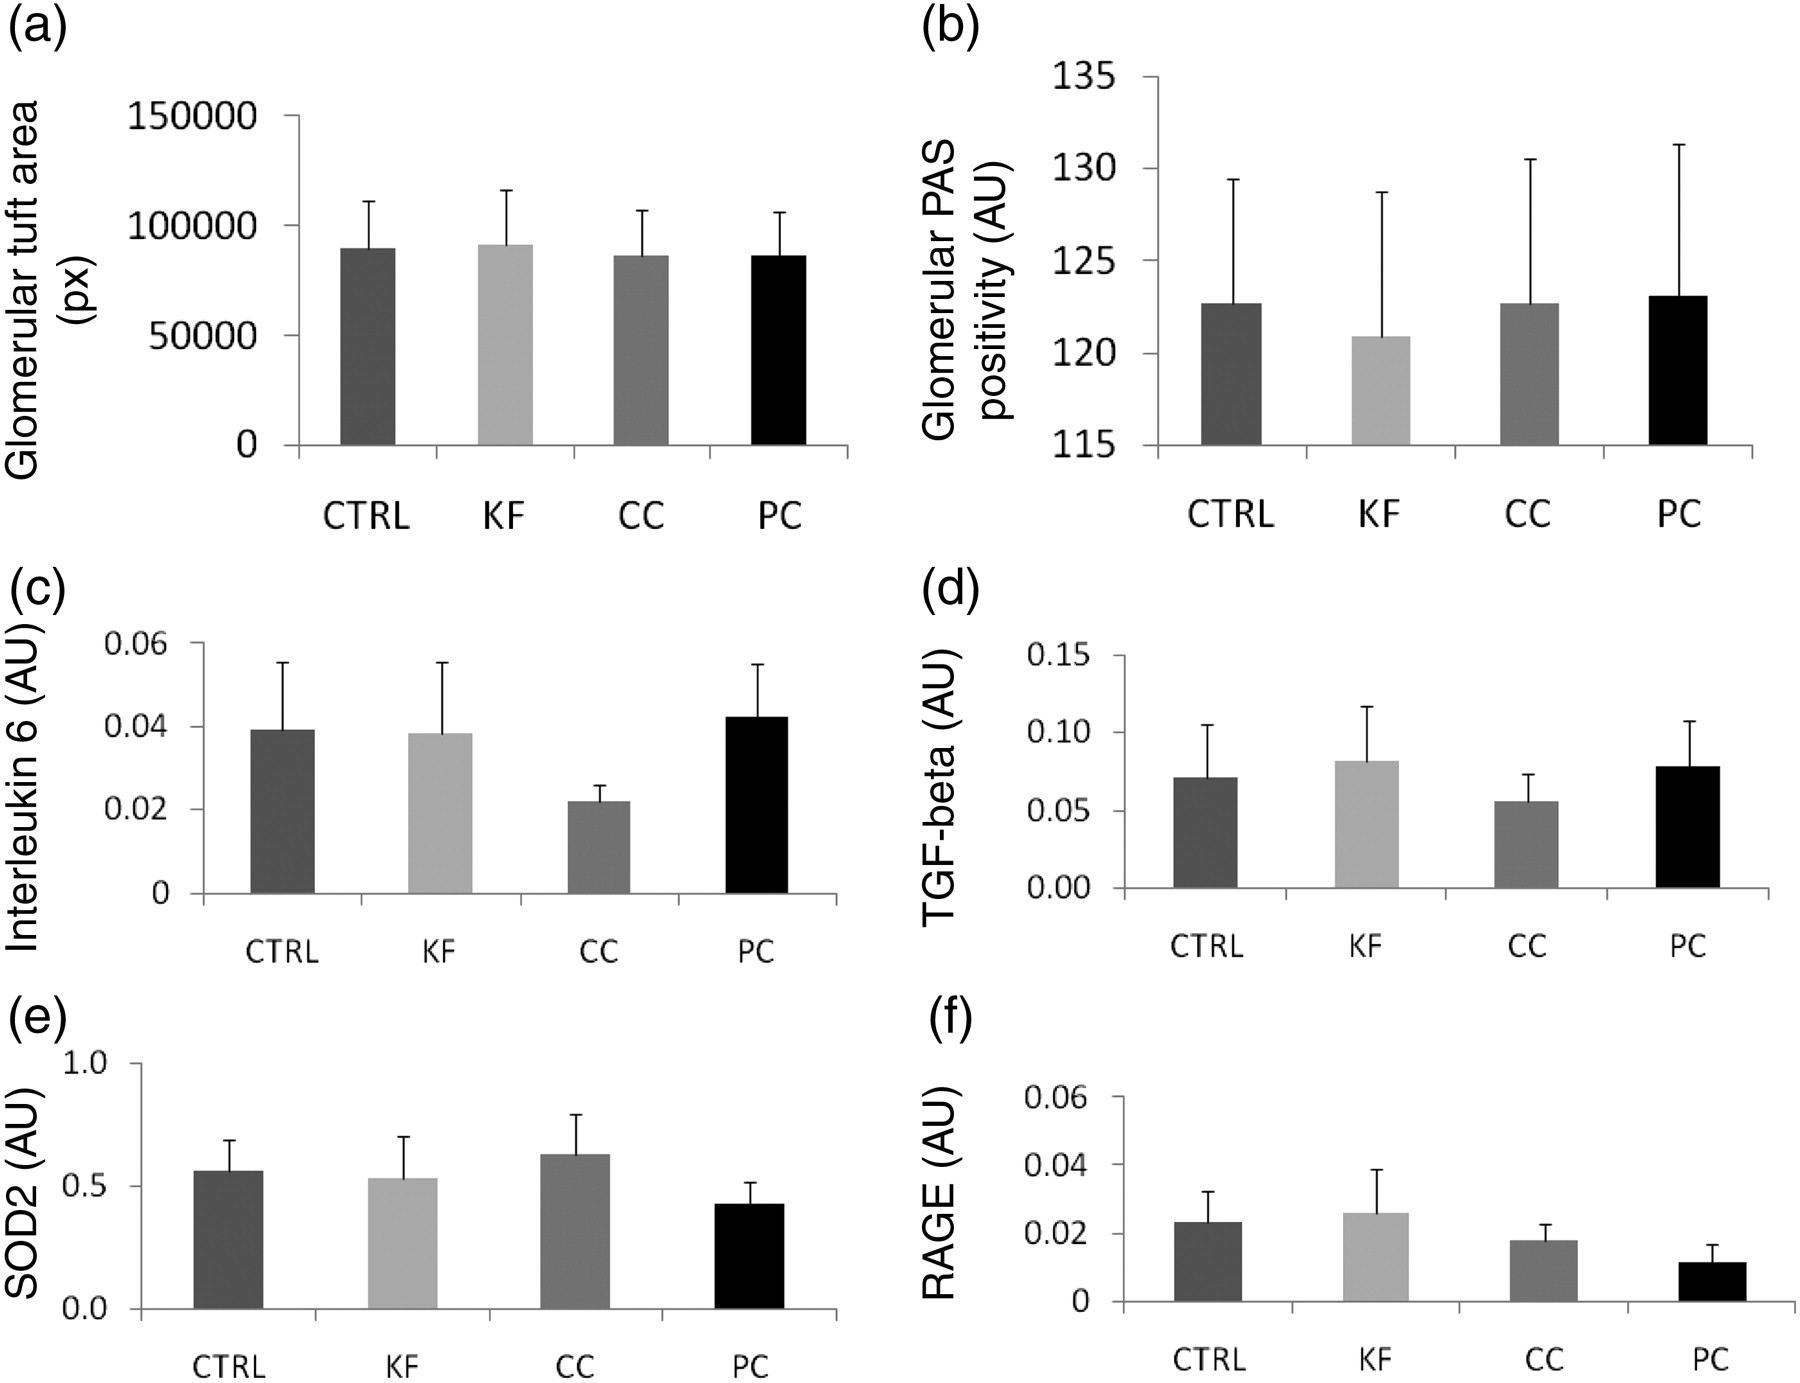
Glomerular morphometry and relative gene expression in the renal cortex: in (a and b) means + SD, and due to high interindividual variability in gene expression, for (c–f) means + SEM are shown. CTRL, control; KF, Kofola; CC, Coca cola; PC, Pepsi cola; TGF-beta, transforming growth factor beta; SOD2, superoxide dismutase 2; RAGE, receptor for advanced glycation end products; PAS, periodic acid-Schiff
Neither random blood glucose levels (Figure 4a) nor insulin sensitivity (Figure 4d) were affected by cola consumption. Fasting insulin concentrations were lower in experimental groups; however, the difference from the CTRL group was not statistically significant (Figure 4c). The HOMA index of insulin resistance was lower only in the PC group (Figure 4d; P < 0.04). Fasting blood glucose levels were lower in all experimental groups in comparison to the CTRL group. They remained so during the whole glucose tolerance test (Figure 4b; P < 0.05).
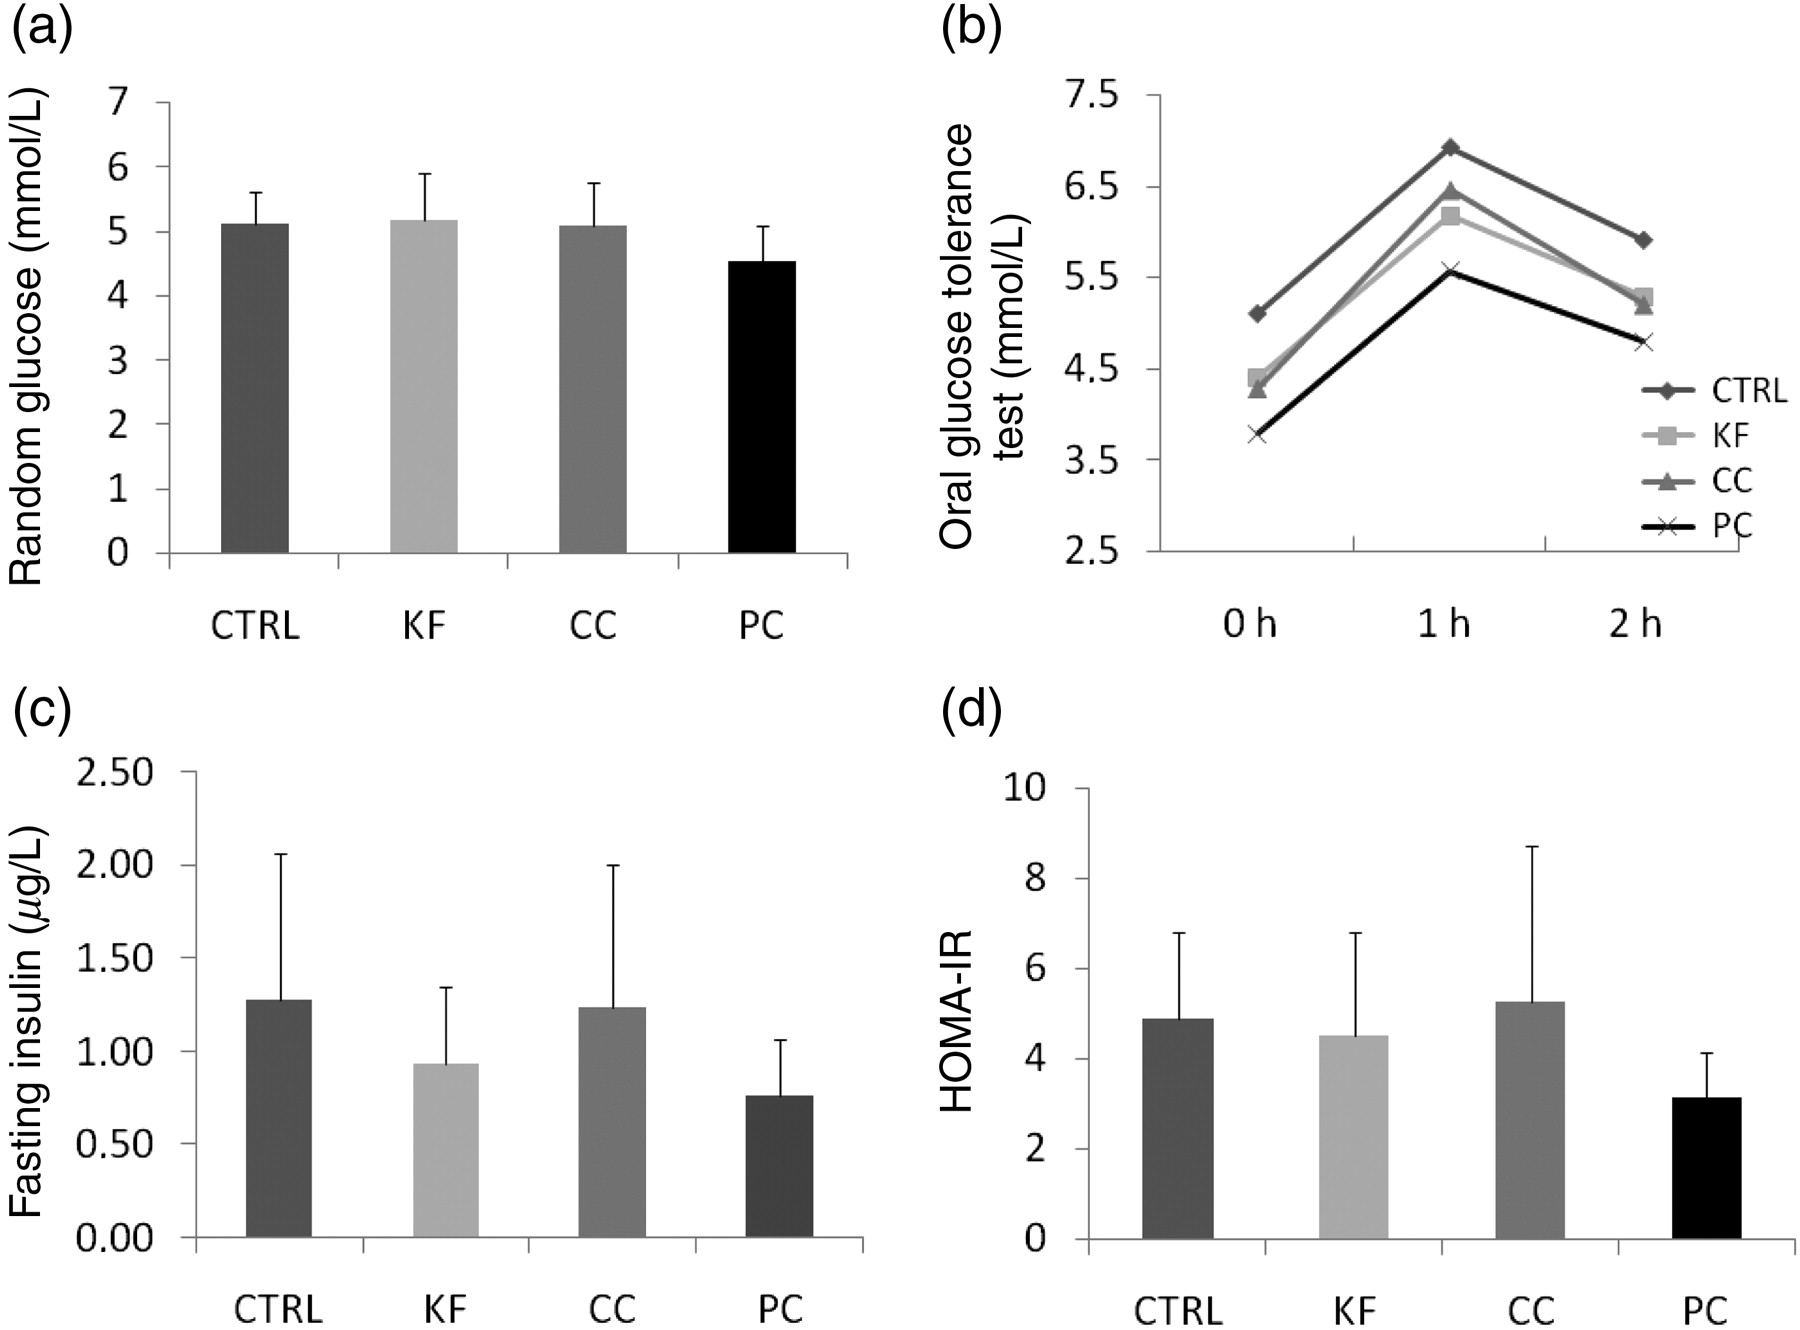
Blood glucose levels and measured/calculated parameters of glucose metabolism: means (b) and means + SD (a,c and d) are shown. CTRL, control; KF, Kofola; CC, Coca cola; PC, Pepsi cola; HOMA-IR, homeostatic model assessment of insulin resistance
Malondialdehyde, fructosamine and TAC in the renal cortex were not altered by cola beverages (Figures 5a–5c). Selected parameters are presented combined for all cola groups in Table 2.
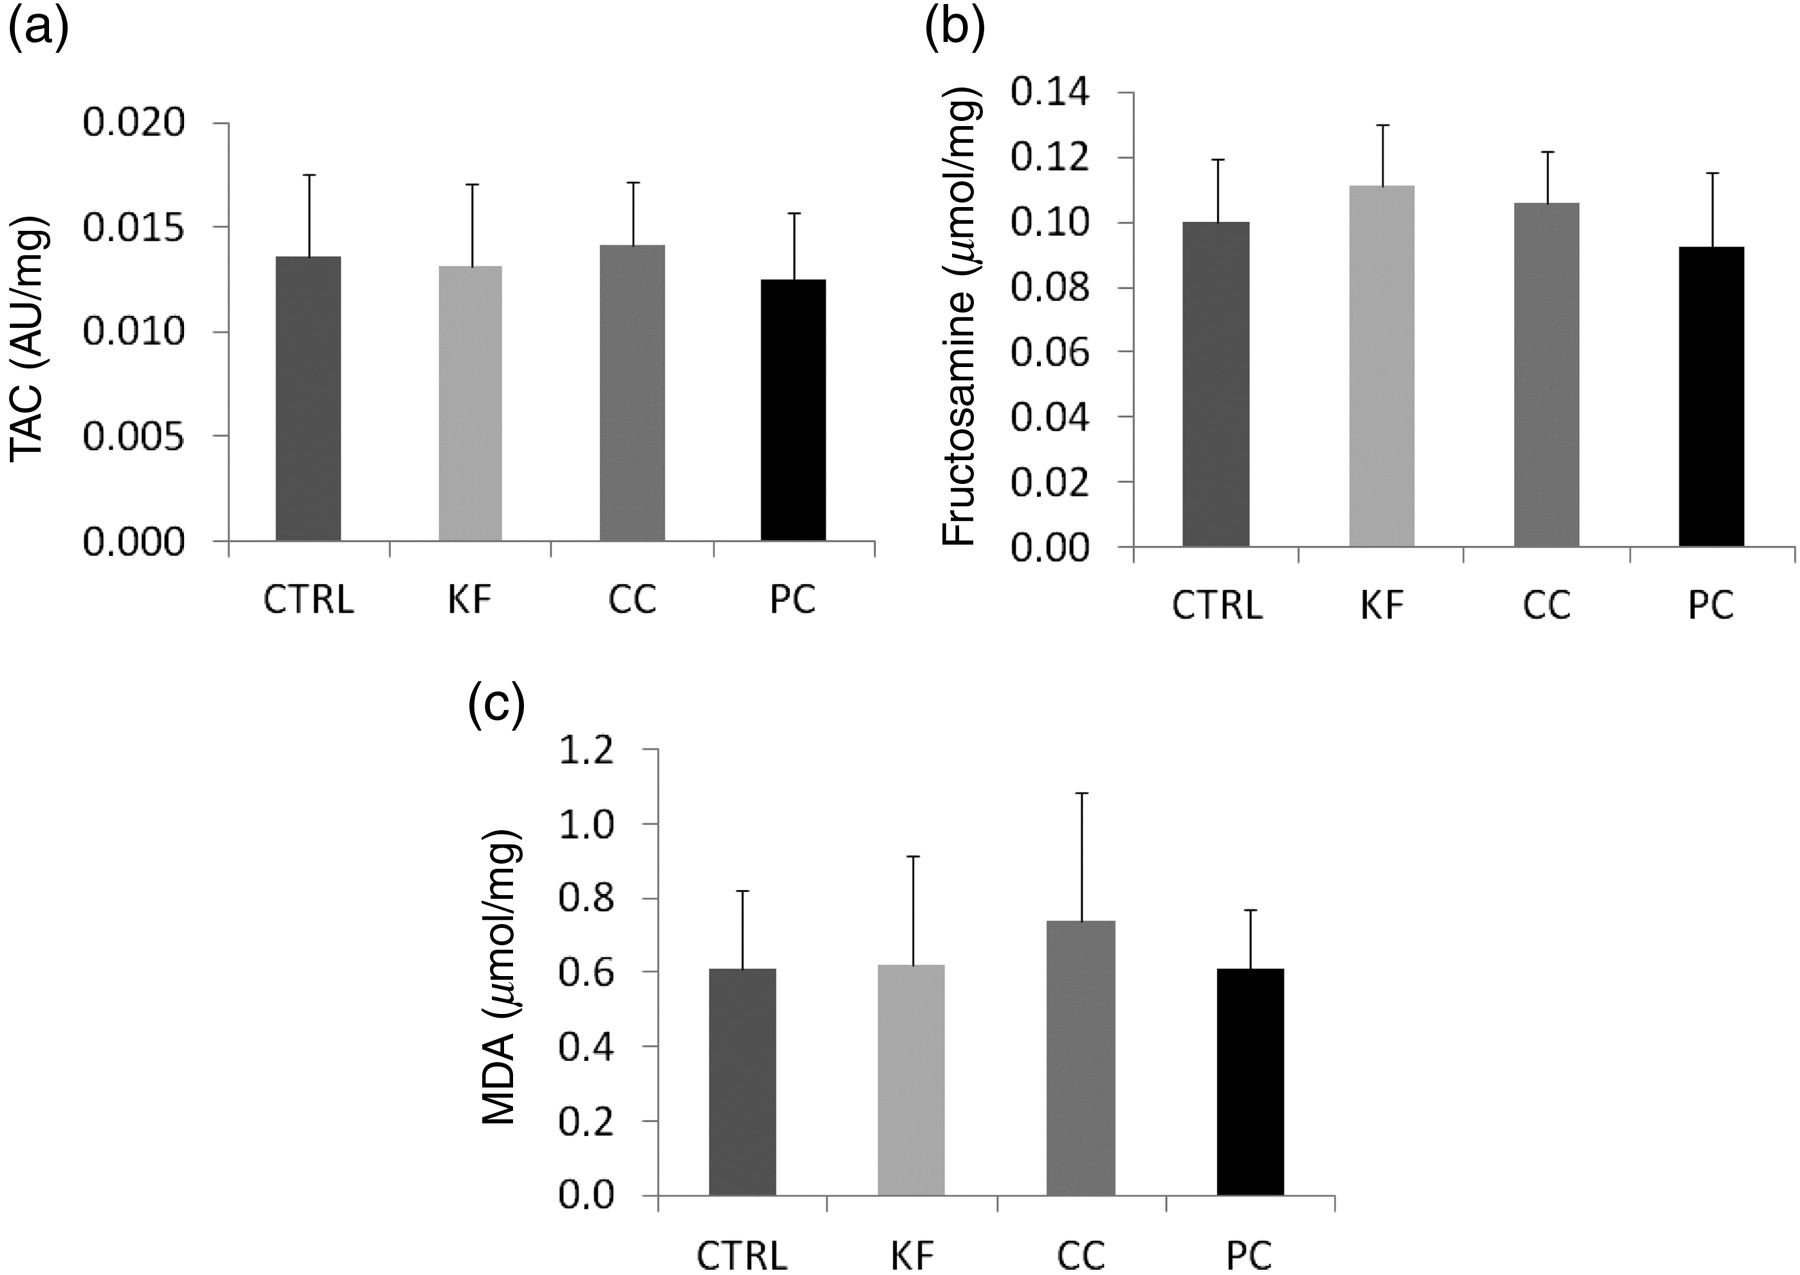
Parameters of oxidative (a and c) and carbonyl stress (b; means + SD are shown). CTRL, control; KF, Kofola; CC, Coca cola; PC, Pepsi cola; TAC, total antioxidant capacity; MDA, Malondialdehyde
Means and CI 95% of selected parameters in experimental groups and a combined cola group (KF, CC and PC together)
NS, non-significant; CTRL, control; KF, Kofola; CC, Coca cola; PC, Pepsi cola
P values reflect comparison between combined cola group and CTRL
Discussion
We show here that ad libitum access of cola resulted in a very high liquid intake (cca 2-fold). Calculated for a 75-kg man this would mean approximately 30 L daily, although such calculations are questionable due to interspecies differences. The intake remained relatively constant throughout the experiment and was similar in all cola beverages. Nevertheless, this high amount of sugar/energy did not cause either an increase in body weight or an increase in random glycemia. The question is, what happens with the excess energy, as a complementary decrease in pellet chow consumption was not observed (although not monitored during the whole study). Choi et al. 13 have shown in a similar but longer study that the body weight of rats even decreased. The authors also suggested a mechanism for the observed findings involving thermogenesis through increased expression of uncoupling proteins in the muscle tissue. Another potential explanation published by the same group might be the increased insulin sensitivity via increased expression of factors participating on the intracellular downstream pathways of the insulin receptor. 14 The HOMA index of insulin resistance was significantly lower only in the PC group, but the blood glucose levels during the oral glucose tolerance test were lower in all experimental groups when compared with the CTRL group, suggesting improved insulin sensitivity.
High cola beverage intake caused increased diuresis, resulting in increased demands on the kidneys during the three months of the study. However, this had no negative impact on renal functions. On the contrary, higher creatinine clearance and lower plasma urea levels were observed. Although the latter finding might be a consequence of lower protein intake, this was not confirmed by the observation of pellet chow consumption, which was similar in all groups. Factors negatively influencing renal functions affect the glomerular morphology and gene expression sooner. Digital morphometry found no differences in glomerular tuft morphology between groups. This is in contrast to findings of a study primarily focused on cola-induced changes in bone mineral density, where the renal morphology was evaluated subjectively and no details about the number of analyzed glomeruli were reported. 6 Thus, their findings of glomerular congestion and intertubular bleeding might be accidental.
Using realtime PCR the expression of marker genes was analyzed. Interleukin 6 is a proinflammatory cytokine, TGF-beta is important in renal fibrosis, mitochondrial SOD2 is the major intracellular antioxidative enzyme and RAGE mediates the proinflammatory action of AGEs as markers of carbonyl stress. The expression of any of these genes might be induced by renal injury or vice versa; however, none of the marker genes was induced in the renal cortex due to cola beverages intake.
In all observed parameters there were no differences between the cola beverages. An epidemiological study on the association between chronic renal failure and cola intake found similar OR for sugar sweetened and artificially sweetened beverages. 5 It seems that other components like the phosphoric acid or caffeine might be important. Yet, in contrast to this epidemiological association, intake of cola caused no negative effects on renal morphology or function in our experiment. There are multiple potential reasons for this discrepancy. Despite three months of very high daily intake of cola, the duration of the study might be too short. Observed hyperfiltration might be predictive of kidney damage after a longer observation period. The rats were adult at the start of this study, while cola intake begins mostly in childhood in humans. Cola beverages used in our study were decarbonated; thus, the effect of CO2 was not studied. In addition, effects of high glucose/fructose intake on the liver cannot be ruled out, as liver function and morphology were not investigated in this study. On the other hand, evidence coming from epidemiological studies is low. Lifestyle and dietary habits in association with increased cola intake is likely to be a major source of bias.
A recently published large epidemiological study with more than 15,000 patients showed similarly to others, that high consumption of sugar-sweetened soda is associated with chronic kidney disease. 15 Based on previous analyses this association seems to be dependent on quantity of consumed beverages. 16 On the contrary, another study focused on patients with pre-existent chronic kidney disease found no association between the consumption of sugar-sweetened beverages and renal functional parameters. 17 Despite these interesting results from large epidemiological studies, direct experimental evidence of renal effects of cola consumption is sparse. In our experiment three months of cola intake changed some parameters of renal functions (increase in creatinine clearance, decrease in plasma levels of urea) without affecting the glomerular morphology, proinflammatory/profibrotic gene expression or renal oxidative and carbonyl stress. Further studies should focus on long-term effects of cola intake and the potential association with altered glucose metabolism.
Footnotes
Acknowledgements
The study was funded by BiomeDox, Inc, Slovakia. This publication is the result of the project implementation: ‘Centre of Excellence for Exploitation of Informational Biomacromolecules in the Disease Prevention and Improvement of Quality of Life’ supported by the Research & Development Operational Programme funded by the ERDF.