
Abstract
Activation of T lymphoma cells expressing Syk, but not ZAP-70 tyrosine kinase, has been shown to negatively regulate cell activation and activation-induced cell death (AICD), perhaps due to differential induction of tyrosine phosphorylation modified proteins. To better understand the role of these proteins and their associated molecules/pathways, we studied a previously described model of T lymphoma cells expressing either a kinase-activated chimeric Syk or ZAP-70 genetically linked to T-cell receptor (TCR) ζ chain (Z/Syk or Z/ZAP cells, respectively). To help identify molecules and pathways linked to cell activation or AICD, a comparative semi-quantitative proteomics-based approach was utilized to analyze tyrosine-phosphorylated protein immunoprecipitates from two-minute short-term activated Z/Syk or Z/ZAP cells. Using the resulting bioinformatics data-sets, we identified several differentially immunoprecipitated proteins that could be validated biochemically. More tyrosine-phosphorylated and phosphotyrosine-associated proteins were found in Z/Syk than in Z/ZAP cells. Proteins involved in different unique functional pathways were induced in these cells and showed altered intermolecular interactions in varied pathways. Remarkably, 41% of differentially identified proteins in Z/Syk cells belonged to cell cycle or vesicle/trafficking pathways. In contrast, 21% of such proteins in Z/ZAP cells belonged to metabolism pathways. Therefore, molecular pathways involved in post-translational modifications linked to distinct cellular/physiological functions are differentially activated, which may contribute to varied activation and AICD responses of these cells. In summary, we identified proteins belonging to novel differentially activated pathways involved in TCR-mediated signaling, which may be targets for regulating activation and AICD of T lymphoma cells and for potential cancer therapy.
Introduction
T-cell lymphoma is an often fatal lymphoproliferative disease that may be caused, in part, by defective T-cell receptor (TCR)-mediated signaling events. 1–3 TCR-mediated signals include activation of protein tyrosine kinases responsible for activation, apoptosis and differentiation of lymphocytes. Syk and ZAP-70 comprise a family of non-receptor protein tyrosine kinases that play critical roles in signaling pathways mediated through hematopoietic cell surface receptors, including TCRs. 4–6 After antigen engagement with TCRs, Syk or ZAP-70 kinases are recruited to associate with the immunoreceptor tyrosine-based activation motifs (ITAMs) of TCRs, become tyrosine-phosphorylated and initiate a cascade of signaling events that control proliferation, differentiation and cell death. 7,8 An altered expression or activation of Syk or ZAP-70 kinases may play a critical role in regulating T-cell lymphoma proliferation and death. For example, recent studies showed that Syk expression is elevated in T-cell lymphoma and Syk inhibitors can induce apoptosis and reduce lymphoma proliferation. 9
We have previously demonstrated that expression of a chimeric molecule with a kinase-active SH2-domain-depleted Syk or ZAP-70, genetically linked to the transmembrane domain of TCR ζ chain, has different effects on activation and activation-induced cell death (AICD) of a mouse T lymphoma cell line. 10 The need for kinase migration to the ITAM regions has been genetically abrogated in these cell lines and has been successfully used to limit the inhibitory hurdles needed for activation. Unlike ZAP-70-expressing (Z/ZAP) cells, TCR ζ chain-linked Syk-expressing T lymphoma (Z/Syk) cells failed to undergo AICD after being stimulated through their TCRs. These results demonstrated that signals mediated through an activated Syk or ZAP-70 kinase might contribute differently to the control of T-cell lymphoma growth. In addition to ZAP-70 and Syk kinases, other TCR downstream molecules may also play an important role in regulating T-cell proliferation, differentiation and death. 11 Additional studies in our laboratory further showed that the Fas/Fas ligand (FasL) cell death pathway was blocked in Z/Syk cells, not Z/ZAP cells. 10 Moreover, activation of caspases 3 and 8, which could lead to cell apoptosis, was also blocked in Z/Syk cells. Therefore, expression of the chimeric Z/Syk kinase, unlike Z/ZAP kinase, suppressed not only activation of tumor cells, but also their Fas/FasL-mediated and caspase-mediated cell death pathways.
Tyrosine phosphorylation is a major post-translational modification involved in many signal transduction pathways. Tyrosine-phosphorylated proteins, as well as their associated proteins play critical roles in regulating proliferation and cell death. Activation of T-cells induces tyrosine phosphorylation of a number of substrates; dysregulation of this process can have vast changes on T-cell behavior and sometimes may cause the cells to become tumorigenic. 12 Consequently, there is an interest in the identification and quantification of tyrosine phosphorylation-associated proteins that may be involved in either Syk or ZAP-70 kinase-mediated signaling pathways. In studies to better understand how Z/Syk and Z/ZAP kinases may differentially regulate T lymphoma cells at the molecular level, we found that a two-minute short-term TCR-mediated stimulation of Z/Syk cells induced more uniquely expressed tyrosine-phosphorylated proteins than did Z/ZAP cells. 10 These results suggest that differentially induced phosphoproteins, or their associated proteins/pathways, may contribute to the differences in response of Z/Syk and Z/ZAP cells to TCR stimulation and specifically AICD.
Proteomic approaches have been very useful in directly studying the expression, function and interaction of proteins expressed in cells or tissues. 13,14 To further elucidate the molecules and molecular pathways that are involved in regulating activation or AICD of T-cell lymphomas, a comparative semi-quantitative mass spectrometry-based proteomics approach was used to identify the tyrosine phosphorylation molecular signatures of activated Z/Syk and Z/ZAP cells. This was done by immuno-capture of phosphorylated protein complexes using an immobilized antiphosphotyrosine support and subsequent analysis of digested eluted components by liquid chromatography–tandem mass spectrometry (LC-MS/MS). Several of the observed protein level differences between activated Z/Syk and Z/ZAP cells were confirmed by Western blot analysis. Additionally, specific phosphorylation sites of differentially detected proteins were identified. These studies have identified novel molecular pathways that are likely related to the observed phenotypic and functional differences between the two cell types and may contribute to the regulation of cell death pathways. The results suggest that the identified unique molecules and pathways may be potential targets for controlling the AICD resistance of T-cell lymphomas.
Materials and methods
Cell lines, antibodies and reagents
T lymphoma cell lines differentially expressing either the kinase-activated chimeric Z/ZAP or Z/Syk tyrosine kinases have been previously described. 10 Briefly, the cDNA encoding a TCR zeta-chain lacking the three cytoplasmic ITAM regions was directly linked in frame to cDNAs encoding a truncated ZAP-70 (amino acid 257–617, Z/ZAP) or Syk (amino acid 260–635, Z/Syk) that contained the kinase region but lacked the two regulatory SH2 domains. These molecules were subcloned into an expression vector containing the CD3ε enhancer and promoter. The stable transfection of this construct resulted in expression of a chimeric TCR zeta-Syk kinase (Z/Syk cells) or TCR zeta-ZAP-70 kinase (Z/ZAP cells), which was part of the TCR complex. For cell activation, cells cultured in RPMI medium were incubated (30 min, on ice) with biotinylated anti-mouse CD3 antibody (10 μg/mL) then activated (2 min, 37oC) using streptavidin (20 μg/mL). Antibodies against Clathrin, SHIP-1, EPS15, HGS, SOS, HCLS1 and PLC-gamma1 were purchased from Santa Cruz Biotechnology (Santa Cruz, CA, USA), anti-VCP from BD PharMingen (San Diego, CA, USA), anti-WRNIP1 from Imgenex (San Diego, CA, USA) and anti-STAM from Abgent (San Diego, CA, USA).
Western blot analyses
Cells were lysed at 4°C in lysis buffer (20 mmol/L Tris, 1 mmol/L ethylenediaminetetraacetic acid, 150 mmol/L NaCl, 5 mmol/L iodoacetamide, 1 mmol/L Na3VO4, 1% Triton X-100, 1 mmol/L phenylmethanesulfonylfluoride and small peptidase inhibitors). After centrifugation, lysed extracts were subjected to a Bradford-based quantitation assay. Equal protein concentrations of cell lysates were loaded onto bis-Tris 4–12% sodium dodecyl sulfate-polyacrylamide gel electrophoresis (SDS-PAGE) and separated proteins were transferred onto a polyvinylidene difluoride membrane (Millipore, Bedford, MA, USA). The membrane was blocked and incubated with primary antibodies followed by horseradish peroxidase-conjugated or infrared secondary antibodies (LI-COR). Target proteins were visualized using chemifluorescence detection (Pierce, Rockford, IL, USA) or analyzed using an infared imaging system (LiCor, Lincoln, NE, USA).
Immunoprecipitation, in-gel digestion and peptide sample preparation
For immunoprecipitation, agarose-bound anti-pTyr PY100 and 4G10 (Upstate Cell Signaling Solutions, Waltham, MA, USA) antibodies were added to 5 mg of total cell lysates at 50 μL resin slurry/mL lysate and 100 μL of resin slurry/mL lysate, respectively. Proteins were eluted from agarose with sample buffer (200 mmol/L Tris HCl, 0.01% Bromophenol Blue, 100 mmol/L Tris Base, 1% SDS and 2.5% w/v glycerol) and heated (5 min, 95°C). Tris-(2-carboxyethyl) phosphine hydrochloride was added to the resulting eluted samples for reduction and samples were heated for an additional five minutes. Iodoacetamide was added to a final concentration of 50 mmol/L and incubated (45 min, in the dark). Eluates were run on a 1 mm bis-Tris 4–12% SDS-PAGE and then stained with GelCode Blue for visualization, densitometry analyses and in-gel digestion.
In-gel digestion of proteins was carried out using mass spectrometry grade Trypsin Gold (Promega, Madison, WI, USA) according to the manufacturer's instructions. Serial segments (5 mm) of individual gel lanes were removed, from top to bottom of the gel, dissected into 1-mm cubes and processed in a 96-well plate. Gel pieces were de-stained (90 min) with a mixture of 55% 100 mmol/L NH4HCO3 and 45% acetonitrile (ACN), dehydrated with 100% ACN, preincubated (15 min) with trypsin (10 ng/μL) in 50 mmol/L NH4HCO3 and incubated (overnight, 37°C) with wash buffer (50 mmol/L NH4HCO3). Tryptic digests were extracted using 0.1% trifluoroacetic acid (TFA) followed by extraction with wash buffer (2 h) prior to mass spectrometry analysis.
Mass spectrometry analyses
LC-MS/MS data were generated using a Thermo LTQ-FT hybrid linear ion trap-ion cyclotron resonance mass spectrometer (Thermoelectron, San Jose, CA, USA), equipped with a nanoelectrospray ion source. Analyses were performed on biological replicates obtained from three independent experiments. Samples were autoloaded onto a trapping column (5 mm length, 300 μm inner diameter) packed with Dionex PepMap C18. The analytical column was a Varian Pursuit C18 (3 μm diameter, 75 μm inner diameter and ∼11 cm in length), with a flow rate of 200 nL/min over a 45-min gradient in buffer: A: H2O + 1% TFA, B: 90% CH3CN + 1% TFA. Full MS spectra were generated in Fourier transform ion cyclotron resonance at a mass resolving power of 100,000 at 400 m/z. From each full MS scan, up to five precursor ions, with an intensity of 104 and an identified charge state greater than 1, were selected for MS/MS analysis in the ion trap. Data-dependent dynamic exclusion was used throughout the data acquisition to help identify lower abundance components. After being analyzed in the ion trap, ions were placed on an exclusion list for 30 s to prevent re-analysis. The total cycle time for the full MS and 5 MS/MS was approximately 1.5 s.
Database searching
Raw unformatted MS/MS spectra were converted into text formatted peak lists using Extract-msn software to compile DTA files. DTA files were limited to precursor charge states determined by the trailer as monoisotopic m/z. All MS/MS samples were analyzed using X! Tandem (version TORNADO (2009.04.01.1)). X! Tandem was set up to search an in-house mouse_fasta.pro database (40,732 entries) assuming trypsin digestion. X! Tandem was searched with a fragment ion mass tolerance of 0.30 Da and a parent ion tolerance of 10.0 ppm. Iodoacetamide derivative of cysteine was specified as a fixed modification. Acetylation of the N-terminus and phosphorylation of serine, tyrosine and threonine, deamidation of asparagine, oxidation of methionine, sulphonation of methionine, were specified in X! Tandem as variable modifications.
Scaffold (version Scaffold_2_05_01, Proteome Software Inc, Portland, OR, USA) was used to validate MS/MS-based peptide and protein identification. Identified peptides were accepted if they exceeded specific database search engine thresholds. X! Tandem identifications required at least -Log(Expect Scores) scores >2.0. Identified proteins were accepted if they contained at least two peptides. Proteins that contained similar peptides and could not be differentiated based on MS/MS analysis alone were grouped to satisfy the principles of parsimony. Please see Supplemental Table 1 for a list of identified proteins. The sequence coverage percentage, spectral counts, unique peptides and the X! Tandem scores are listed for each protein.
Statistics and identification of differentially detected proteins by spectral counting
We utilized a paired experimental design, with measurements of spectral counts taken with three sets of biological replicates. To compute statistical significance of differentially identified proteins eluted from immunoprecipitates, the fold-change was determined by taking the log10 of each protein spectrum ratio (the MS/MS spectra of Z/Syk cells over that of Z/ZAP cells) then averaging among three experiments. We tested the hypothesis that the log10 differences were different than 0. Log of spectrum ratios for each experiment were corrected for sample depth within biological replicates, as protein spectral counts cannot be merely averaged together between experiments. Two-sided paired Student's t-test were performed to the average log values to test the hypothesis that individual mean protein concentrations were different between Z/Syk cells and Z/ZAP cell eluates. The Bonferroni correction was applied to raw P values to adjust for multiple comparisons. Bonferroni P values <1 × 10⁻¹⁴ were reported as ‘P < 1 × 10⁻¹⁴’.
In order to further identify proteins differentially found in either Z/Syk or Z/ZAP cells, we analyzed the spectral counts of the 417 proteins (Supplemental Table 1) detected in these cells by MS/MS using the following parameters: in a given experiment, the log value was taken of the protein ratio determined by the number of MS/MS spectra of peptides assigned to each protein identified in Z/Syk cell eluates divided by the number of MS/MS spectra assigned to the same protein in the Z/ZAP eluates as determined by Scaffold. A paired Student's t-test was performed against the log ratios of our biological replicates as well as to adjust for multiple comparisons; the Bonferroni correction was applied to the calculated raw P values for each protein. Our data suggested that identified values statistically above zero (with an adjusted P < 0.05) were detected in greater abundance in Z/Syk rather than in Z/ZAP cell eluates. Conversely, values that were statistically below zero were considered to be detected in greater abundance in Z/ZAP rather than in Z/Syk cell eluates. Our protein data-sets were functionally categorized based on extensive literature searches in which gene functions, phenotypes, protein–protein complexes and pathological data were deduced.
Ingenuity Pathways Analyses
Mass spectrometry identified protein data were analyzed utilizing Ingenuity Pathways Analysis (IPA) (Ingenuity® Systems,
Protein identifications that contained a probability of identification >95% and a Bonferroni-adjusted P value <0.05 were included in our final data-sets for differentially immunoprecipitated proteins in Z/Syk (113 proteins) or Z/ZAP (23 proteins) cells. Data-sets were uploaded into the Ingenuity software application in which the genes were applied a global molecular network developed from information contained in the Ingenuity Pathways Knowledge Base. Networks of these focus genes were then algorithmically generated based on their connectivity. IPA software limits each network to a total of 35 molecules to reduce the complexity and to determine statistical significance. A score is given to each network, which is a numerical value used to rank networks according to their degree of relevance to the network-specific molecules in the data-set. When performing IPA, the higher the score, the lower the probability of finding that number of molecules in a given network containing up to 35 molecules by random chance. IPA assigns a P value for observing a given number of genes within a network by estimating the cumulative hypergeometric distribution probabilities. IPA then allows one to compare networks based on scores, which are defined as the negative log of each network's P value. Therefore, large IPA scores correspond to P values that are close to zero. In addition to generating signaling networks of our focus genes, the software also computes connectivity to biological functions and diseases. IPA similarly assigns a set of P values to determine the probability that each biological function and/or disease assigned to our data-set is not due to chance alone.
Results
Cell activation and immune affinity capture of tyrosine phosphoprotein complexes
Tyrosine phosphorylation of proteins plays a critical role in regulating growth and death of tumor cells. Our previous studies have demonstrated that expression of Z/Syk, but not Z/ZAP kinase, negatively regulated activation and AICD of T lymphoma cells, perhaps due to induction of different tyrosine-phosphorylated proteins and their associated proteins/pathways in activated cells. 10 We hypothesized that differences in phosphoprotein complexes belonging to distinct functional pathways contribute to the observed differences in TCR-mediated activation and AICD between Z/Syk and Z/ZAP cells. Indeed, initial results obtained from Western blot analyses, probed with the antiphosphotyrosine antibody 4G10, showed that a two-minute TCR-mediated stimulation of Z/Syk and Z/ZAP cells induced a different pattern of tyrosine-phosphorylated proteins in these cells (Figure 1a). Z/Syk cells yielded both a greater variety and amount of tyrosine-phosphorylated proteins after TCR-mediated activation. To further define the differences, we used immobilized antiphosphotyrosine antibodies to immuno-capture tyrosine-phosphorylated protein complexes from lysates of activated cells. Analogous to total cell lysate Western blots, Z/Syk cells yielded a greater variety and amount of proteins eluted from the antibody column compared with Z/ZAP cells (Figure 1b). These results indicated that TCR-mediated activation of Z/Syk and Z/ZAP cells resulted in a differential expression of tyrosine-phosphorylated proteins and their associated proteins.
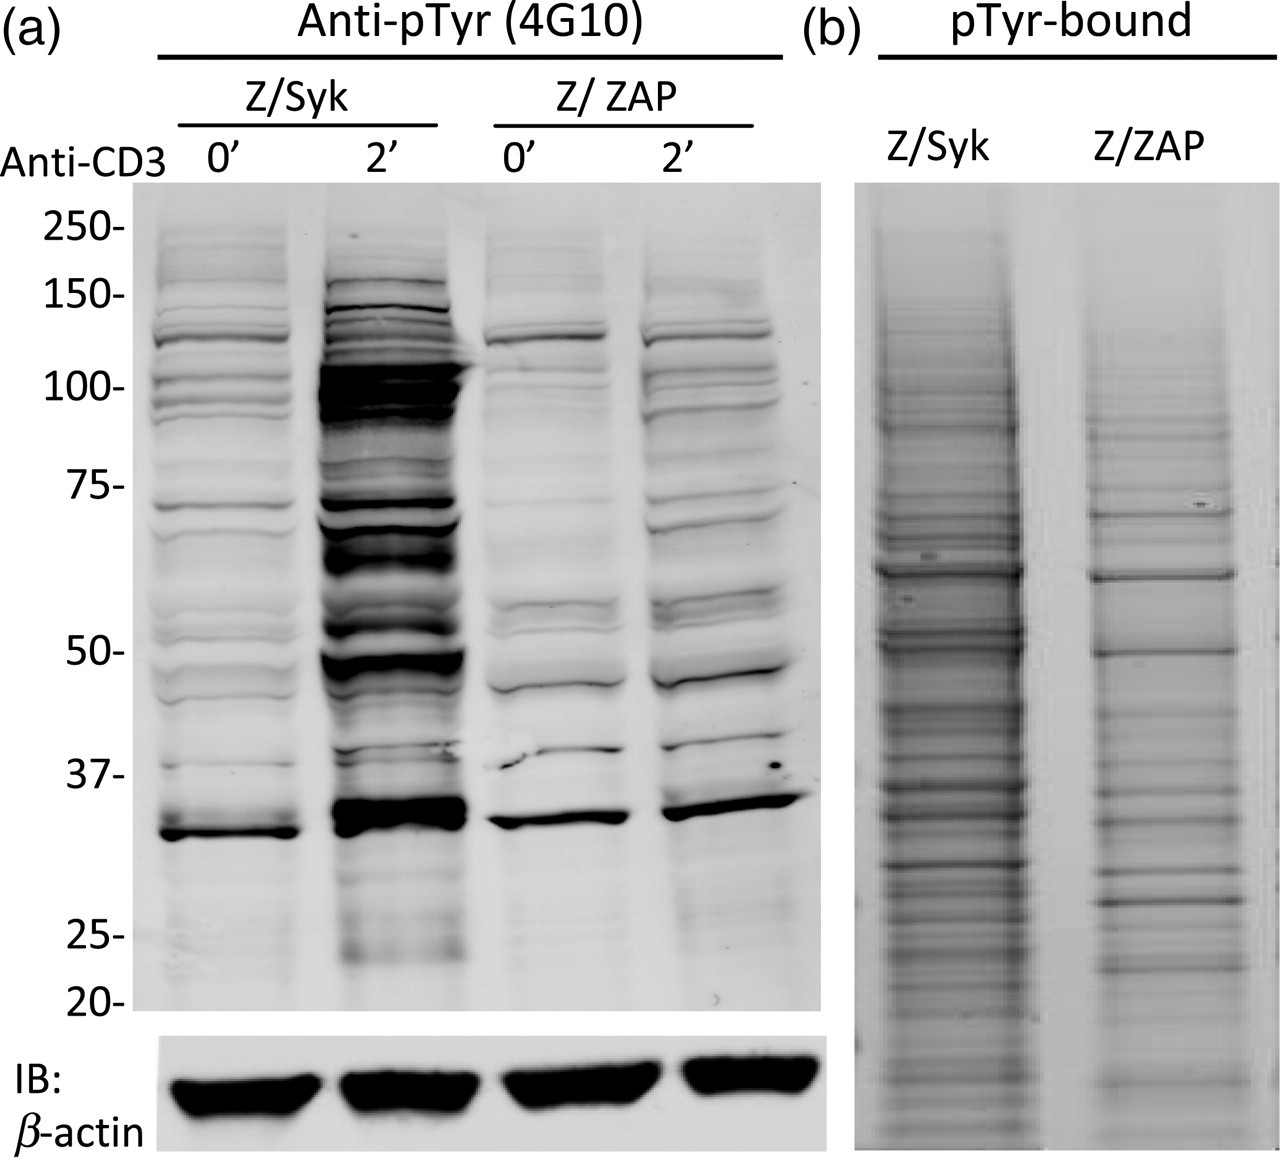
Activated Z/Syk and Z/ZAP cells display different profiles of tyrosine-phosphorylated proteins upon activation. (a) Z/Syk and Z/ZAP cells were incubated with biotinylated anti-CD3 then activated for two minutes by cross-linking anti-CD3 with streptavidin. Total cell lysates were analyzed for tyrosine-phosphorylated proteins using Western blots probed with the anti-phosphotyrosine antibody 4G10. (b) Detection of immunoprecipitated tyrosine-phosphorylated proteins and their associated proteins. Total cell lysates from anti-CD3-activated Z/Syk and Z/ZAP cells were immunoprecipitated using agarose-conjugated antiphosphotyrosine 4G10 and PY100 antibodies. Eluates from the immunoprecipitated protein complexes were analyzed using sodium dodecyl sulfate-polyacrylamide gel electrophoresis followed by Coomassie blue staining. For gels used in proteomics studies, 14 equal-sized gel slices were segmented in 5-mm increments for mass spectrometry analyses
Protein identification and quantification by LC-MS/MS
The field of quantitative proteomics has evolved quickly, with several novel reliable methods of detecting relative protein expression currently available. 15–18 We used a label-free comparative semi-quantitative proteomics approach to test our hypothesis and to better understand the functional profile of tyrosine-phosphorylated proteins and their associated proteins differentially induced in activated Z/Syk versus Z/ZAP cells. To determine the relative abundance of proteins in Z/Syk versus Z/ZAP cell eluates, a non-labeling quantitation method involving spectral counting was used to further define the differences between the two profiles of tyrosine-phosphorylated protein complexes found in the two different cell eluates (see Materials and methods). This method has been validated to have a direct connection with protein abundance. 19,20 The protocols for immuno-capture and SDS-PAGE separation of tyrosine-phosphorylated protein complexes for each cell type were repeated, as described in Figure 2. Each lane of the Coomassie-stained gel was cut into sequential equal-sized segments and subjected to in-gel trypsin digestion. The trypsin-digested peptide mixtures were extracted from the gel and then analyzed by LC-MS/MS, and the proteins were identified by an X! Tandem database search of a mouse-specific protein database. Analysis of the data was performed on samples from three independent immuno-capture experiments for each cell type. After strict parameters were used to filter out low-scoring identifications, 417 different proteins with a probability of identification greater than 95% were identified in at least two out of three biological replicates for Z/Syk or Z/ZAP cells and were identified as having a minimum of two peptides (Supplemental Table 1).
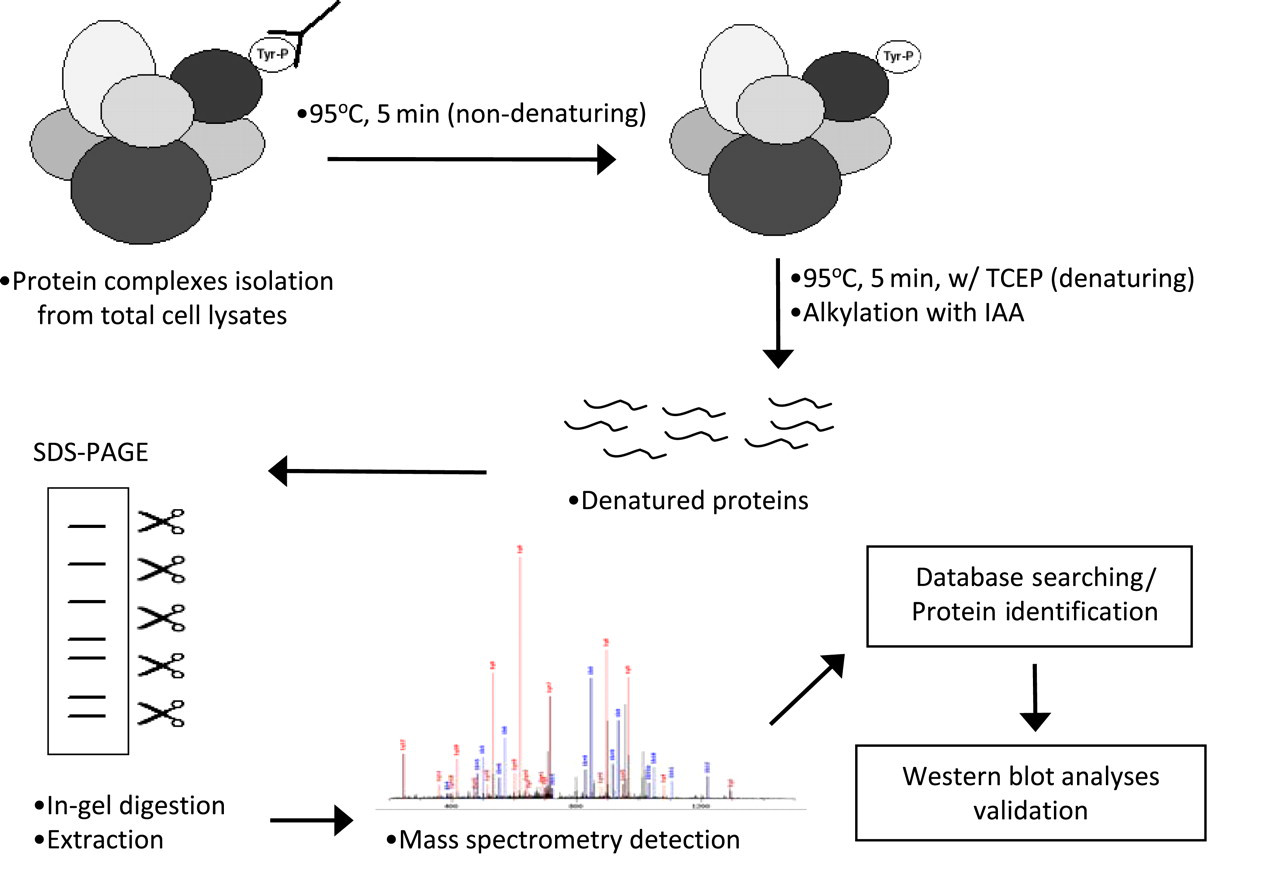
Schematic diagram for the proteomics experimental procedures. Total cell lysates from anti-CD3-activated cells were subjected to immunoaffinity isolation of phosphotyrosine containing complexes (see Experimental procedures). MS/MS spectra were matched to our in-house mouse-specific fasta database using X! Tandem for database searching to obtain protein identifications. SDS-PAGE, sodium dodecyl sulfate-polyacrylamide gel electrophoresis (A color version of this figure is available in the online journal)
We then performed further analyses of the spectral count data to identify proteins differentially found in either Z/Syk or Z/ZAP cells (see Materials and methods). Of the 417 proteins, 113 were identified as being more abundant in Z/Syk cell eluates (Table 1). By comparison, only 23 such proteins were identified in Z/ZAP cell eluates (Table 2). As expected from previous results (Figures 1a and b), more tyrosine-phosphorylated proteins and their associated proteins were positively identified from Z/Syk than Z/ZAP cells. These proteins are likely downstream of Syk and ZAP-70 kinases in each cell type due to the nature of our chimeric gene expression to the TCR ζ chain, and may directly or indirectly be involved in the differential response of those cells to activation and AICD.
List of mass spectrometry identified proteins found to be more abundant in Z/Syk cell eluates after phosphotyrosine immunoprecipitation*
*The protein list was compiled from Scaffold search results. P values shown have been adjusted to include the applied Bonferroni correction for multiple comparisons. P values were obtained by taking log ratios of spectral counts for each protein from Z/Syk cell and Z/ZAP cell eluates and averaged among three biological replicates (see Materials and methods). Only those proteins found to be more abundant in Z/Syk eluates with an adjusted P value <0.05 are listed
†Proteins validated biochemically through Western blotting
List of mass spectrometry identified proteins found to be more abundant in Z/ZAP cell eluates after phosphotyrosine immunoprecipitation*
*The protein list was compiled from Scaffold search results. P values shown have been adjusted to include the applied Bonferroni correction for multiple comparisons. P values were obtained by taking log ratios of spectral counts for each protein from Z/Syk cell and Z/ZAP cell eluates and averaged among three biological replicates (see Materials and methods). Only those proteins found to be more abundant in Z/ZAP eluates with an adjusted P value <0.05 are listed
Proteins involved in different functional pathways were immunoprecipitated in activated Z/Syk cells versus Z/ZAP cells
In order to better understand the nature and potential function of differentially identified proteins in either Z/Syk or Z/ZAP cells, a functional categorization analysis was performed of the identified proteins (Tables 1 and 2). The previously reported functions of these proteins were categorized using information compiled from extensive literature searches, Gene Ontology terms and the Protein Knowledgebase (UniProt KB), which provided useful information to identify potential interactions among different proteins. The proteins were then linked to pathways involved in various important cellular activities and physiological functions. These analyses allowed us to evaluate relative roles of the identified proteins in the differential activation and AICD of Z/Syk versus Z/ZAP cells.
Proteins differentially identified in Z/Syk or Z/ZAP cells fell into six functional categories, broadly labeled as adaptor, cell cycle, metabolism, signal transduction, transcription/translation and vesicle/trafficking, which includes vesicle transport of protein cargo and trafficking inside cells (Figure 3, and Tables 1 and 2). Some proteins belonged to more than one category because they were defined in the literature as having more than one primary function. Three proteins in Z/Syk cells had unidentified functions and were labeled with a function ‘unknown’. The analyses further showed that proteins identified in Z/Syk or Z/ZAP cell had approximately the same percentage of proteins represented in the functional categories of signal transduction, adaptor and transcription/translation. However, Z/Syk and Z/ZAP cells showed major differences in the percentage of differentially identified proteins belonging to metabolism, cell cycle and vesicle/trafficking functional categories. In addition to having more tyrosine-phosphorylated proteins, Z/Syk cells contained many proteins associated with cell cycle (20 proteins or 18% of 113 differentially identified proteins) and vesicle/trafficking (35 proteins or 25% of 113 proteins) functional categories (Figure 3). Remarkably, none of the proteins differentially identified in Z/ZAP cells belonged to these two functional categories. In contrast, while 22% of the proteins differentially identified in Z/ZAP cell eluates (5 of 23 proteins) belonged to the metabolism category, only 3% (3 of 113 proteins) belonged to this category in Z/Syk cell eluates.
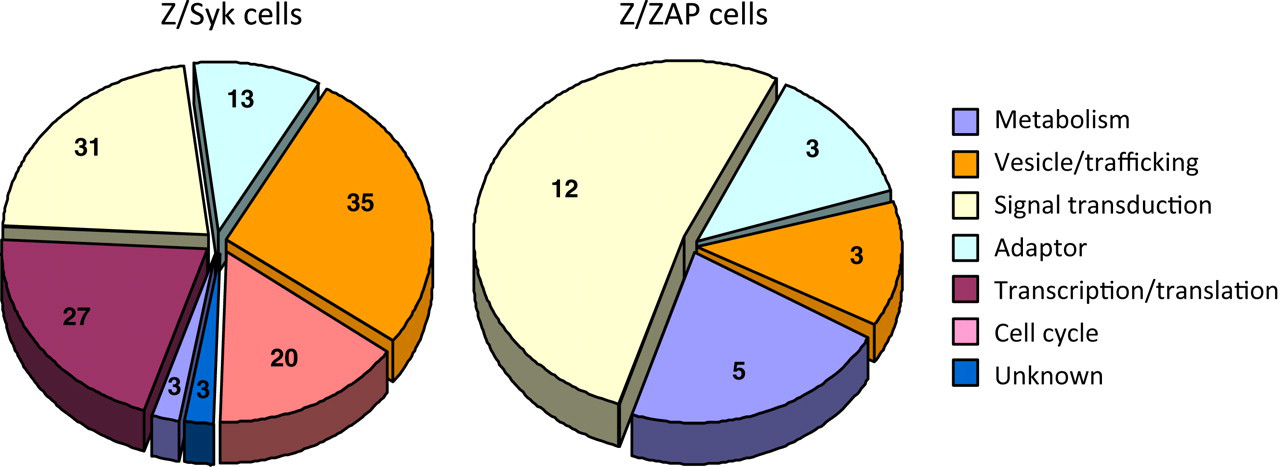
Graphic representation of literature-based functional categorization of differentially identified proteins. Proteins differentially identified from Z/Syk (left) and Z/ZAP (right) cell eluates were analyzed through extensive literature-based searches. Proteins were functionally categorized into six major categories based on their broadly defined and reported biological functions in the literature. Some proteins belonged to more than one category as they were defined in the literature as having more than one primary function. Number shown in pie chart slices represent the number of proteins belonging to that functional category (A color version of this figure is available in the online journal)
Cell activation induced several proteins belonging to functional categories uniquely identified in either Z/Syk or Z/ZAP cells. These results suggested differential modification/activation of proteins belonging to distinct functional pathways may contribute to the differences in responses of Z/Syk or Z/ZAP cells to activation. The lack of Z/ZAP cell proteins found in cell cycle or vesicle/trafficking functional categories suggested that proteins in these two pathways may play an important role in the resistance of Z/Syk cells to TCR-stimulated activation and AICD. Alternatively, it may underlie the observed high sensitivity of Z/ZAP cells to activation and AICD.
Identified proteins showed altered intermolecular interactions in varied functional pathways in Z/Syk and Z/ZAP cells
To further evaluate the functional significance of differentially identified proteins (Tables 1 and 2) and their potential interaction with other proteins, intermolecular interaction network analyses were performed using IPA software. IPA utilizes experimental information on genes, protein networks, disease processes, and signaling and metabolic pathways in performing its network analyses. Each identified network was scored by IPA based on the probability of proteins being identified in the network. Moreover, this approach provided additional functionally and biologically relevant network analyses by highlighting only direct association of protein components in different functional pathways.
Using these analyses, the 113 proteins differentially identified in Z/Syk cells were grouped into five different functional networks broadly defined by IPA (Supplemental Table 2). The top-scoring network was labeled ‘cellular assembly and organization, cellular function and maintenance, cellular movement’. To limit the size and complexity of each network analysis, IPA only shows 35 of the most highly interactive proteins that may exclude more upstream or downstream proteins. In the ‘cellular assembly and organization, cellular function and maintenance, cellular movement’ network, 30 (shaded in light green) of the 35 protein components were identified in Z/Syk cell eluates (Figure 4a, score = 55; see Experimental procedures for score definition). Unexpectedly, proteins associated with functions regulating cellular vesicle transport, multivesicular body trafficking, proteosomal degradation and/or recycling of ubiquitinated protein cargo, thus belonging to the functional category ‘vesicle/trafficking’ pathway, dominated this network. The increase of such trafficking proteins can directly affect TCR-mediated signals by sustaining or depleting signals at an altered rate. Tightly controlled regulation of receptor activation and internalization are key mediators of signal strength and may have potential effects on the transformation of T-cells. In comparison, differentially identified Z/ZAP cell proteins belonged to only two functional networks (Supplemental Table 3). The top-scoring network was labeled as ‘amino acid metabolism, post-translational modification, small molecule biochemistry’ (Figure 4b, score = 29). Among the 35 protein components in this network, 15 (shaded in light green) were proteins differentially identified in Z/ZAP cell eluates. Therefore, proteins belonging to these varied pathways may regulate the distinct response of Z/Syk or Z/ZAP cell to activation.
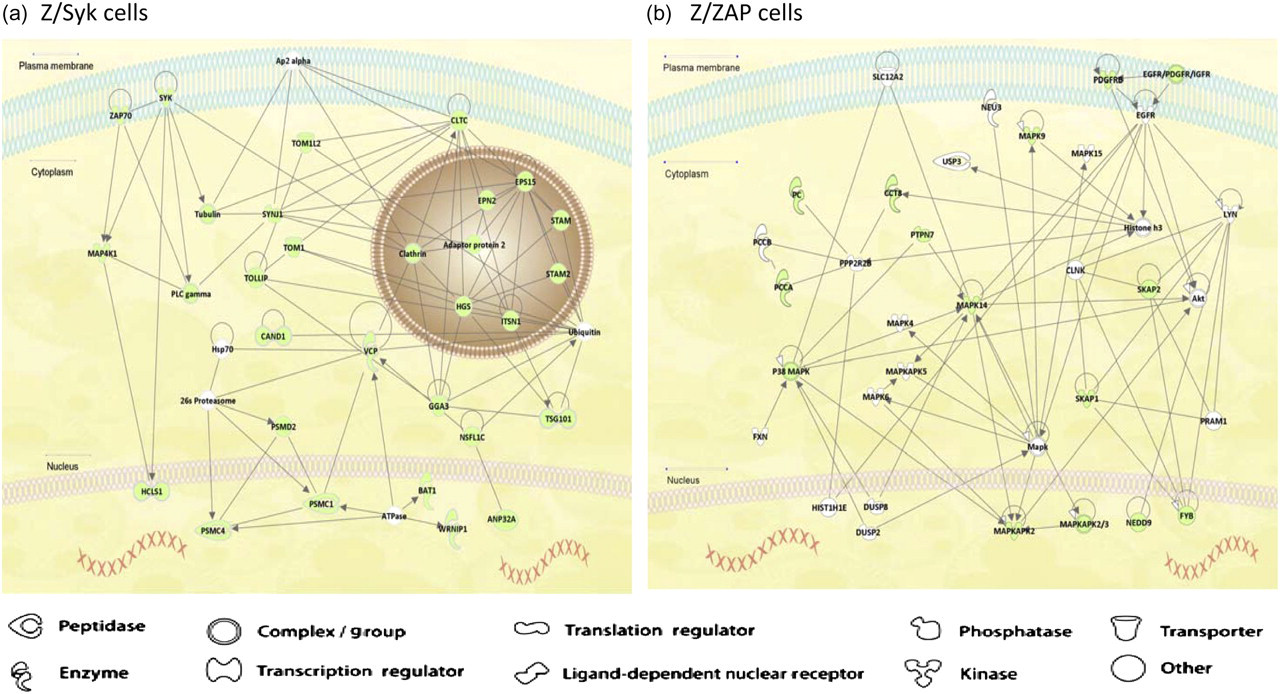
Ingenuity pathway analyses of intermolecular interaction among proteins differentially identified in either Z/Syk or Z/ZAP cells with other proteins. Graphical representation of the hypothetical networks generated by IPA based on the molecular relationships, interactions and pathway associations among the identified proteins. (a) The top-scoring direct intermolecular interaction network labeled as ‘cellular assembly and organization, cellular function and maintenance, cellular movement’ for Z/Syk cells is shown. Compared with other lower scored networks, this network involved the greatest number of proteins differentially identified in Z/Syk cell eluates. Thirty (shaded in light green) of the 35 protein components were differentially identified in Z/Syk cell eluates by MS/MS analyses. (b) The top-scoring network labeled as ‘amino acid metabolism, post-translational modification, small molecule biochemistry’ for Z/ZAP cells is shown. Fifteen (shaded in light green) of the 35 protein components were proteins differentially identified in Z/ZAP cell eluates. Compared with lower scored networks, this network involved the greatest number of proteins differentially identified in Z/ZAP cell eluates (A color version of this figure is available in the online journal)
In addition to the above analyses, IPA can also make educated predictions that distinguish biological functions into two categories: diseases/disorders and molecular/cellular functions. Several groups of proteins involved in various types of diseases/disorders were identified. Of particular interest, many of the proteins identified in Z/Syk cells (48 out of 113 proteins) and Z/ZAP cells (15 out of 23 proteins) were involved in cancers. These results suggested that perturbation/alteration of the function of these cancer-related proteins may regulate activation and AICD of T lymphoma cells and, consequently, the development of tumors.
Biochemical validation of identified proteins
Our analyses described above suggested that many proteins identified in Z/Syk cell eluates belonged to the major functional pathway ‘vesicle/trafficking’. We examined whether the differences could be further validated biochemically. Of the proteins identified, 10 were chosen for validation using Western blot assays based on their significant spectral count differences and their involvement in the vesicle/trafficking pathway (Table 1 and Figure 3). The results showed that overall protein expression was not altered before or after activation through TCRs, as comparable amounts were detected in the flow-through fractions from immunoprecipitation (Figure 5). This would be expected from a two-minute short-term cell activation, which does not allow enough time for new protein synthesis. In comparison, different protein amounts were detected in eluates from the anti-phosphotyrosine 4G10 antibody immunoprecipitation (Figure 5). Western blot analyses results indicated that the tested proteins were either differentially tyrosine-phosphorylated or associated with tyrosine-phosphorylated proteins in activated Z/Syk cells, but not Z/ZAP cells.
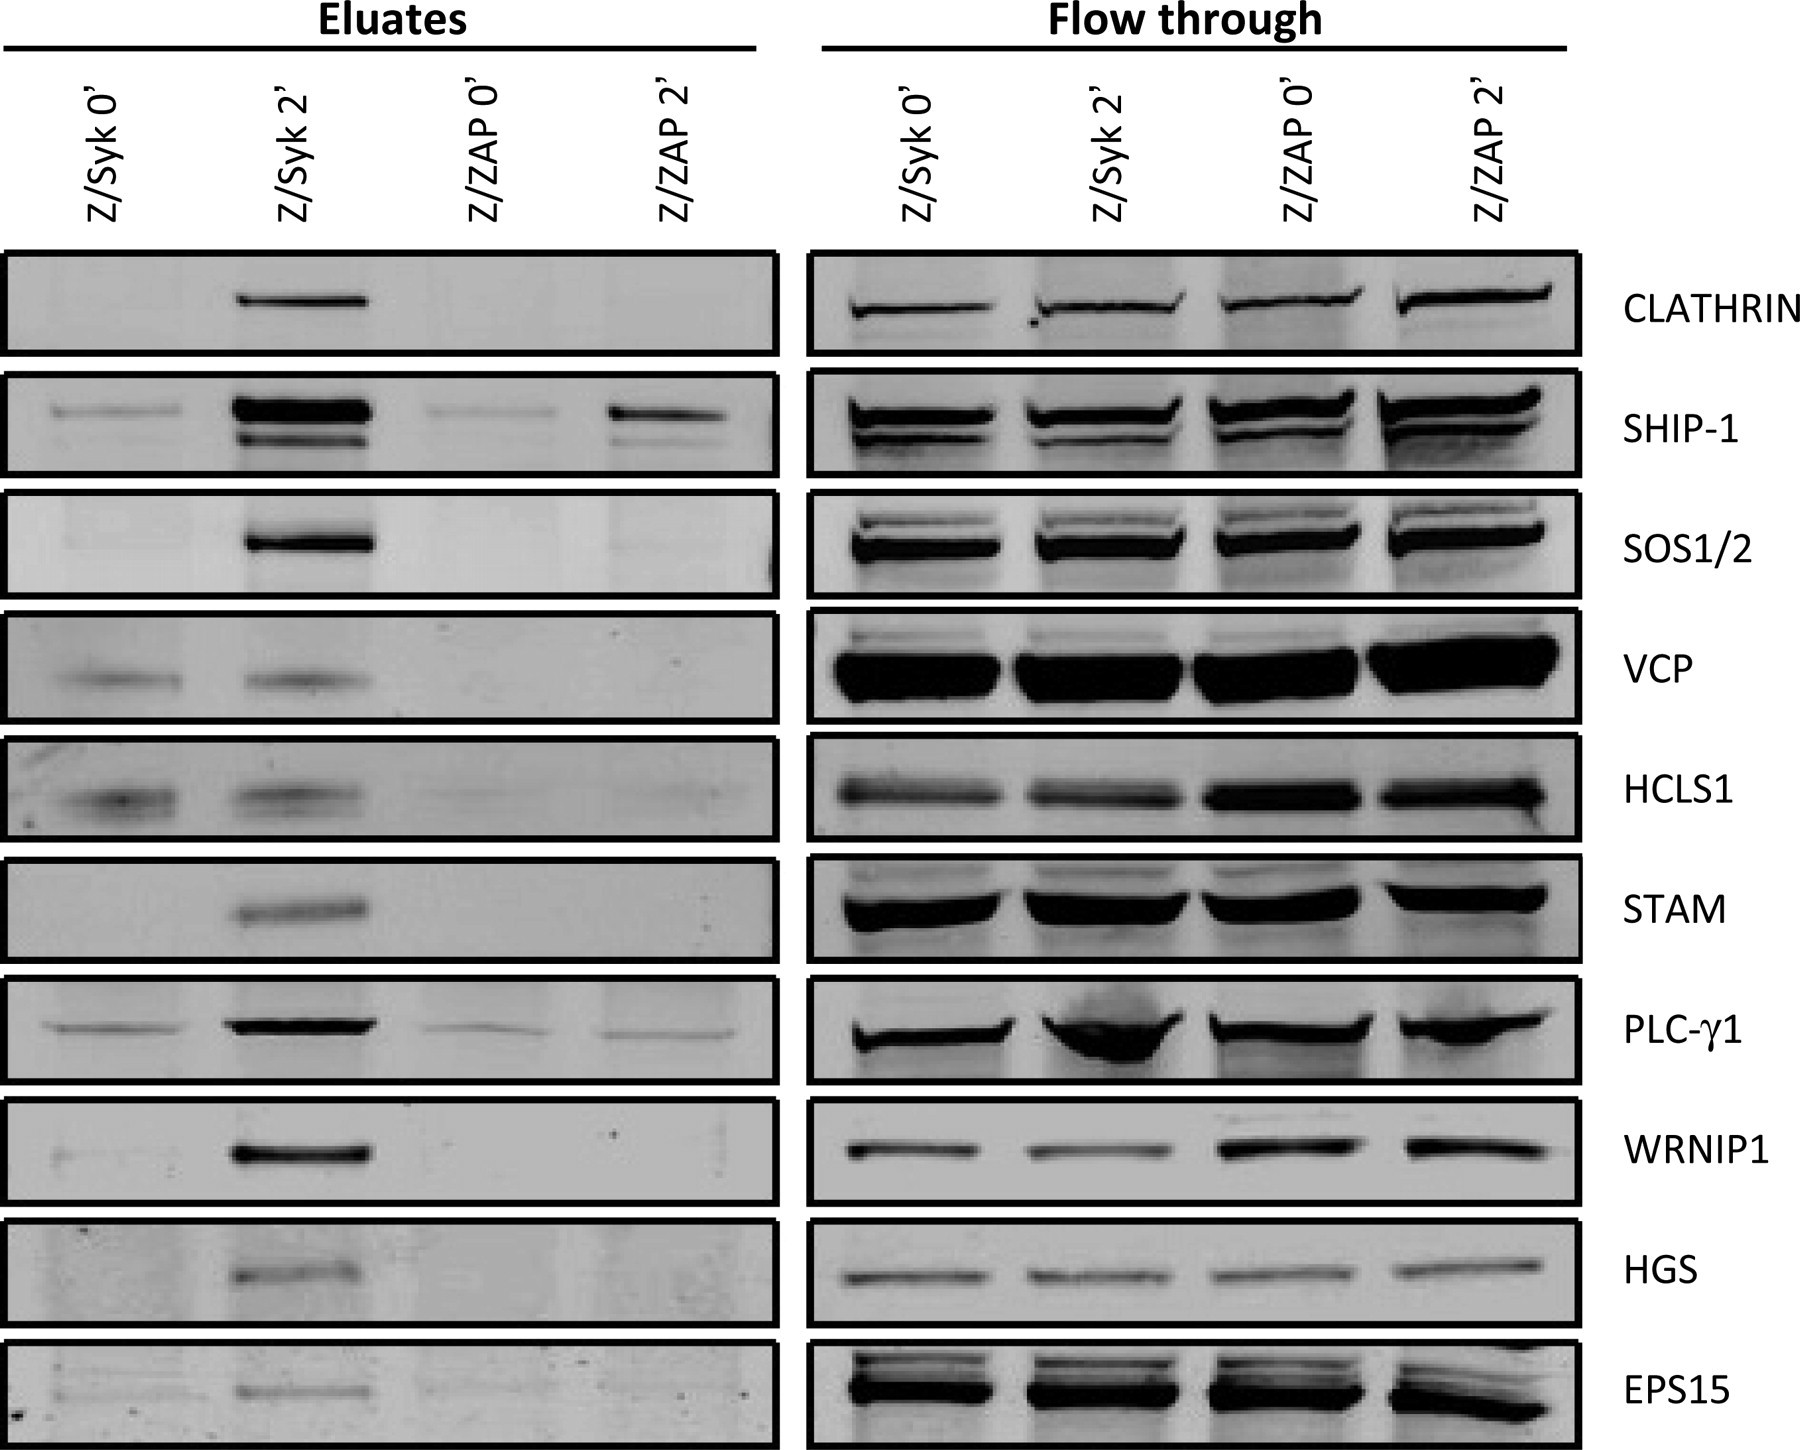
Western blot analyses of 10 differentially identified proteins that belong to the vesicle/trafficking pathway. Z/Syk and Z/ZAP cells were incubated with biotinylated anti-CD3 then activated by cross-linking with streptavidin. Total cell lysates from two-minute anti-CD3-activated cells were subjected to 4G10 immunoprecipitation. Eluted proteins were separated on SDS-PAGE, transferred to PVDF and subsequently probed with antibody against each of the proteins
Additional analyses to semi-quantitatively compare protein amount/abundance in samples were performed using spectral counting. The direct connection of spectral counts and protein abundance has been established. 19,20 The resulting spectral counts of three immuno-capture experimental biological replicates are shown in Figure 6. In 10 out of 10 proteins tested, the number of MS/MS spectra in Z/Syk cell eluates was significantly greater than those identified in Z/ZAP cell eluates, thus further confirming the results obtained from biochemical assays.
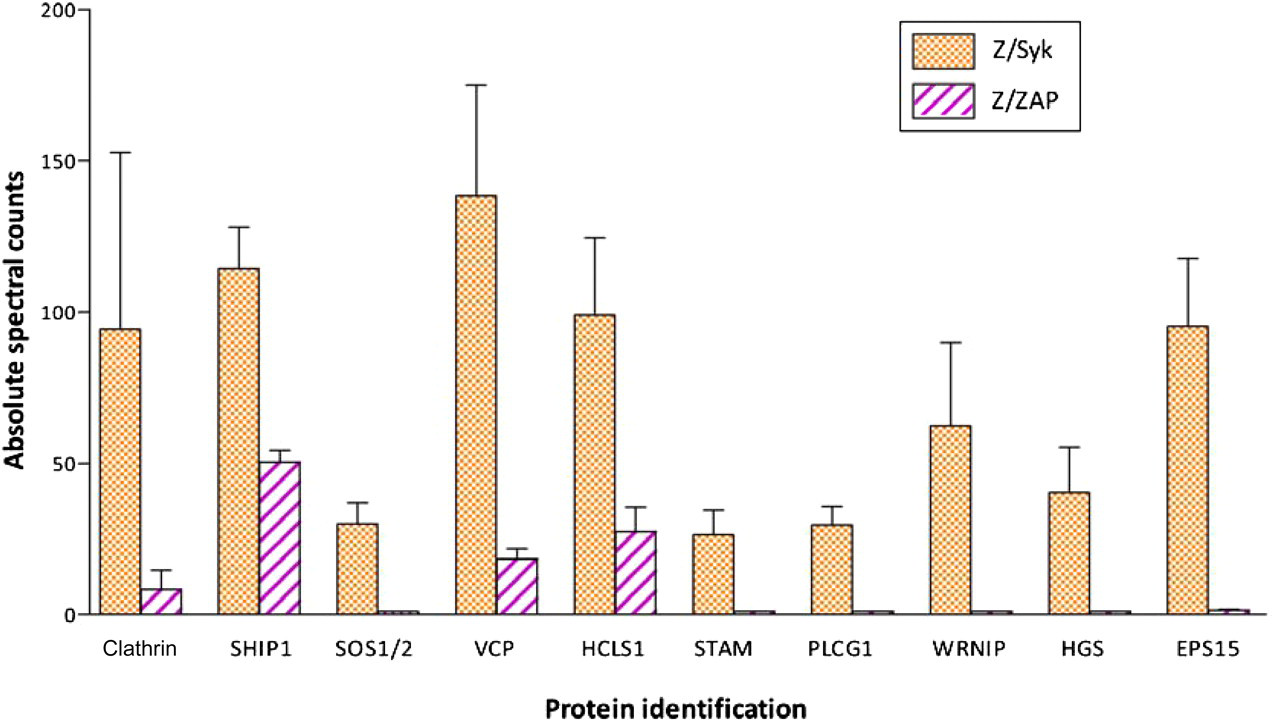
Validation of identified proteins using spectral counting for label-free semi-quantitation of MS/MS data. Total MS/MS spectra for protein identification were determined through Scaffold software analyses. The number of MS/MS spectra identified in Z/Syk versus Z/ZAP cells is graphed for each of the 10 biochemically validated proteins. Bars indicate the average value of each protein detected in three biological replicates ±SEM. Expression of each protein was found to be significantly different in Z/Syk versus Z/ZAP cells (see Table 1); P values for each protein shown are given in Table 1 (A color version of this figure is available in the online journal)
Different tyrosine-phosphorylated proteins were identified in Z/Syk or Z/ZAP cells
One main purpose of the current study was to identify phosphorylated proteins differentially precipitated in eluates from Z/Syk cells versus Z/ZAP cells. To understand the phosphorylation status of differentially identified proteins, phosphoprotein site-specific modification analyses were performed based on MS/MS spectra. Ionized phosphate groups were detected in the MS/MS spectrum by examining a fragment ion loss of m/z 79 (PO3 −) typically seen within phosphorylated peptides. Because phosphorylation modification of proteins plays a critical role in regulating protein biological function, this analyses would provide important information on which proteins might contribute to differences in the response of Z/Syk or Z/ZAP cells to TCR stimulation.
The phosphorylation sites detected in differentially identified proteins are listed in Table 3. An MSn spectral scan of an identified phophopeptide, belonging to Shc, is shown in Supplemental Figure 1 along with the ion peak list in Supplemental Table 4. The results from analyses of proteins identified in Z/Syk eluates showed that a total of 11 proteins were identified to have at least one phosphorylation site. In comparison, analyses of proteins identified in Z/ZAP eluates showed only two phosphorylated proteins (Table 3). Consistent with the biochemical analyses, the data indicated that Z/Syk cells had more phosphoproteins than did Z/ZAP cells. Altogether, these results demonstrated that more phosphoprotein complexes were induced in Z/Syk cells than in Z/ZAP cells after TCR activation, which may contribute to pro-survival behaviors of Z/Syk lymphoma cells.
Phosphorylated proteins identified in Z/ZAP and Z/Syk cell eluates
Discussion
Previous studies in our laboratory have demonstrated that activation of T lymphoma cells expressing Z/Syk, but not Z/ZAP kinase, can negatively regulate cell activation and AICD, perhaps due to differential tyrosine phosphorylation of proteins induced in activated cells. 10 In the current study, we used a label-free comparative proteomics approach to address this hypothesis and to better understand the functional profile of tyrosine-phosphorylated proteins and their associated proteins differentially induced in activated Z/Syk versus Z/ZAP cells. In this study, we detected hundreds of high-quality protein identifications using the Scaffold software. Their appearance across biological replicates demonstrated the reliability of this approach. Using this approach, the MS/MS spectral count for each identified protein provides us with a semi-quantitative comparison among different biological samples. The number of MS/MS spectra assigned to an individual protein was used as the basis for calculating the relative protein abundance in the current study. Overall, the label-free semi-quantitative method provided excellent correlation to protein abundance in the cell samples, evidenced by the reproducibility among biological replicates. While the mass spectrometry data are dependent on the complexity of sample and the parameters of acquisition, we were able to confirm these results through Western blot analyses. Therefore Western blot analyses provided a method of validation in agreement with our mass spectrometry approach, which was independent of sample complexity. An important feature and benefit of this approach came from comparing activated samples of enriched tyrosine-phosphorylated immunoprecipitates from the two lymphoma cell samples, enabling us to detect small changes in activated versus non-activated cells. Additionally, in comparison to studies that solely examine global proteomes, this approach allows us to detect individually modified components of a particular molecular/functional pathway. 21–23 As a result, our study presents novel findings demonstrating the identification of differentially activated/induced prominent molecular pathways, such as endocytic pathways, that may help explain observed phenotypes in the two studied T lymphoma cell lines.
Among differentially induced molecular and/or functional pathways, many proteins uniquely identified in Z/Syk cells belonged to the vesicle/trafficking functional category, which includes endocytic pathways. It is known that downregulation and internalization of TCR occurs during T-cell activation, and can be recycled through endocytic pathways before being re-expressed on the cell surface. 24–26 This may serve as a control mechanism to regulate the strength or duration of a T-cell-mediated response. Deficient or hyperactivation of proteins involved in those pathways can affect vesicle transport and trafficking, leading to various hematological diseases and cancers. 27–29 It is likely that induction of more proteins involved in such pathways in Z/Syk cells than in Z/ZAP cells may affect TCR expression and/or recycling to the cell surface. This would in turn affect the quality and/or quantity of TCR signals induced in these T lymphoma cells and, consequently, their distinct response to activation and AICD. In support of this hypothesis, previous studies showed that defects in clathrin-mediated endocytosis of surface receptor complexes in activated cells resulted in signals sustained for longer periods of time, causing continued activation and potential lack of growth inhibition, which has been shown to contribute to the development of tumor cells. 30–33 Alternatively, sustained activation of the cells, depending on the strength and type of signals received during activation, may also induce/regulate AICD. 34–36
To better understand the potential functions of phosphorylation sites present in phosphorylated proteins (Table 3), further analyses were performed using phospho-specific databases such as PhosphositePlus v1.0 (
In summary, the proteins that were differentially found in Z/Syk or Z/ZAP cell eluates are likely involved in the differential responses of these two T lymphoma cell lines to activation and AICD. In addition, our novel results showed that many of the proteins differentially detected in Z/Syk cells were phosphorylated and belonged to cell cycle and vesicle/trafficking functional pathways, including endocytic pathways, suggesting that proteins involved in these pathways may regulate activation and/or AICD of these tumor cells. These studies lay the foundation for further in vitro and in vivo biological function investigations into the relationship/interaction among these proteins, their involvement in specific molecular pathways, such as the endocytic pathway, their roles in regulating proliferation and tumorigenicity of T lymphoma cells, and whether they are potentially novel molecular therapeutic targets to control or treat T-cell lymphoma.
Footnotes
Acknowledgements
The authors would also like to thank R Moore for assistance with LC-MS/MS analyses and Silvia Da Costa for critically reading the manuscript. This work was supported in part by funding from a NCI Lymphoma SPORE P50 CA107399 and NIH P30 CA33572, which supports the City of Hope Cancer Center Mass Spectrometry and Proteomics Facility. SO was supported by a NCI designated Ruth L Kirschstein National Research Service Award F31 CA 117055.
References
Supplementary Material
Please find the following supplemental material available below.
For Open Access articles published under a Creative Commons License, all supplemental material carries the same license as the article it is associated with.
For non-Open Access articles published, all supplemental material carries a non-exclusive license, and permission requests for re-use of supplemental material or any part of supplemental material shall be sent directly to the copyright owner as specified in the copyright notice associated with the article.