
Abstract
The majority of murine models of iron sucrose-induced iron overload were carried out in adult subjects. This cannot reflect the high risk of iron overload in children who have an increased need for iron. In this study, we developed four experimental iron overload models in young rats using iron sucrose and evaluated different markers of iron overload, tissue oxidative stress and inflammation as its consequences. Iron overload was observed in all iron-treated rats, as evidenced by significant increases in serum iron indices, expression of liver hepcidin gene and total tissue iron content compared with control rats. We also showed that total tissue iron content was mainly associated with the dose of iron whereas serum iron indices depended essentially on the duration of iron administration. However, no differences in tissue inflammatory and antioxidant parameters from controls were observed. Furthermore, only rats exposed to daily iron injection at a dose of 75 mg/kg body weight for one week revealed a significant increase in lipid peroxidation in iron-treated rats compared with their controls. The present results suggest a correlation between iron overload levels and the dose of iron, as well as the duration and frequency of iron injection and confirm that iron sucrose may not play a crucial role in inflammation and oxidative stress. This study provides important information about iron sucrose-induced iron overload in rats and may be useful for iron sucrose therapy for iron deficiency anemia as well as for the prevention and diagnosis of iron sucrose-induced iron overload in pediatric patients.
Introduction
Iron deficiency is one of the main causes of anemia, the most common nutritional problem in the world, affecting up to 25% of the world's population, 1 especially young children due to their rapid growth and higher iron needs. Recent estimates put the global prevalence of iron deficiency in breastfed children at 6–37%. 2 In children with iron deficiency anemia who have failed oral iron therapy, intravenous administration of iron results in good clinical responses. 3 Moreover, anemic children with chronic kidney disease, especially those receiving hemodialysis, require intravenous iron rather than oral iron supplementation to replenish their iron stores. 4 Iron sucrose administration is currently one of the most commonly employed intravenous iron therapies because of its safety and efficacy in the treatment of iron deficiency. 5,6 However, iron sucrose may have the potential to generate oxidative stress and inflammatory response, and enhance bacterial growth. 7,8 Therefore, the safety of this iron complex use in humans is still controversial. In children, most studies suggest that intravenous iron sucrose administration has a good clinical result, with minimal adverse reactions. 3,9,10 However, a study has shown that iron sucrose supplementation in hemodialysis children results in a possible iron overload. 11 Thus, children under iron sucrose therapy for iron deficiency anemia may be a population at risk of iron overload.
In such a context, iron overload models carried out in young rats using iron sucrose may be indispensable to complement the comprehension of the iron overload situation in children. To our knowledge, there is no information about dose translation of iron sucrose from human to rat and hence no official rat model of iron sucrose-induced iron overload has been described in the literature. However, a dosage of 2–3 mg/kg body weight (bw)/d is recommended for the prevention of iron deficiency in children. 12 This finding enables us to calculate the dose translation from children to rat using the formula based on body surface area, 13 and the result is expressed as about 10 mg/kg bw. Therefore, we suppose that the doses of iron sucrose required for induction of iron overload in rats must be superior to 10 mg/kg bw. In this study, we chose a dose of 15 mg/kg bw (≈3.6 mg/kg in children) that is slightly higher than that used in clinical practice (3 mg/kg bw) in order to demonstrate the possibility of iron overload due to iron sucrose therapy in children. In parallel, a second dose of 75 mg/kg bw was also used to determine the effect of dose on iron overload and oxidative stress status. Indeed, two studies carried out in rats using iron sucrose at the doses of 40 and 50 mg/kg bw have demonstrated iron accumulation in liver and spleen without oxidative stress. 14,15
As presented above, a dose of iron sucrose given intravenously to children (2–3 mg/kg bw) is translated to 10 mg/kg bw in rat. In addition, the dose of iron sucrose given intraperitoneally to rats (10 mg/kg bw) was comparable with that used in clinical practice. 16 Thus, there is perhaps no difference between intravenous and intraperitoneal routes of iron sucrose administration, which is supported by evidence that iron administered intraperitoneally will be cleared from the peritoneum and then be distributed as iron injected intravenously. 17 In other words, rat models of iron overload induced by intraperitoneal administration of iron sucrose may reflect well iron overload status resulting from intravenous injection of iron sucrose in humans. Moreover, intraperitoneal route seems to be the most suitable and effective route for iron administration in young rats. Indeed, four-week-old animals are still too young and their tail veins are too small to withstand repeated intravenous injections of iron sucrose. Therefore, iron overload was induced by intraperitoneal administrations of iron sucrose in this study.
The aim of the present study was to establish for the first time, four different iron overload models in four-week-old male Wistar rats. Two models of chronic iron overload were carried out by intraperitoneal injections of iron sucrose at the doses of 15 and 75 mg/kg bw (3 times/week) for four consecutive weeks (long-term). Two other models of acute iron overload were carried out by intraperitoneal injections of iron sucrose at the dose of 75 mg/kg bw (6 times/week) for one and two consecutive weeks (short term). Two iron treatment frequencies (3 and 6 times/week) reflect the frequencies of iron sucrose therapy in humans. 5,18 Three durations of iron treatment (1, 2 and 4 weeks) aim at certifying that iron overload always occurred in adolescent rats (5–8 weeks of age), which is important for reflecting risks of iron overload in children. These models should permit the investigation of the effect of dose, treatment frequency and duration on iron overload status. In parallel, we also evaluated tissue oxidative stress and inflammation as consequences of iron overload to verify the safety and tolerability of iron sucrose.
Materials and methods
Animals
Three-week-old male Wistar rats (64 animals each weighing about 80 g bw, obtained from Janvier, Le Genest St Isle, France) were housed in the animal care facility (four animals per cage) and allowed to acclimatize for five days prior to the start of experiments. They would be used for experiments at four weeks of age. The animals were given free access to standard pelleted chow and tap water, and were maintained on a 12 h light/dark cycle. The Animal Care and Use Committee of the Picardy Jules Verne University (Amiens, France) approved all experiments.
Chemicals
Iron sucrose (Venofer®) was obtained from Vifor France SA (Levallois Perret, France). An iron staining kit, superoxide dismutase (SOD) assay kit, glutathione (GSH) assay kit, and thioglycolic acid, 1 N hydrochloric acid and 3 mmol/L sodium acetate were purchased from Sigma-Aldrich (St-Quentin Fallavier, France). Sterile saline (0.9% NaCl) was obtained from Aguettant SAS (Lyon, France). Four percent buffered-paraformaldehyde was purchased from Labonord SAS (Templemars, France). A DC protein assay kit was obtained from Bio-Rad Laboratories, Inc (Marne-la-Coquette, France). A Bioxytech® MDA-586 assay kit was purchased from Oxis International Inc (Portland, OR, USA). Ultra-pure water and 20% trichloroacetic acid were obtained from Chem-Lab NV (Zedelgem, Belgium). Iron standard solution (1 mg/mL) was purchased from High Purity Standards (Charleston, SC, USA). Sodium 3-(2-pyridyl)-5,6-bis(4-phenylsulfonate)-1,2,4-triazine (ferrozine) was obtained from Acros Organics (Geel, Belgium). An RNeasy mini kit was purchased from Qiagen SA (Courtaboeuf, France). Taqman gene expression assays for hepcidin gene (Hamp; Rn00584987_m1), glyceraldehyde 3-phosphate dehydrogenase (GAPDH) gene (Rn99999916_s1) and Taqman gene master mix were designed and obtained from Applied Biosystems Inc (Foster City, CA, USA).
Experimental design
Rats were randomly divided into eight groups (8 animals per group) as follows: two iron groups were given iron sucrose by daily intraperitoneal injections (6 times/week) for one and two weeks at a dose of 75 mg/kg bw (high dose) (experimental protocols I and II). The other two iron groups were intraperitoneally injected with iron sucrose at doses of 75 (high dose) and 15 mg/kg bw for four consecutive weeks (3 times per week) (experimental protocols III and IV). Four respective control groups received an equivalent volume of sterile saline. At the end of each experimental period, animals were sacrificed and blood was drawn in heparin-coated tubes. Plasma was separated by centrifugation (7000 rpm; 10 min; 4°C) and stored at −28°C until assays were performed. Different organs such as the liver, kidney, lung, small intestine, colon and spleen were collected and stored at −80°C. The brain was stored in 4% buffered-paraformaldehyde at room temperature until use.
Determination of serum iron indices
Serum iron indices such as serum iron (SI), serum total iron-binding capacity (TIBC), serum transferrin (ST), serum transferrin saturation fraction (TSF) and serum ferritin (SF) were measured in the Biochemistry Laboratory of Amiens University Hospital (Amiens, France) using a Clinical Chemistry Analyzer Advia® 1650 system (Bayer Healthcare, Fernwald, Germany). SI was determined by a colorimetric assay using Siemens reagent 74077 (Siemens AG, Munich, Germany). The specimens were acidified by submerging them in acetate buffer containing ascorbic acid. Thus, iron was liberated from transferrin and simultaneously reduced to the ferrous form that was identified using ferrozine. The dissociated transferrin was then used to measure TIBC, ST and TSF, using Siemens reagent 74054 (Siemens AG). SF levels were evaluated by turbidimetric immunoassay through an immunoprecipitation reaction with anti-ferritin antibody using Randox reagent FN3453 (Randox Laboratories SA, Mauguio, France).
Total tissue iron content and localization of iron-positive cells
Liver, spleen, lung, kidney, small intestine and colon tissue fragments were fixed in 4% buffered-paraformaldehyde for 24 h before embedding in paraffin blocks. Five-μm sections were cut with a microtome and stained with Prussian blue staining reagents to identify Fe3+ particles by the observation of hemosiderin granules. Iron deposits in tissue were visualized by light microscopy as blue deposits within cells.
Rat brains were fixed in 4% buffered-paraformaldehyde for four hours and then transferred to a 30% sucrose solution in phosphate-buffered saline overnight. The entire brain was sectioned into two hemispheres, one of which was used to measure the iron content by optical spectrometry after mineralization with chlorhydric acid and nitric acid. Results were expressed as microgram of iron per brain.
The method for measurement of total tissue iron content without distinction between ferrous (Fe2+) and ferric (Fe3+) iron was adapted from Rebouche et al. 19 Liver, spleen, lung, kidney, small intestine and colon tissues (0.1 g each) were homogenized in 1 mL of ultra-pure water, using an Ultra-Turrax homogenizer (IKA–Werke, Staufen, Germany). Equal volumes (0.5 mL) of each tissue homogenate and protein precipitation solution (1 N chlorhydric acid and 10% trichloroacetic acid in ultra-pure water) were combined in microcentrifuge tubes, vortex-mixed and then incubated at 85°C for 90 min. Tissue samples were cooled in water at room temperature for two minutes, vortex-mixed and then centrifuged at 11,000 rpm for 10 min. Supernatant aliquots (150 μL) were mixed with 150 μL of chromogen solution (0.058 mmol/L ferrozine, 1.5 mmol/L sodium acetate and 1.5% thioglycolic acid in ultra-pure water). After a 30-min incubation at room temperature, 200 μL of each sample was transferred to a 96-well plate. Absorbance was measured at 595 nm, using a 2103 EnVision® multilabel reader (PerkinElmer, Boston, MA, USA). Standard curves were prepared daily using iron standards containing 0, 0.25, 0.5, 1, 2 and 4 μg/mL of the iron standard solution, and diluted with the protein precipitation solution previously used (1 N chlorhydric acid and 10% trichloroacetic acid in ultra-pure water). The final iron concentration was calculated and expressed as microgram of iron per gram of tissue.
Myeloperoxidase activity assay
The activity of myeloperoxidase (MPO), a granulocyte-associated enzyme, was measured in the liver, lung, small intestine and colon as previously described. 20 MPO activity was measured at 450 nm using an EL × 808 absorbance microplate reader (Biotek, Bad Friedrichshall, Germany) and then expressed as MPO units per gram of protein whereby 1 unit (u) was defined as the quantity of enzyme able to convert 1 μmol of H2O2 to water in 1 min at room temperature.
Malondialdehyde assay
Malondialdehyde (MDA) was determined as a strong indicator of the degree of lipid peroxidation induced by oxidative stress. Liver, spleen and lung samples were assayed for MDA content by using the Bioxytech® MDA-586 assay kit following the manufacturer's instructions. Results were calculated from a standard curve and expressed as nmoles per milligram of protein.
Determination of SOD
SOD is an antioxidant enzyme that protects against oxidative stress-induced cell destruction by scavenging excess superoxide. SOD activity in the liver, spleen and lung was evaluated using the SOD assay kit according to the manufacturer's protocol. Results were expressed as units (u) of SOD per milligram of protein.
Determination of intracellular reduced GSH
The following protocol was adapted from the manufacturer's recommended procedure. Liver, spleen and lung samples (0.05 g) were deproteinized and homogenized in 500 μL of 5% 5-sulfosalicylic acid. The homogenates were stored at 4°C for 10 min and then centrifuged at 7000 rpm for 10 min. The volume of the supernatant was measured and then the samples were diluted 20-fold to remain within the detection range for the assay procedure. The assay was based on an enzymatic recycling reaction of GSH contained in 10 μL of sample solutions with 5,5'-dithio-bis-2-nitrobenzoic contained in 150 μL of a working mixture and with 50 μL of nicotinamide adenine dinucleotide phosphate-oxidase. After incubation at room temperature for five minutes, the reaction finally led to the formation of the yellow-colored 5-thio-2-nitrobenzoic acid. The GSH contents were determined from a standard curve of known GSH concentrations at 405 nm and expressed as nmoles per milligram of tissue.
RNA isolation, complementary DNA synthesis and realtime quantitative analysis
Total RNA was extracted from liver tissues (≈30 mg) using the Qiagen RNeasy mini kit according to the manufacturer's instructions. The mRNA content was determined spectrophotometrically using an Eppendorf Biophotometer. Complementary DNA (cDNA) was generated by reverse-transcription of 2 μg mRNA using the high-capacity cDNA reverse transcription kit containing RNase inhibitor (Applied Biosystems Inc) according to the manufacturer's instructions.
The realtime quantitative polymerase chain reaction (RT-PCR) was run on 96-well PCR microplates (Applied Biosystems Inc) containing 9 μL diluted cDNA, 1 μL Taqman gene expression assay primers and 10 μL Taqman gene master mix in a total of 20 μL per sample per well. PCR was run on an Applied Biosystems 7900 thermal cycler following the manufacturer's instructions. The cycle number at the linear amplification threshold (Ct) of the endogenous control GAPDH gene and the target gene were recorded. Relative gene expression (the amount of target, normalized to the endogenous control gene) was calculated by using the comparative Ct method formula 2−ΔΔCt. 21
Statistical analysis
Statistical analyses were performed with NCSS 2007 software package (Kaysville, UT, USA). All the results are presented as means ± SEM. Group differences were examined for significance using one-way analysis of variance (ANOVA) followed by the Tukey post hoc test. Multiple regression analyses were conducted with total tissue iron content, serum iron indices and liver Hamp expression as the dependent variables, and duration of iron administration (1, 2 and 4 weeks), dose of iron (15 versus 75 mg/kg bw) as well as iron administration frequency (3 versus 6 times/week) as independent variables. Differences were considered statistically significant when P < 0.05.
Results
Indices of iron status
The results of serum iron indices (SF, SI, TIBC and TSF) are shown in Table 1. SF levels were found to be relatively constant (45–51 μg/L) in all control groups and significantly higher in iron groups. TIBC, SI and ST levels were significantly reduced in the iron-treated groups compared with controls following one week of treatment (protocol I). No significant difference in TSF was observed between the different groups. Since comparisons are difficult to interpret, multiple regressions were performed with the serum iron indices as dependent variables and the characteristic of the protocols (dose of iron, duration and frequency of iron administration) as the independent variables (Table 2). These analyses revealed a significant correlation between the duration of iron administration and all serum iron indices. The dose of iron was only significantly associated with SF and SI, whereas iron administration frequency was correlated with SF, TIBC and ST. As a result, except for TSF, which was only correlated with duration of iron treatment, all the serum iron indices were correlated with the duration and dose of iron and/or the frequency of iron administration.
Serum iron indices of iron-treated rats, compared with control rats
SF, serum ferritin; TIBC, serum total iron-binding capacity; SI, serum iron; ST, serum transferrin; TSF, serum transferrin saturation fraction; bw, body weight
Three-week-old male Wistar rats were given intraperitoneal injections of iron sucrose whereas control rats were given intraperitoneal injections of sterile saline. Parametric data are means ± SEM (*P < 0.05, ***P < 0.001 versus controls, n = 8)
Results of the multiple regressions where total tissue iron content, serum iron indices and liver Hamp expression are the dependent variables, and dose of iron, duration and frequency of iron administration are the independent variables: P of the slopes of the independent variables
SF, serum ferritin; TIBC, serum total iron-binding capacity; SI, serum iron; ST, serum transferrin; TSF, serum transferrin saturation fraction; Hamp, hepcidin gene
Three-week-old male Wistar rats were given intraperitoneal injections of iron sucrose whereas control rats were given intraperitoneal injections of sterile saline (ns: non-significant, n = 64)
Distribution of Prussian-blue-stained cells
Light microscopic analysis of tissue sections showed normal tissue architecture without stainable cells in all control groups. In the small intestine and colon, no blue-stained cells were found in any of the groups. In contrast, several alveolar macrophages sequestering iron particles were identified in the lung sections of all iron-treated groups (Figure 1a). The long-term administration of high-dose iron (75 mg/kg bw, 4 weeks, protocol III) induced a heavy iron accumulation in kidney (Figure 1b). In contrast to the absence of iron deposits in the spleen of animals given iron sucrose for one and two weeks, a large number of iron-positive spleen cells were observed in animals receiving long-term iron administration at a high dose (protocol III) (Figure 1c). Animals exposed to long-term iron treatment at a low dose (15 mg/kg bw, 4 weeks, protocol IV) showed a mild iron accumulation in the spleen (Figure 1d). In liver, the Prussian-blue-stained sections revealed a qualitative lower density of accumulated iron in animals receiving low-dose iron as compared with the three groups administered with the high-dose iron (Figures 1e and 1f).
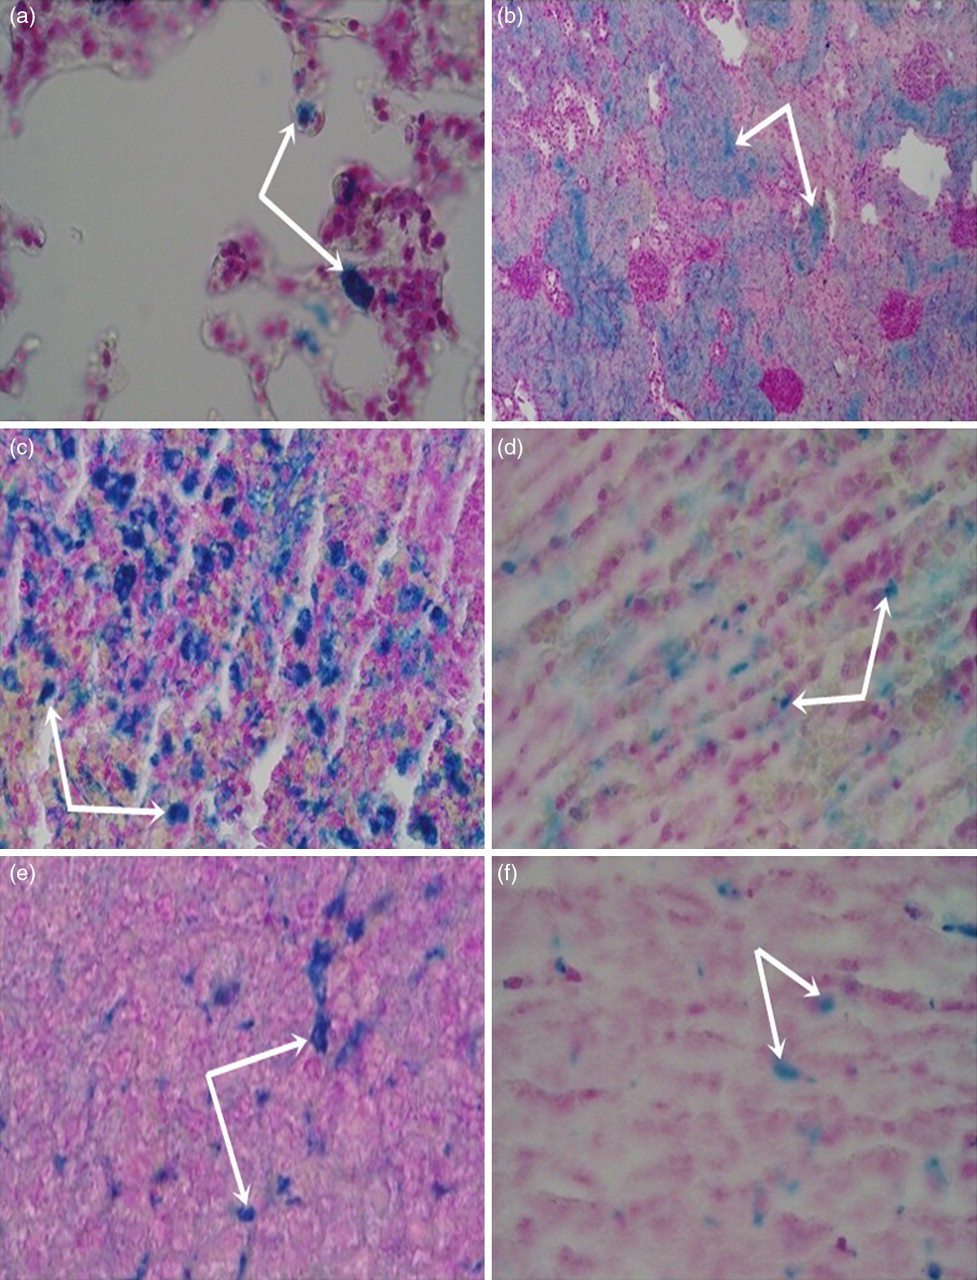
Micrograph of histological specimens of (a) lung (75 mg/kg, 6 times/week, 1 week), (b) kidney (75 mg/kg bw, 3 times/week, 4 weeks), (c) spleen (75 mg/kg bw, 3 times/week, 4 weeks), (d) spleen (15 mg/kg bw, 3 times/week, 4 weeks), (e) liver (75 mg/kg bw, 3 times/week, 4 weeks) and (f) liver (15 mg/kg bw, 3 times/week, 4 weeks) (original magnification, ×200). Arrows indicate Prussian-blue-stained cells (A color version of this figure available in the online journal)
Total tissue iron content
The average tissue iron content is illustrated in Figure 2. There was no significant difference in brain iron concentration between control and iron-loaded animals. In contrast, a significant increase in the total iron content was observed in the liver (up to 6.3-fold), spleen (up to 10.7-fold), kidney (up to 17.9-fold), small intestine (up to 12.5-fold), colon (up to 15.1-fold) and lungs (up to 1.9-fold) of the iron-treated rats. Multiple regression analyses were performed with the total iron content of the different tissues as the dependent variable and the dose of iron, duration and frequency of iron administration as the independent variables (Table 2). They revealed that the dose of iron was significantly correlated with the total tissue iron content, with the exception of brain iron content. Iron administration frequency demonstrated a significant association only with the total liver and spleen iron contents. The duration of iron administration was significantly associated with total iron content in the brain, spleen and kidney.
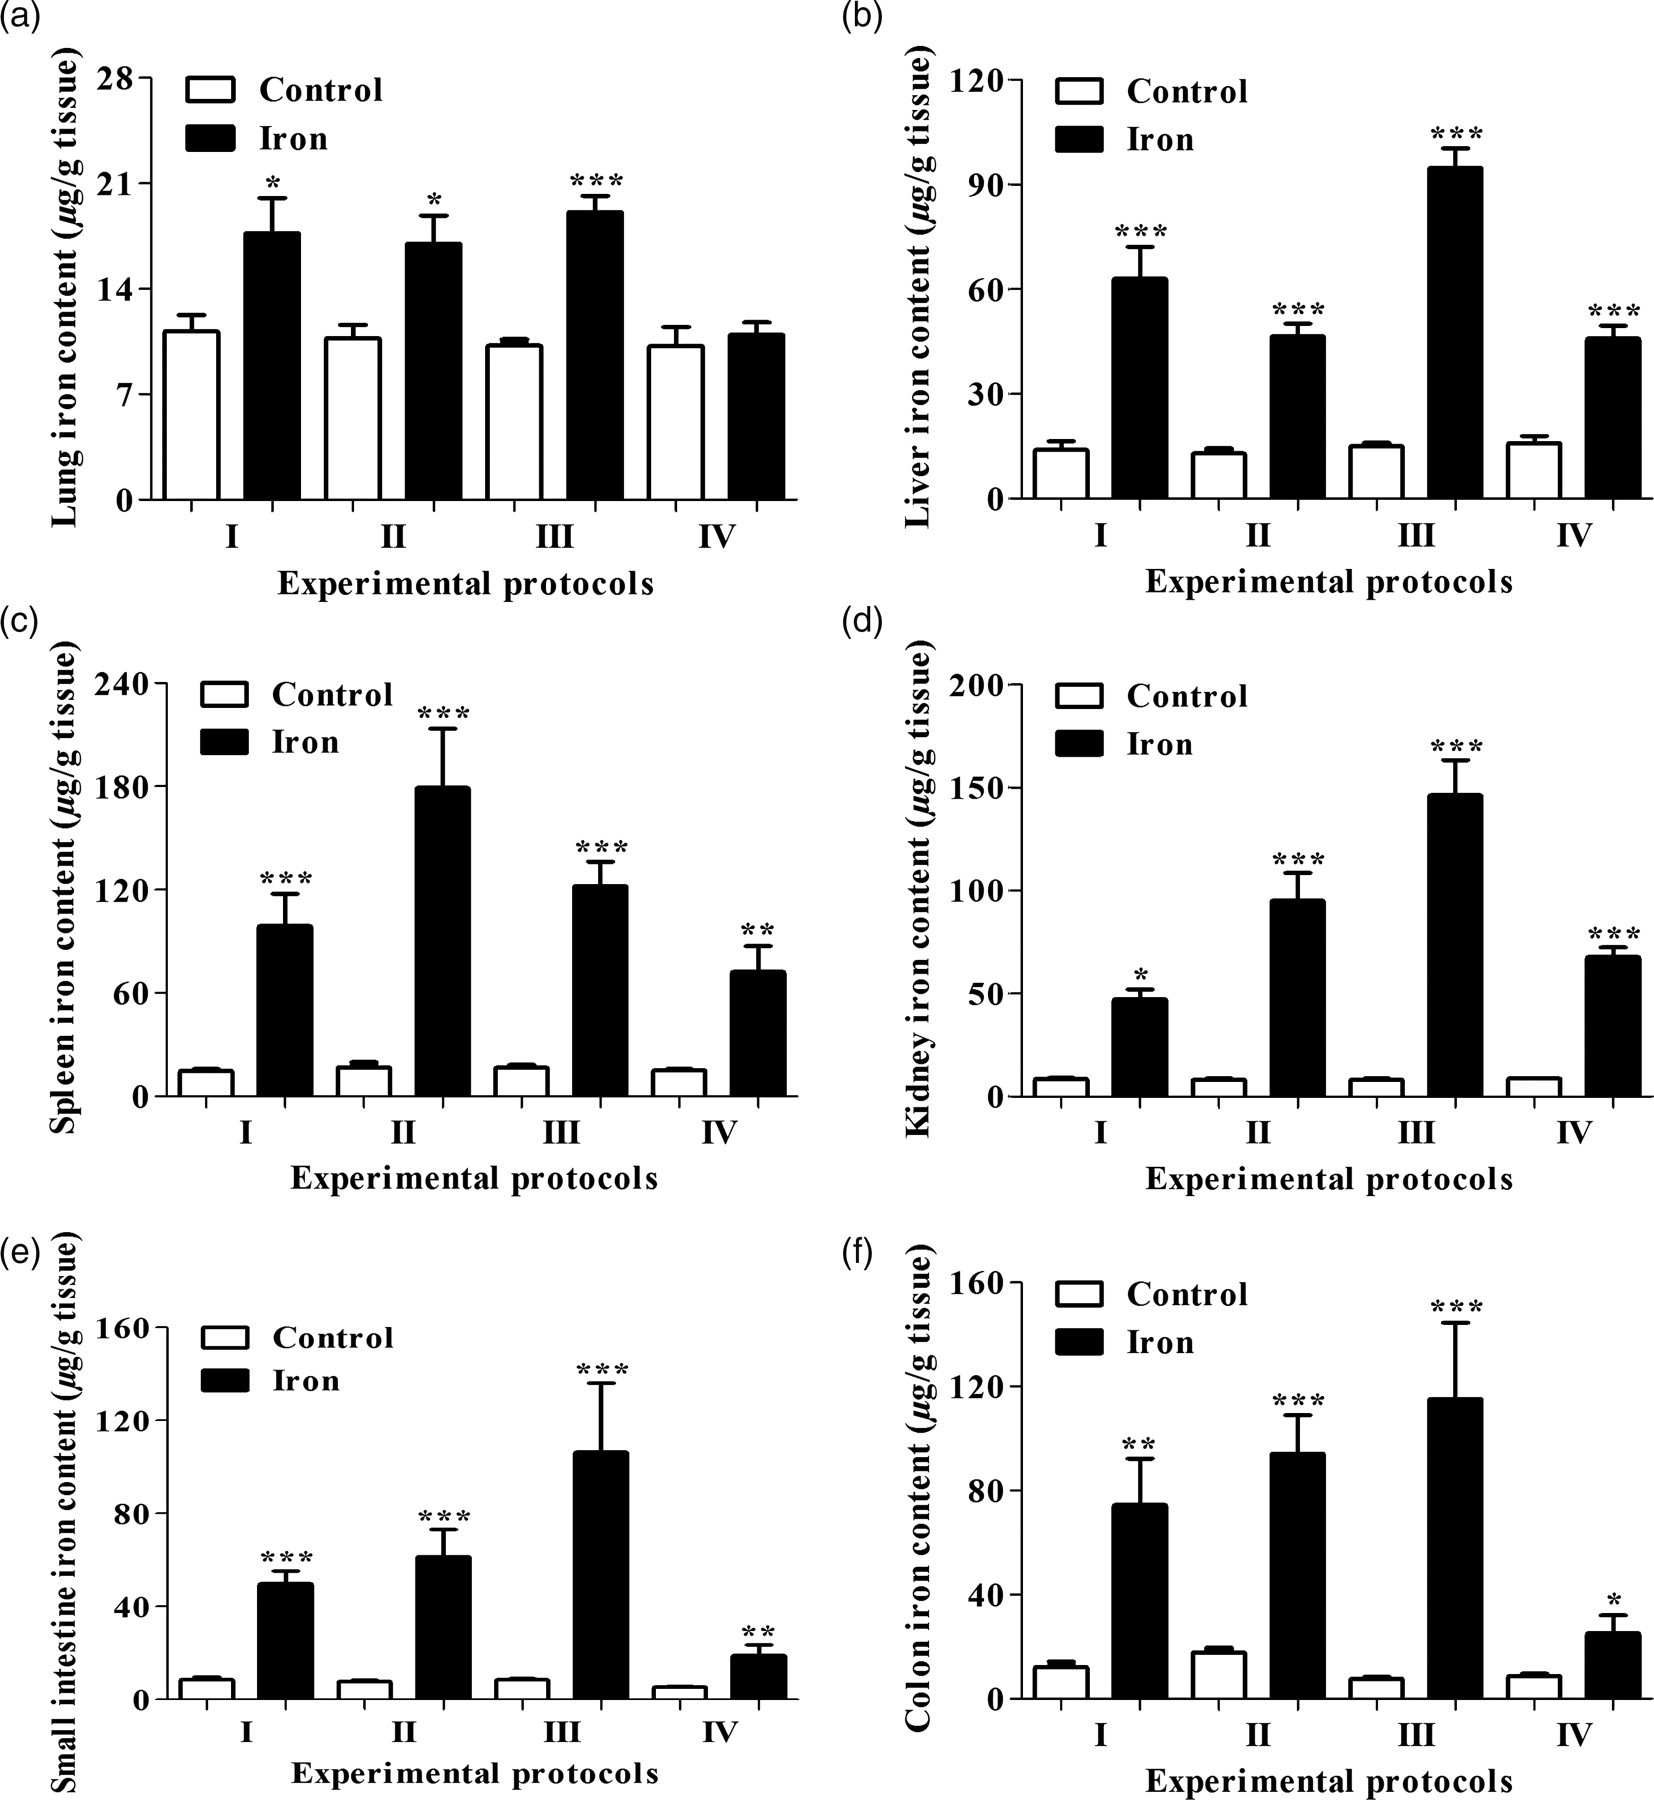
Effect of iron sucrose treatment on tissue iron concentration in iron-treated rats, compared with control rats. Three-week-old male Wistar rats were given intraperitoneal injections of iron sucrose whereas control rats were given intraperitoneal injections of sterile saline. Iron content was evaluated in lung (a), liver (b), spleen (c), kidney (d), small intestine (e) and colon (f) tissues. Parametric data are means ± SEM (*P < 0.05, **P< 0.01 and ***P < 0.001 versus control, n = 8)
MPO activity in the liver, lung, small intestine and colon
MPO activity did not significantly differ between control and iron-loaded groups (Table 3).
MPO activity (μ/g protein) in the liver, lung, small intestine and colon samples of iron-treated rats, compared with controls rats
MPO, myeloperoxidase
Three-week-old male Wistar rats were given intraperitoneal injections of iron sucrose whereas control rats were given intraperitoneal injections of sterile saline. Parametric data are means ± S.E.M (n = 8)
MDA and GSH content and SOD activity in the liver, spleen and lung of rats
MDA cell content was significantly increased in liver tissue of animals exposed to the high iron dose for one week (protocol I) in comparison with controls. In contrast, in the spleen and lung tissue, there were no significant differences between control and iron-loaded animals. In the same way, SOD activity and GSH content were not statistically different between any of the control and iron groups (Table 4).
Effect of iron treatment on MDA cell content, SOD activity and GSH cell content in the liver, spleen and lung
MDA, malondialdehyde; SOD, superoxide dismutase; GSH, reduced glutathione
Three-week-old male Wistar rats were given intraperitoneal injections of iron sucrose whereas control rats were given intraperitoneal injections of sterile saline. Parametric data are means ± SEM (**P < 0.01 versus control, n = 8)
Expression of hepcidin in the liver
RT-PCR analysis revealed a significant up-regulation of Hamp mRNA expression in the liver of iron-treated rats, compared with controls (Figure 3). A 19.5-fold increase in Hamp mRNA expression was observed in rats given a daily high dose of iron for a two week period (protocol II) compared with controls. Rats exposed to a chronic iron treatment (protocols III and IV) showed a lower Hamp mRNA expression (3.5- and 3.6-fold increases) in comparison with control animals. Multiple regression analysis was performed with the Hamp expression as the dependent variable and the dose of iron, duration and frequency of iron treatment as independent variables (Table 2). It revealed that liver Hamp expression was significantly correlated with all three components of iron administration.
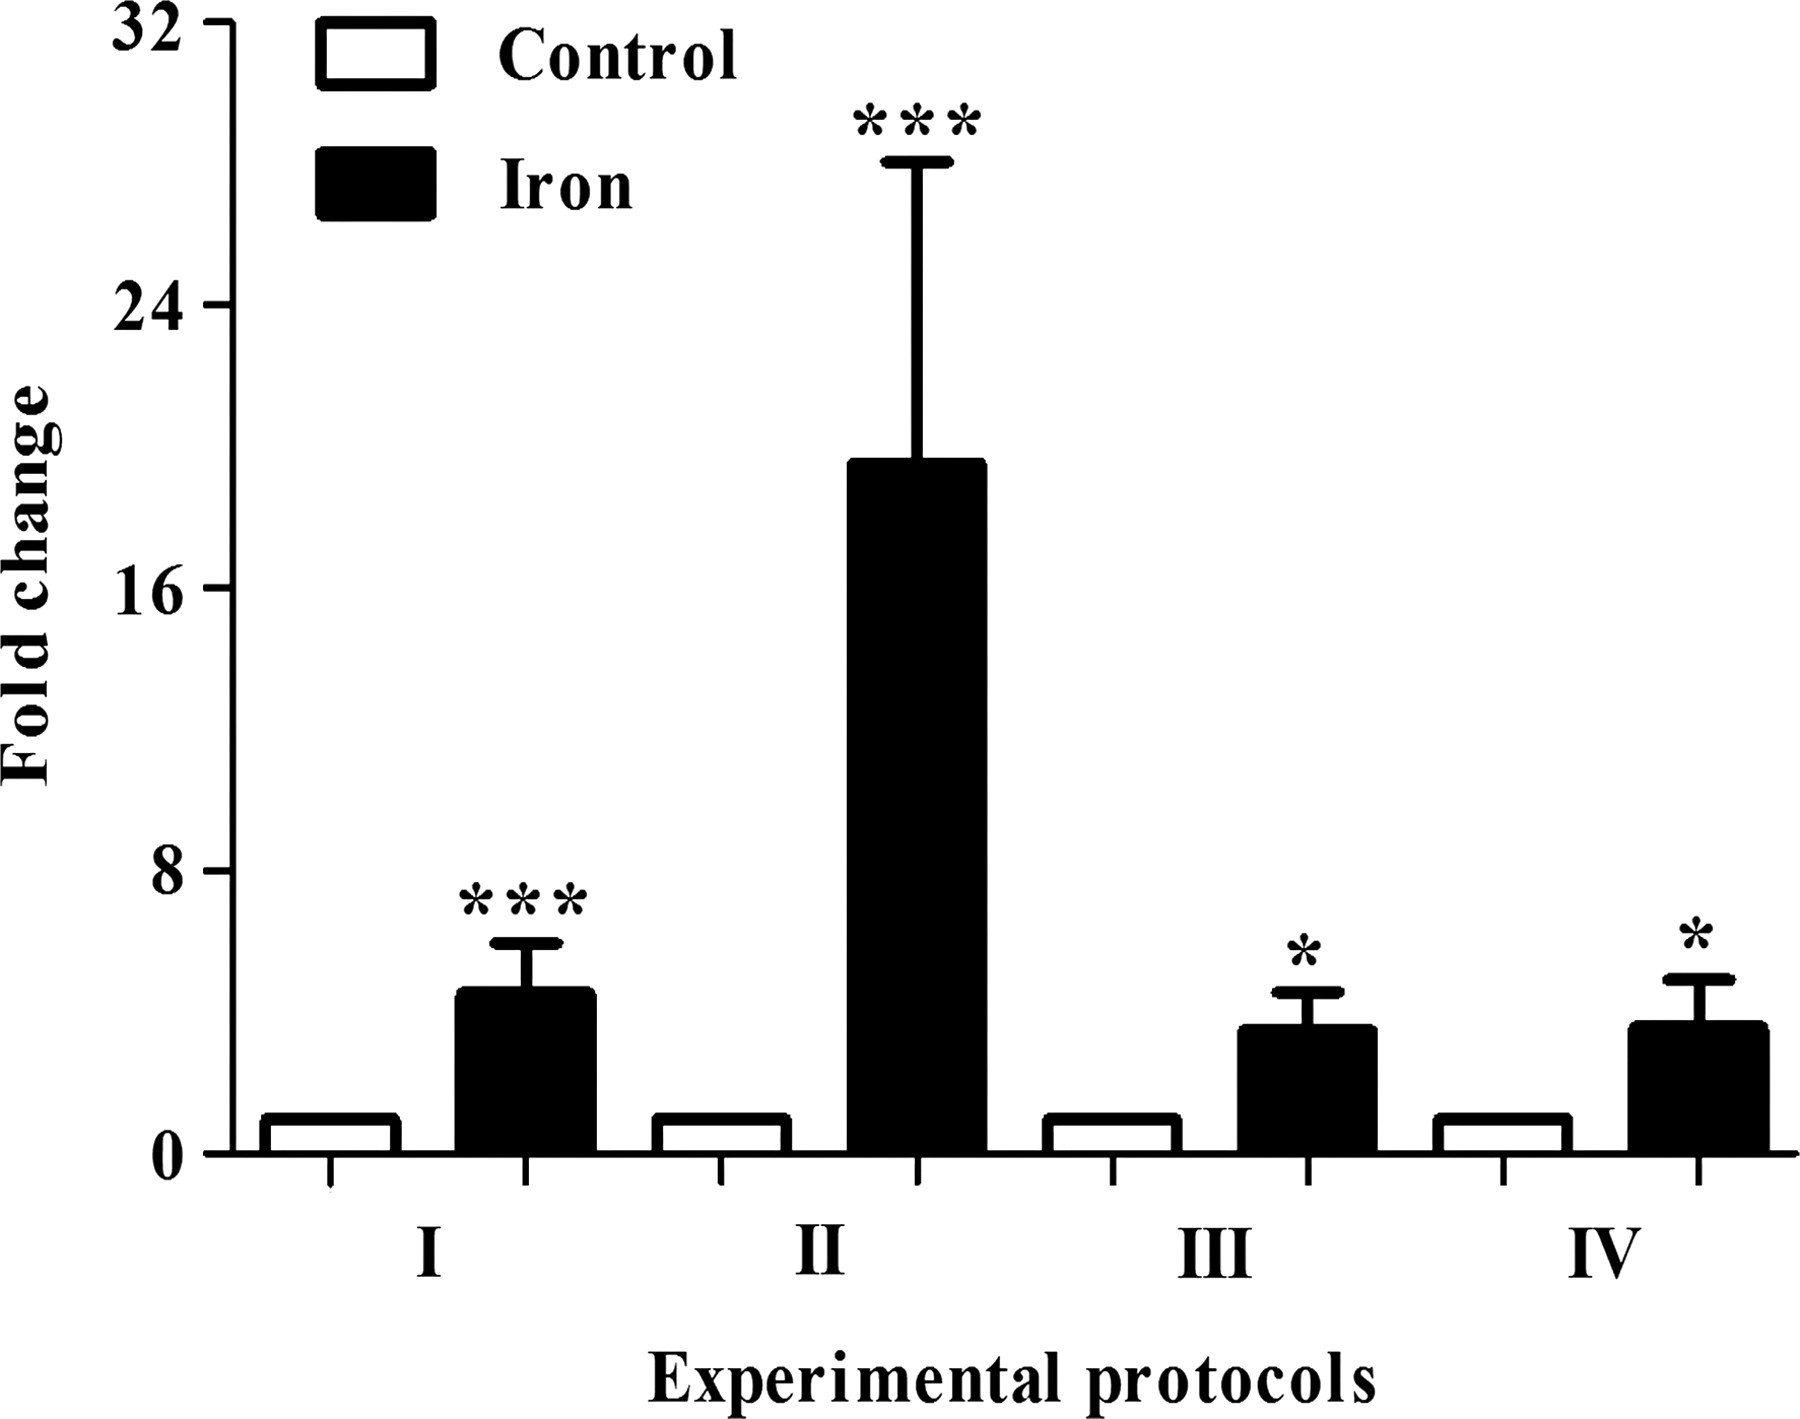
Expression of hepcidin mRNA in the liver of iron-treated and control rats. Three-week-old male Wistar rats were given intraperitoneal injections of iron sucrose whereas control rats were given intraperitoneal injections of sterile saline. Parametric data are means ± SEM (*P < 0.05 and ***P < 0.001 versus control, n = 8)
Discussion
Iron sucrose is currently used to treat iron deficiency anemia in children with chronic kidney disease, especially in those who have failed oral iron therapy. 3 However, anemic children under iron sucrose therapy may be a population at risk for iron overload because iron sucrose has been shown to result in a possible iron overload. 11 In such a context, iron overload models carried out in young rats using iron sucrose may be indispensable to complement the comprehension of the iron overload situation in children. However, to our knowledge, no official rat model of iron sucrose-induced iron overload has been reported in the literature. Therefore, our work is the first study that officially describes iron overload models carried out in young rats using iron sucrose. In the present study, we evaluated different blood and tissue markers of iron overload as well as tissue oxidative stress and inflammation as its consequences.
Among the serum iron indices, SF, an iron storage protein, is a hallmark of iron overload status. Significant elevation of SF levels (Table 1) indicates iron overload in iron-loaded rats, compared with controls, leading to disruption of body iron homeostasis. 22 Table 2 showed a significant correlation between duration of iron treatment and all serum iron parameters whereas only two parameters (SF and SI) were significantly correlated with the dose and three parameters (SF, TIBC and ST) were correlated with the frequency of iron treatment. Therefore, we suggest that the duration of iron administration is the most important factor affecting serum iron indices.
Fe3+ is generally considered as the main form of non-heme iron accumulating in animal tissues 23 and its presence is qualitatively identified using Prussian-blue staining. To our knowledge, only one previous study has measured the amount of Fe3+ accumulated in the liver, spleen, brain and heart in rats, using the electrothermal atomic absorption method and in the brain using optical spectrometry method. 15 Actually, there has been no report about quantification of Fe2+ or both Fe2+/Fe3+ in tissue. In the present study, we determined for the first time the amount of total tissue iron content (Fe2+/Fe3+), and identified qualitatively the presence of Fe3+ by Prussian-blue staining in the liver, spleen, kidney, small intestine, colon and lung. The absence of iron in the brain may be explained by the structure of iron sucrose complex that is unable to permeate the blood−brain barrier. 15 Iron overload is confirmed by a significant increase in total tissue iron content in the liver, spleen, kidney, small intestine, colon and lung in all iron groups compared with controls. Nevertheless, lung samples of rats exposed to a low dose of iron (protocol IV) showed no difference in total iron content from controls. Furthermore, the increase in lung total iron content in rats treated with a high dose of iron was not as high as that of other organs, indicating that the lung is not as sensitive as other organs for iron sucrose-related iron accumulation. Table 2 displays a significant correlation between iron administration frequency and total iron content in only two tissues (liver and spleen) and between duration of iron treatment and total iron content in three tissues (brain, spleen and kidney). We also detected a significant correlation between total iron content and dose of iron in all the examined tissues with the exception of the brain. Thus, total tissue iron content depends more on the dose, rather than the duration or frequency of iron administration.
As presented above, Prussian-blue staining was carried out to identify Fe3+ in tissues that could not be evaluated separately by quantitative measurements. The deposition of iron in livers of all iron-treated animals reflects a part of the administered iron trapped by the liver. 16 The absence of Fe3+ in the small intestine and colon of iron-loaded rats indicates that only Fe2+ is able to accumulate in the intestine (Figure 2). The domination of Fe2+ in the tissue iron accumulation was also confirmed in the spleen and kidney tissues of animals exposed to daily iron treatment (protocols I and II) and kidney tissues of animal given chronic iron injection at a low dose (protocol IV), as evidenced by the absence of Fe3+. The presence of Fe3+-stained cells only in the spleen tissue of animals exposed to four weeks of iron treatments (protocols III and IV) demonstrates that Fe3+ accumulation in the spleen needs long-term chronic iron administration. Moreover, the difference in the density of spleen cells accumulating Fe3+ between animals receiving chronic iron treatment at the high dose and those receiving the low dose (Figure 1) indicates that spleen Fe3+ loading also depends on the amount of long-term administered iron. In a study of rats given 10 mg/kg bw, Fe3+-stained cells have been identified in kidney tissues. 16 This result was in contrast to our observations, which revealed a heavy Fe3+ deposition in the kidney of rats that were chronically given the high-dose iron (75 mg/kg bw), not in those receiving the chronic low dose (15 mg/kg bw). In brief, it would appear that in subjects treated with iron sucrose, Fe2+ accumulates dominantly in tissues as compared with Fe3+. This finding has been confirmed by a suggestion that both Fe3+ and Fe2+ were richly accumulated in different organs. 24 We also believe that chronic iron sucrose administration is more effective at inducing a tissue iron overload with both ferric and ferrous states and both forms of iron may coexist at different concentrations depending on the tissue type.
Hepcidin is considered a crucial regulator of systemic iron homeostasis. The synthesis of hepcidin is believed to increase during iron overload, 25 inflammation or hypoxia. 26 Little is known about hepcidin expression in iron sucrose-induced iron overload. In this work, Hamp expression was increased in all iron-treated groups, compared with controls; the highest mRNA expression level being detectable in rats given a daily high dose of iron for a two-week period (protocol II). Chronic iron-treated rats did not reveal differences in hepatic Hamp mRNA expression, irrespective of the iron dose (15 versus 75 mg/kg bw). We also demonstrated a significant correlation between Hamp expression and all three characteristics of iron sucrose administration (Table 2). Stimulation of hepatic Hamp expression is paralleled by an increase in SF levels (Tables 1 and 2). 27 These results are consistent with previously elucidated hepcidin functions. When iron storage increases, SF elevates, and hepatic hepcidin is up-regulated to maintain the body iron homeostasis.
Iron is currently considered as an immune modulatory agent. 28 Thus, the inflammatory status in the liver, lung, small intestine and colon of rats was analyzed by the analysis of MPO activity and no difference from the controls was detectable, indicating that iron does not play a major inflammatory role by itself. This finding has been confirmed by the suggestion that iron content does not appear to be a prerequisite for the inflammatory potential. 29 Nevertheless, iron administration could aggravate intestinal inflammatory status in rats. 30,31 Indeed, the free iron liberated from the iron complex would participate in Fenton reaction for the production of reactive oxygen species which induce tissue and cell injuries. 32 In humans, the effect of iron deposition on the development of infection has been reported, 33–35 especially lung infections in patients under intravenous iron therapy. 36 In addition, iron sucrose has been shown to increase the production of monocyte chemoattractant protein-1 that is required for macrophage recruitment to the sites of inflammation. 7 Thus, the effects of iron treatment on the development of lung and intestinal inflammatory processes need to be further detailed.
Iron overload-induced oxidative stress status and oxidant activities were analyzed in the liver, spleen and lung. MDA content showed only a significant increase in the liver of rats exposed to daily iron treatment for one week (protocol I) in comparison with controls. No differences were observed between the iron overload and control groups neither in SOD activities, nor in GSH content of the liver, spleen and lung. Under normal conditions, ST is 20–35% saturated with iron. However, in iron-overloaded subjects, iron is often found in the form of non-transferrin-bound iron (NTBI) when TSF exceeds 45%. If TSF is equal or superior to 75%, NTBI will be transformed to labile plasma iron that is associated with reactive oxygen species formation and induces lipid peroxidation. 37 In this study, only rats treated with iron sucrose for one week (protocol I) revealed a TSF value equal to 74% (Table 1). Moreover, liver is the first organ to store excess iron. Therefore, a significant increase in MDA content was only detected in the liver of animals given iron sucrose for one week (protocol I), as compared with controls. Nevertheless, a TSF value equal to 74% may be insufficient to activate antioxidant activities, as evidenced by no significant difference in SOD activities or GSH content between iron-loaded rats and controls. These findings suggest that iron liberated from the iron sucrose complex does not play a critical role in inducing oxidative stress as already reported. 14,15 Indeed, the low reduction potential of the iron sucrose complex precludes its participation in Fenton reaction. 38 Furthermore, the molecular weight of this iron complex would favor its renal elimination. 15 A recent study has provided new information about the capacity of iron sucrose to release free or catalytic iron in serum, which was previously considered as a major participant in oxidative stress. 39 In this work, the authors presented the ability of catalytic iron release of different iron preparations and found minimal free iron release with iron sucrose and ferumoxytol. This would explain the restrained ability of iron sucrose to participate in oxidative stress reactions. 15,40,41 Nevertheless, the effect of iron sucrose on oxidative stress is still a subject of debate, especially the harmful nature of iron in exacerbating oxidative stress in humans and animals. 42–44
In conclusion, the present study reports officially for the first time four rat models of iron overload induced by iron sucrose. Major factors that contribute to the establishment of these models are rigorously calculated (dose of iron sucrose) or selected (age of rats, iron administration route, iron treatment frequency and duration) to reflect possible iron overload situation in children. The dose of 15 mg/kg bw (≈ 3.6 mg/kg bw in children) used to induce iron overload in rats is just slightly higher than the common dose (3 mg/kg bw) used to prevent iron deficiency in children. Therefore, we suggest that a strict control of the dose of iron sucrose in the prevention and treatment of iron deficiency in children is indispensable to avoid risks of iron overload. Our work now shows that dose of iron sucrose is the most important factor enhancing tissue iron accumulation, whereas serum iron parameters depend essentially on the duration of iron administration. In contrast, Hamp expression is controlled by all three characteristics of iron administration (dose of iron, iron treatment frequency and duration). Thus, diagnosis of iron overload in pediatric patients under iron sucrose therapy must be carried out by combining many methods such as biochemical analysis of serum iron indices, liver biopsy and molecular analysis of Hamp instead of only one of those. Although this study does not reveal an important role of iron sucrose in tissue inflammation and oxidative stress, further studies may be required to confirm these results. Generally, we believe that our iron overload models may be used in future studies to elucidate the mechanisms of iron sucrose-induced iron overload as well as consequences of this iron disorder. In parallel, these models may be useful tools to complement clinical studies for a better comprehension of iron sucrose-related iron overload situation in children. Objects of this study are limited to normal young rats because it is infeasible to carry out iron overload in preterm animals. Thus, further clinical studies may be required to elucidate the role of iron sucrose in the induction of iron overload in preterm infants.
Footnotes
ACKNOWLEDGEMENTS
The authors thank the Picardy Regional Council (Amiens, France) for their financial support in this project and for a doctoral award for BVL. We thank the Biochemistry Laboratory of Amiens University Hospital (Amiens, France) for its collaboration in measuring blood parameters of iron overload. We are also grateful to André Leké (Department of Pediatrics, Amiens University Hospital, Amiens, France) for critical comments on the manuscript.