
Abstract
Catch-up growth (CUG) after food restriction can increase the risks for insulin resistance-related diseases, and to our knowledge, no previous studies have addressed how bone is influenced by CUG when refeeding diet content differs. The objective of this study was to investigate the bone status resulting from CUG induced by varying refeeding dietary patterns, and to assess the potential influencing factors and the effect of resveratrol on bone status during CUG. Experimental rats were randomly divided into five groups: normal chow (NC) group; CUG group (CUG, containing two subgroups, respectively, refeeding with normal chow or high-fat diet); high-fat diet (HF) group; and resveratrol intervention groups (CUGE and HFE). Bone parameters were detected by dual-energy X-ray absorptiometry. Serum concentrations of tumor necrosis factor (TNF)-α, body weight and food intake were also recorded. Our results showed that food restriction induced a significant decrease in bone parameters. Eight-week CUG by normal chow had a greater degree of improvement in bone mineral density than high-fat diet, and even returned to normal level similar to NC. Bone parameters were elevated in varying degrees in the HF group compared with the NC group. In the resveratrol intervention groups, bone parameters significantly increased. Furthermore, bone parameters were inversely related with serum TNF-α concentrations, but showed positive correlation with body weight. In conclusion, the study shows that CUG can partially reverse the deleterious effects of caloric restriction on bone health, especially in the refeeding with normal chow group. Moreover, resveratrol has a protective effect on bone status during the period of CUG. Serum TNF-α levels and body weight also seem to play an important role in regulating bone parameters.
Introduction
Prenatal growth restriction and childhood malnutrition can both reduce bone mineral density (BMD) 1,2 and increase the risk of poor adult bone health and osteoporosis. 3,4 However, catch-up growth (CUG) can correct bone density and content deficits when there is adequate nutritional recovery. 5 Although many current studies focused on CUG have described its high susceptibility to insulin resistance-related diseases, including cardiovascular diseases, hypertension, dyslipidemia or type 2 diabetes, 6,7 very few have been done on the effect of CUG in bone metabolism, especially CUG in adulthood. In contrast to numerous previous studies in growing animals, this study aims to bring new insights on the effect of CUG after food restriction on bone status in adult rats. As diet is a controllable factor, the influence of refeeding with different dietary patterns on bone parameters is worth researching. In addition, increase in body weight is associated with an increased load on bones. We, therefore, postulate that the increase in body weight during CUG is also accompanied by changes in bone status.
It has become an indisputable fact that CUG motivated by under-nutrition can lead to insulin resistance and lipid over-accumulation. 6 It has also been demonstrated that low-grade systemic inflammation occurs in insulin resistance syndrome. 8 Chronic inflammation can cause bone loss 9 and remodeling, 10 leading to osteoporosis. 11 Osteoporosis is an emerging medical and socioeconomic threat characterized by a systemic impairment of bone mass, strength and microarchitecture, which increases the propensity of fragility fractures. 12 Tumor necrosis factor (TNF)-α is an important inflammatory cytokine, and accumulated evidence indicates that anti-TNF therapy may exert beneficial effects on bone metabolism, prevent structural bone damage and increase BMD. 13,14 The measurement of BMD by dual-energy X-ray absorptiometry (DEXA) is a valid method to diagnose osteoporosis and to predict the risk of fracture, 15 and bone densitometry can accurately predict bone status. 16 Therefore, in this study, we determined bone parameters using DEXA and serum TNF-α concentration in each animal group, and explored the relationship between bone status and TNF-α in the CUG model.
Resveratrol naturally occurs in the skin of red grapes, vines, peanuts and root extracts of the weed polygonum cuspidatum 17 and has been attributed to a number of beneficial effects in mammals, including anti-inflammatory, cancer chemopreventive, and cardioprotective and neuroprotective properties. 18 However, Mizutani et al. 19 were the first to report the osteotrophic properties of resveratrol when they showed that resveratrol increased DNA synthesis and alkaline phosphatase activity in osteoblasts in a dose-dependent manner. Thereafter, the bone protective effects of resveratrol have been demonstrated in several osteoporosis models 20,21 and its therapeutic potential for treating osteoporosis is attracting more attention. In this study, we also investigated whether resveratrol could effectively protect bone health in CUG rats.
Therefore, the aims of this study were to observe changes of bone parameters in the experimental groups, compare the effects of CUG with different diets on bone status and the role of resveratrol in CUG rats and finally determine which factor possibly influences bone status the most in the CUG model.
Materials and methods
Animals
Sixty healthy male Sprague–Dawley rats were purchased at six weeks of age, weighing 140–180 g (Center of Experimental Animals, Tongji Medical College, Huazhong University of Science and Technology, Wuhan, China) and acclimatized for one week. The animals were individually housed in stainless steel cages with free access to standard chow pellets and water, under uniform housing in the environmentally controlled conditions (22 ± 2°C, 12-hour light–dark cycle and 55–65% humidity). All the experimental procedures performed were approved by the Animal Ethics Committee of our university and in accordance with Hubei Province Laboratory Animal Care Guidelines for the use of animals in research.
Experimental design
The detailed experimental design
CUG, catch-up growth; NS, 0.9% normal saline intragastric administration; Res, resveratrol intragastric administration; HF, high-fat diet; HFE, HF with resveratrol administrated group; RN, refeeding with normal chow; RH, refeeding with HF; NC, normal chow
Diets
The calorie content of normal chow included 14% fat, 64% carbohydrate and 22% protein (in 100 g: 6.9 g fat, 69.3 g carbohydrate, 23.8 g protein) and was provided by the Laboratory Animal Center of Tongji Medical College mentioned above. The high-fat diet was made as described previously by Chalkley et al., 22 which contained in terms of calories, 59% fat, 20% carbohydrate and 21% protein (in 100 g: 39.00 g fat, 29.75 g carbohydrate, 31.25 g protein).
Experimental procedure
Food intake and body weight of animals were recorded daily. At the end of the four-week experimental period, six animals in each group (NC4, R4 and R4E, total 18 rats) were killed for experimental procedures and the remaining 42 animals were fed according to the different dietary protocols established above until the experiment ended. Assessment of bone parameters using DEXA was carried out as follows: rats were first anesthetized by intraperitoneal injection of pentobarbital (30 mg/kg body weight) and then were placed in a supine position, with both upper and lower extremities extended, and fixed to the examining table (Figure 1). BMD, bone mineral content (BMC) and skeleton area (SA) of the whole-body skeleton (WBS), femur and spine were detected using a bone densitometer adapted to measurement of small animals (Lunar Prodigy Advanced; General Electric Company, Fairfield, CT, USA) (Figure 1). Finally, all animals were killed by decapitation and blood was drawn into a heparinized tube. Blood samples were centrifuged to obtain the supernatant. Total serum TNF-α concentrations were measured with enzyme-linked immunosorbent assays. The commercial kits were purchased from Westang Biotechnology Company (Shanghai, China).
Photograph of bone parameter measurement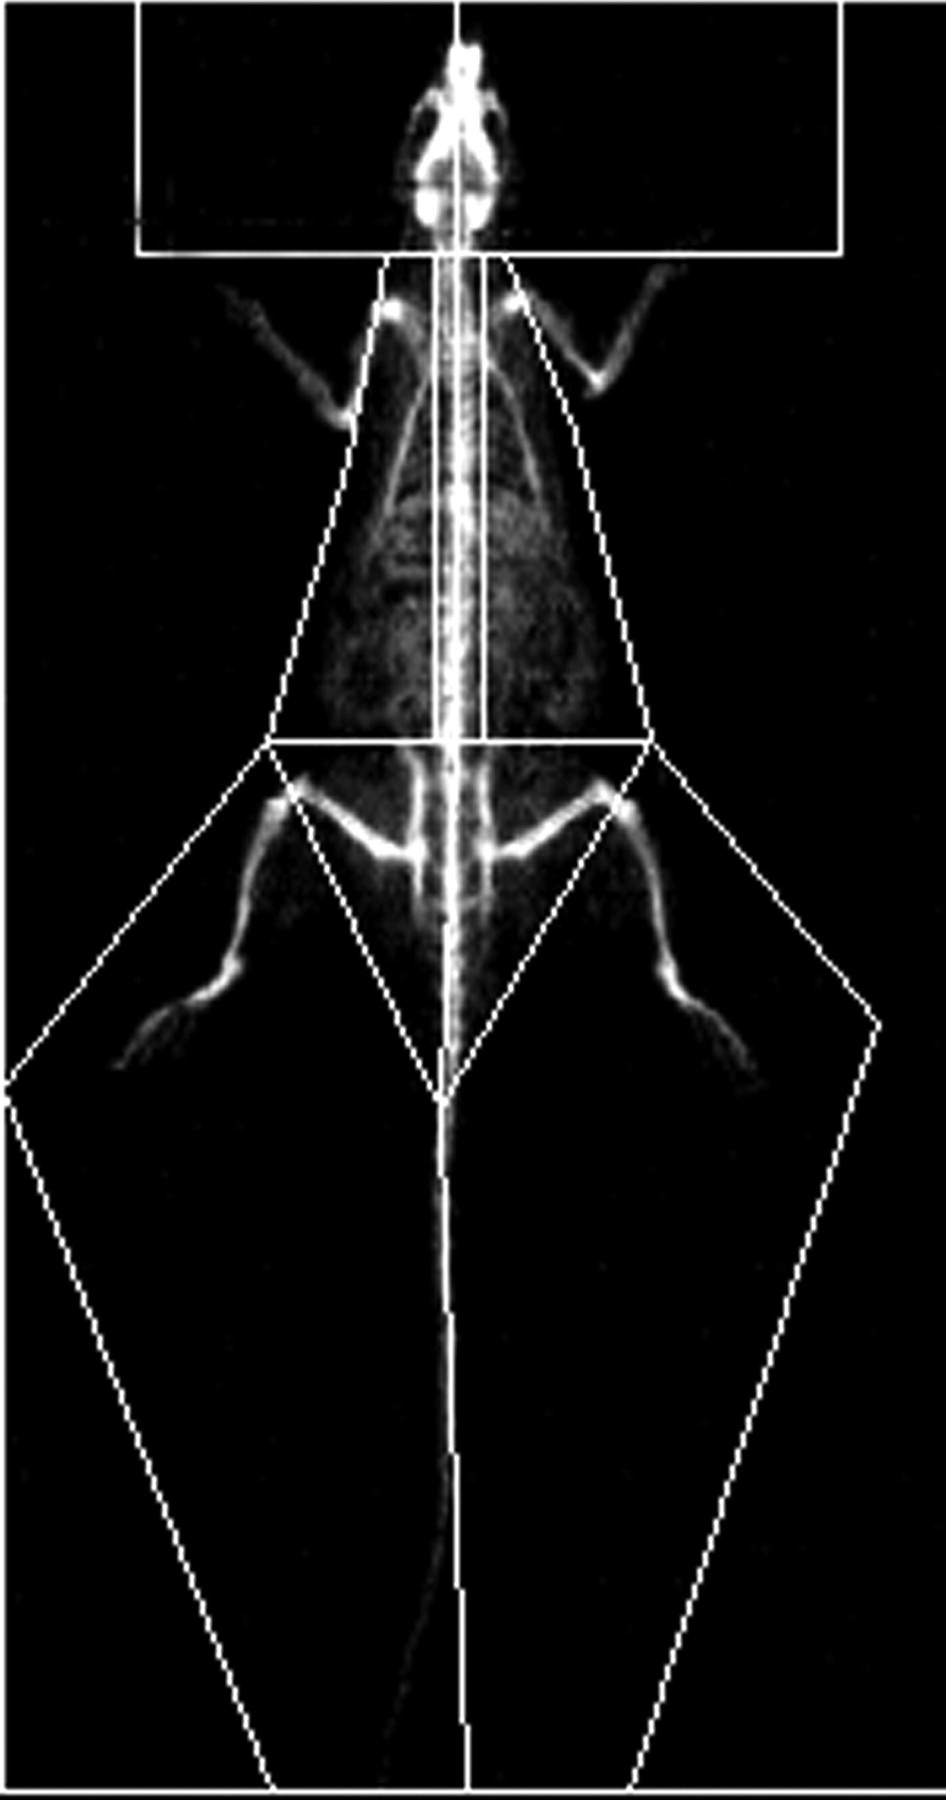
Statistical analysis
All analyses were performed with Statistical Package for Social Sciences version 13.0 (SPSS Inc, Chicago, IL, USA) and results were presented as mean ± SE. Differences of bone parameters among groups were investigated using one-way analysis of variance. Pearson's correlation coefficient and linear regression were used to examine the association between bone parameters and other experimental variables. Statistical significance level was considered at P < 0.05.
Results
Energy intake and body weight
In the CUG group, energy intake was restricted to 60% of their counterpart weight-matched normal chow controls during the food restriction stage. Average food consumption was stable in all groups (Figure 2a). During the four-week diet restriction period, the body weight of rats decreased significantly compared with the NC group. After refeeding, although body weight substantially increased, it was still consistently lower than that of the NC group up to the end of the experiment (refeeding for eight weeks), especially in the RN group. Body weight of rats in the HF group was higher than any other group at the end of 12 weeks (Figure 2b). However, in the resveratrol intervention groups, body weight was significantly lower compared with groups sharing the same baseline conditions (R4E versus R4, CUGE versus CUG, HFE versus HF) (Figure 2c).
Energy intake (a) and body weight in each group (b, c). All values are expressed as mean ± SD.*P < 0.05 versus normal chow (NC) group; #
P < 0.01 versus NC group; †
P < 0.01 versus other groups; ▵
P < 0.01 versus high-fat diet group; §
P < 0.01 versus R4 group; ★
P < 0.05 versus refeeding with normal chow (RN) group; ▴
P < 0.05 versus refeeding with HF (RH) group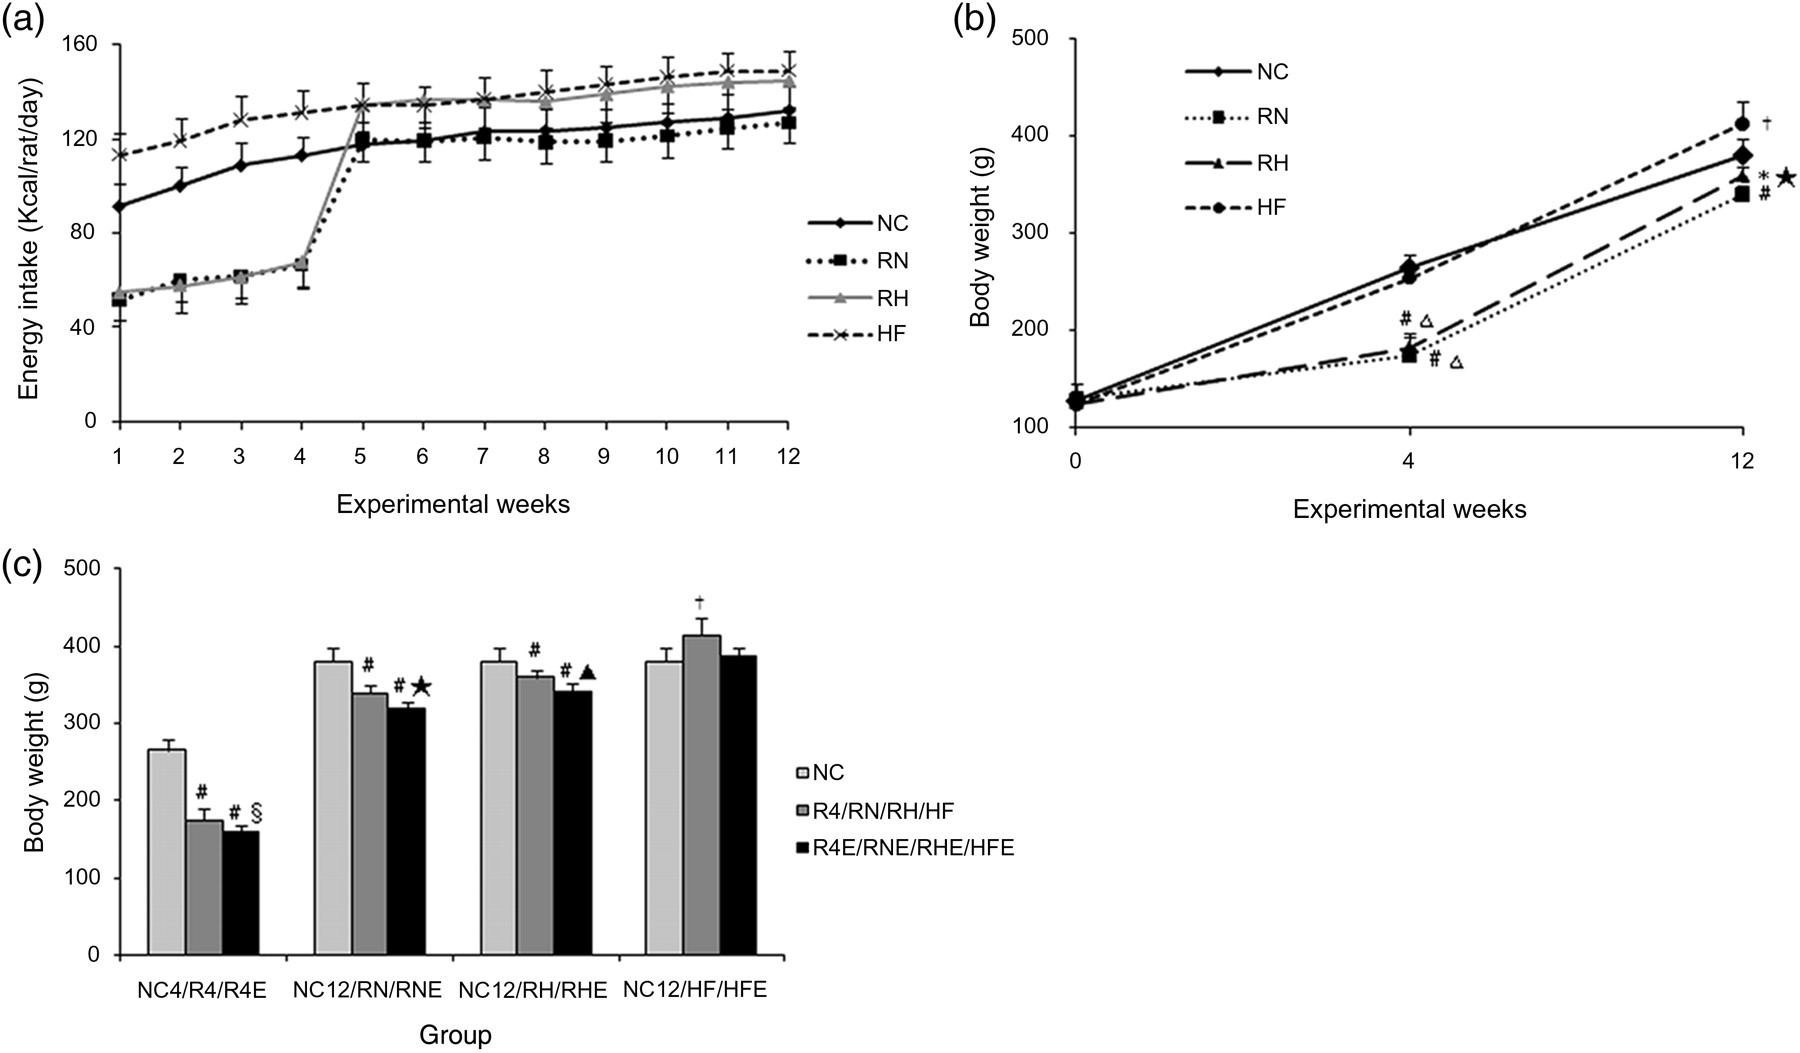
Bone parameters detected by DEXA
Food restriction induced a significant decrease in bone parameters. Compared with the NC4 group, all the parameters decreased in the R4 group, and except for spine SA and WBS BMC and SA, differences in the remaining parameters all reached statistical significance (P < 0.05, Table 2). In the CUG group, bone parameters in the RN group were significantly more enhanced than in the RH group, especially for the WBS parameters. BMD in the RN group virtually recovered to normal levels after refeeding for eight weeks (Figure 3a), whereas BMC and SA were still lower than in the NC group (Figures 3b and c). Bone parameters in the HF group were significantly elevated compared with the NC group (Figures 3a–c). Resveratrol increased the level of bone parameters observed in the CUGE and HFE groups to different degrees, which either matched or exceeded the NC group when the experiment ended (Table 2). However, we also observed that bone parameters in the R4E group decreased compared with the R4 group. BMD in the R4E group decreased significantly compared with the NC4 and R4 groups (P < 0.01, R4E versus NC4; P < 0.05, R4E versus R4; Table 2). Although BMC and SA in the R4E groups were also decreased, the values did not reach statistical significance compared with the R4 group, except for spine SA (Table 2).
Comparison of bone mineral density (BMD) (a), bone mineral content (BMC) (b) and skeleton area (SA) (c) among normal chow (NC)12, refeeding with normal chow (RN), refeeding with high-fat diet (RH) and high-fat diet (HF) groups. *P < 0.05 versus NC group, #
P < 0.01 versus NC group. †
P < 0.05 versus RH group, §
P < 0.01 versus RH group. ▴
P < 0.05 versus HF group, ▵
P < 0.01 versus HF group Comparison of bone parameters between resveratrol-treated groups and non-treatment groups at 4 weeks (a) and 12 weeks (b) BMC, bone mineral content; BMD, bone mineral density; SA, skeleton area; HF, high-fat diet; HFE, HF with resveratrol administrated group; RN, refeeding with normal chow; RH, refeeding with HF; WBS; whole-body skeleton; NC, normal chow All values are expressed as mean ± SD. (a) *P < 0.05 versus NC4; #
P < 0.01 versus NC4; §
P < 0.05 versus R4. (b) *P < 0.05 versus NC12; #
P < 0.01 versus NC12; §
P < 0.05 versus RN; †
P < 0.01 versus RN; ▵
P < 0.05 versus RH; ▴
P < 0.01 versus RH; ☆
P < 0.05 versus HF; ★
P < 0.01 versus HF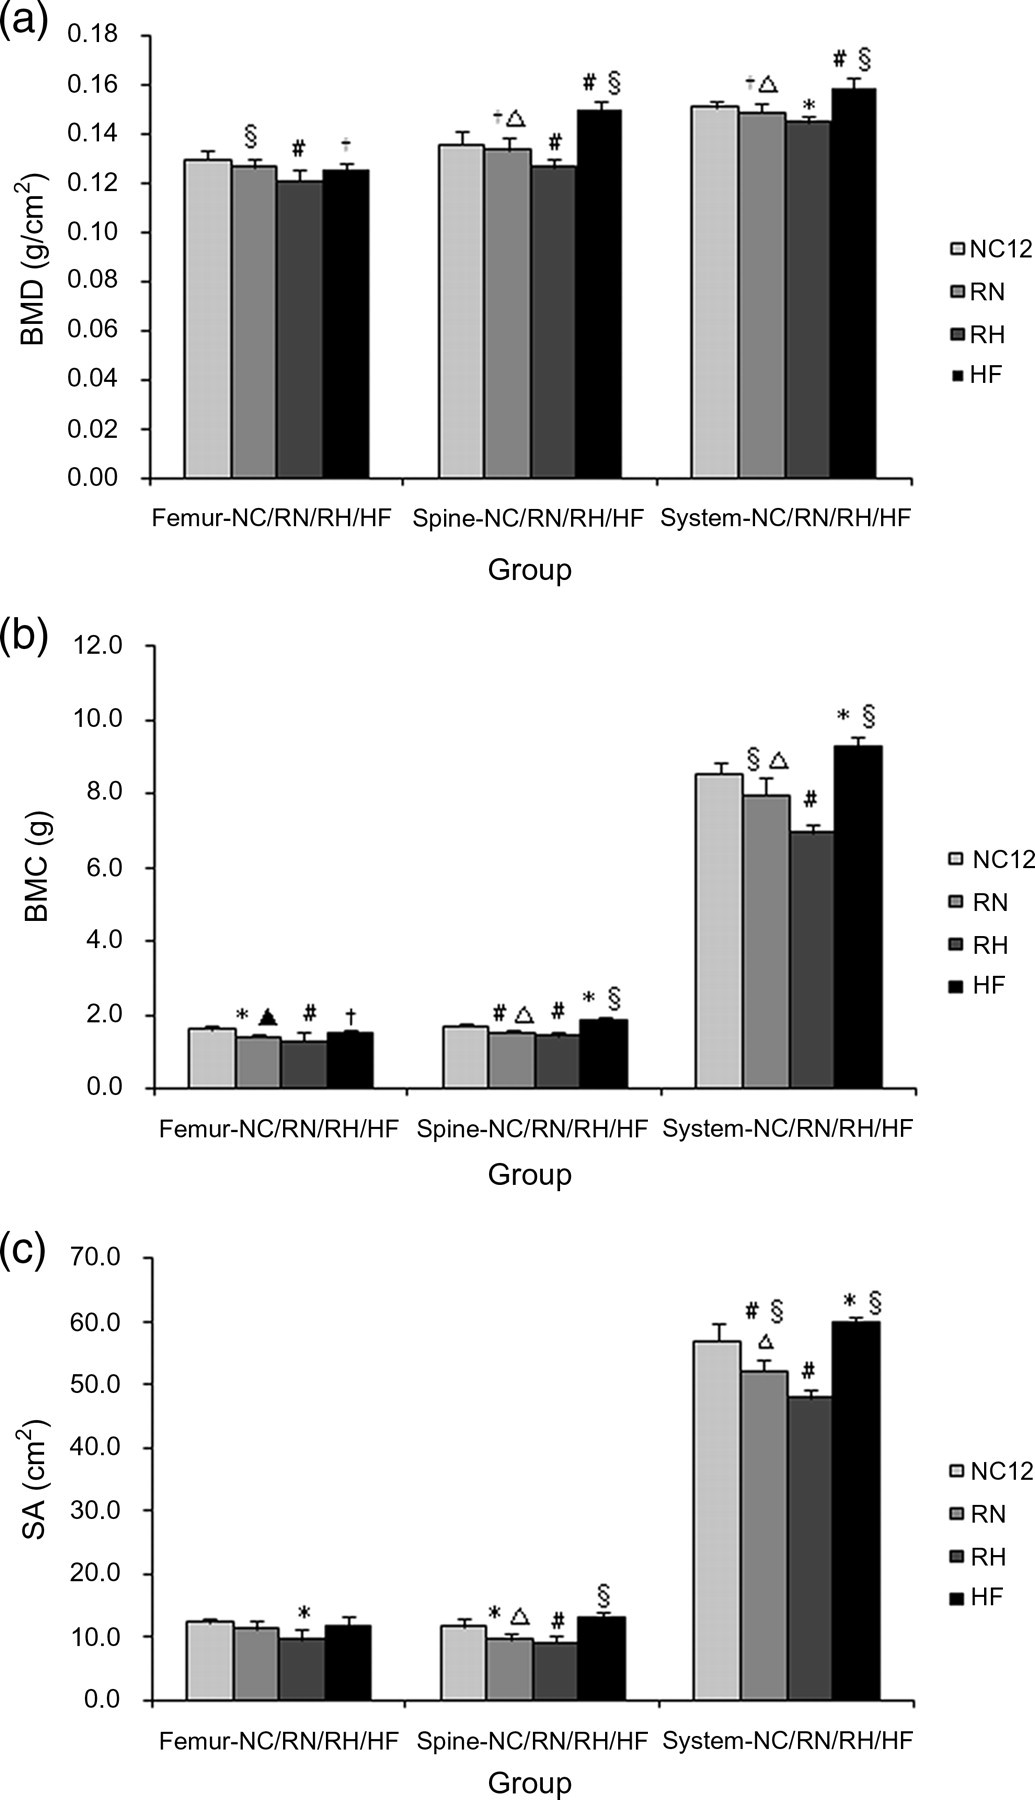
Serum TNF-α levels
The levels of TNF-α almost did not change during the diet restriction period compared with the NC group (Figure 4a), whereas they were markedly increased in the CUG and HF groups (P < 0.01 versus NC group, Figures 4b and c). Although resveratrol inhibited TNF-α synthesis as shown by remarkably lower serum TNF-α levels in the CUGE and HFE groups (CUGE versus CUG group, HFE versus HF group, P < 0.01), they were still higher than the NC group (Figures 4b and c). Among all groups, the levels of TNF-α of the RH group were the highest (Figure 4d).
Serum tumor necrosis factor (TNF)-α levels. Comparisons of serum TNF-α levels at 4 weeks (a) and 12 weeks (b, c, d). #
P < 0.01 versus normal chow (NC) group, ★
P < 0.05 versus refeeding with NC (RN) group, §
P < 0.01 versus refeeding with HF (RH) group, ▵
P < 0.01 versus high-fat diet (HF) group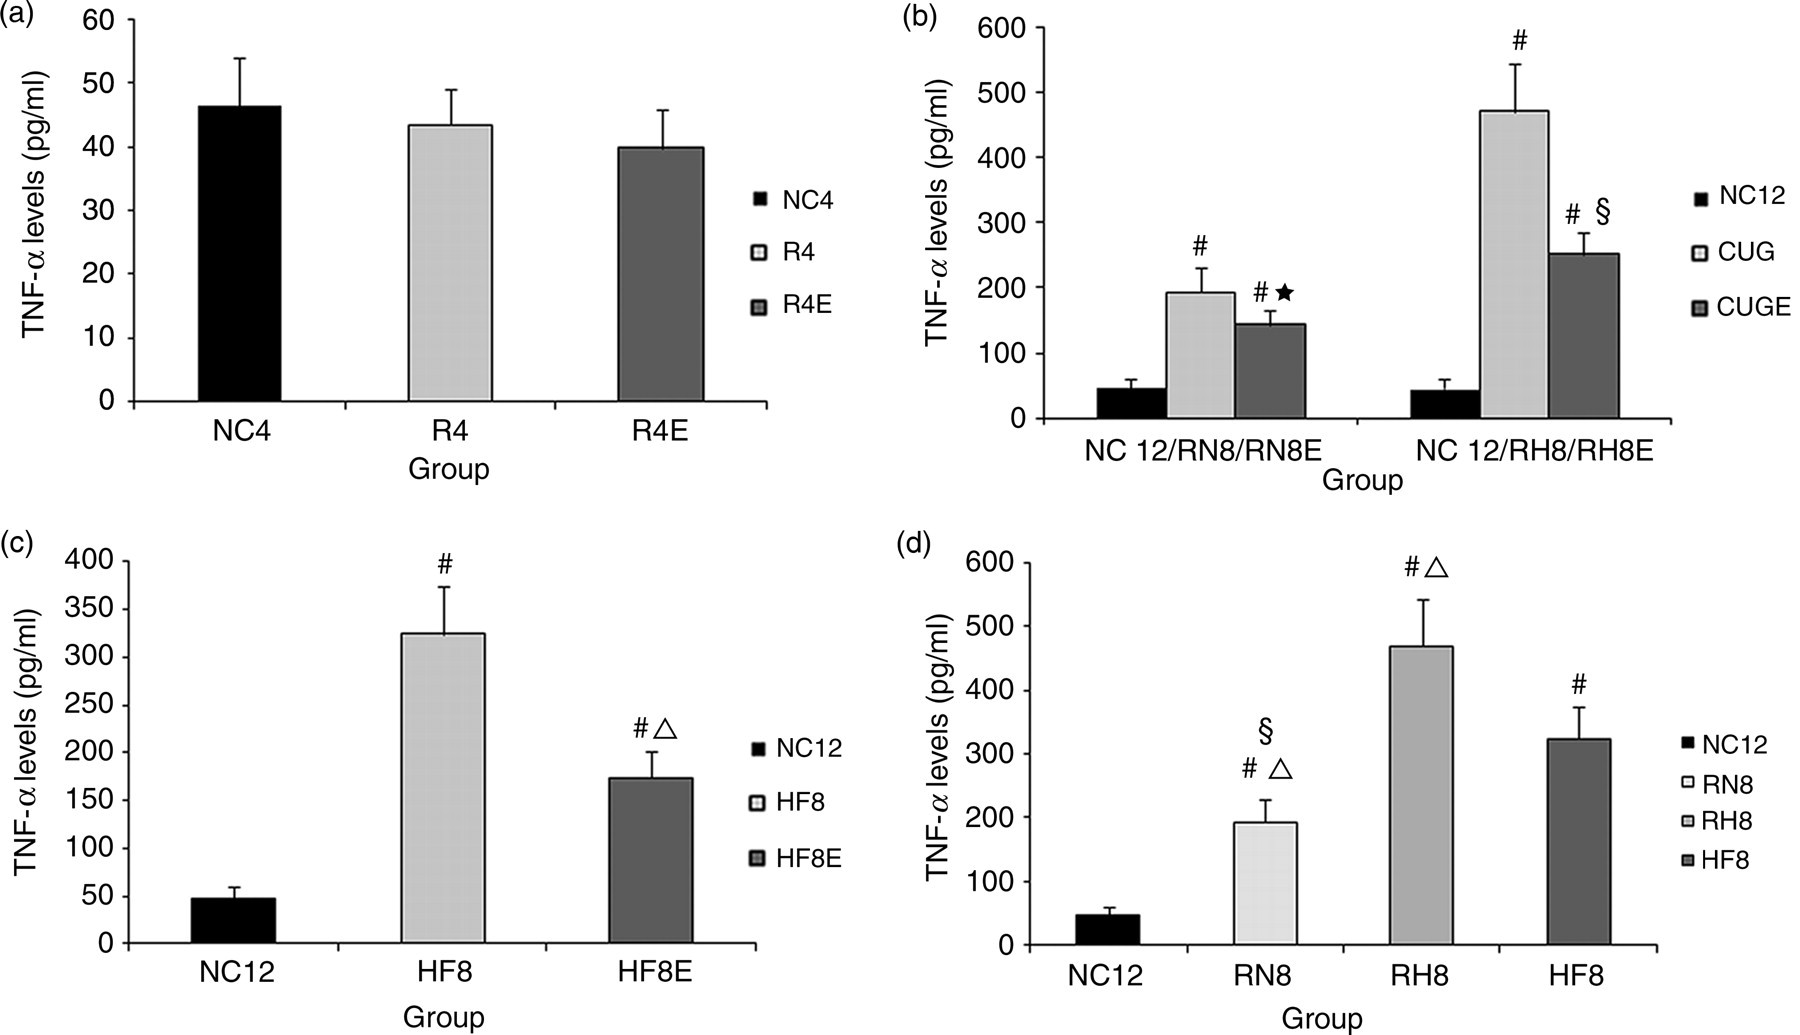
Correlation and regression analysis
To test associations among variables, Pearson's correlations and linear regressions were calculated between WBS BMD and other variables in the five groups. There was an inverse correlation between serum TNF-α levels and WBS BMD (r = −0.378, P < 0.01). In contrast, a positive correlation was found between body weight and WBS BMD (r = 0.276, P < 0.05). In the linear regression analysis (enter), body weight and serum TNF-α levels were both entered as predictors (R
2 = 0.243, P < 0.001, Figure 5a), regression equation: Y = 0.133 + 7.540 × 10⁻⁵ × X
1 − 2.076 × 10⁻⁵ × X
2. A further stepwise regression analysis indicated that TNF-α level was the only independent effect of the potential determinants on the WBS BMD (R
2 = 0.143, P < 0.05, Figure 5b), regression equation: Y = 0.160 − 1.907 × 10⁻⁵ × X
2 (X
1: body weight, X
2: serum TNF-α levels). During the period of diet restriction, Pearson's correlations and linear regressions showed that body weight was the only influencing factor in WBS BMD (r = 0.844, P < 0.001, R
2 = 0.713, P < 0.001, Figure 5c). Correlations also existed in the bone parameters of other parts (femur and spine) but were not analyzed in this study.
Relationship between whole-body skeleton bone mineral density (BMD) and serum tumor necrosis factor (TNF)-α levels (a) and body weight (b) at 12 weeks, relationship between whole-body skeleton BMD and body weight at 4 weeks (c)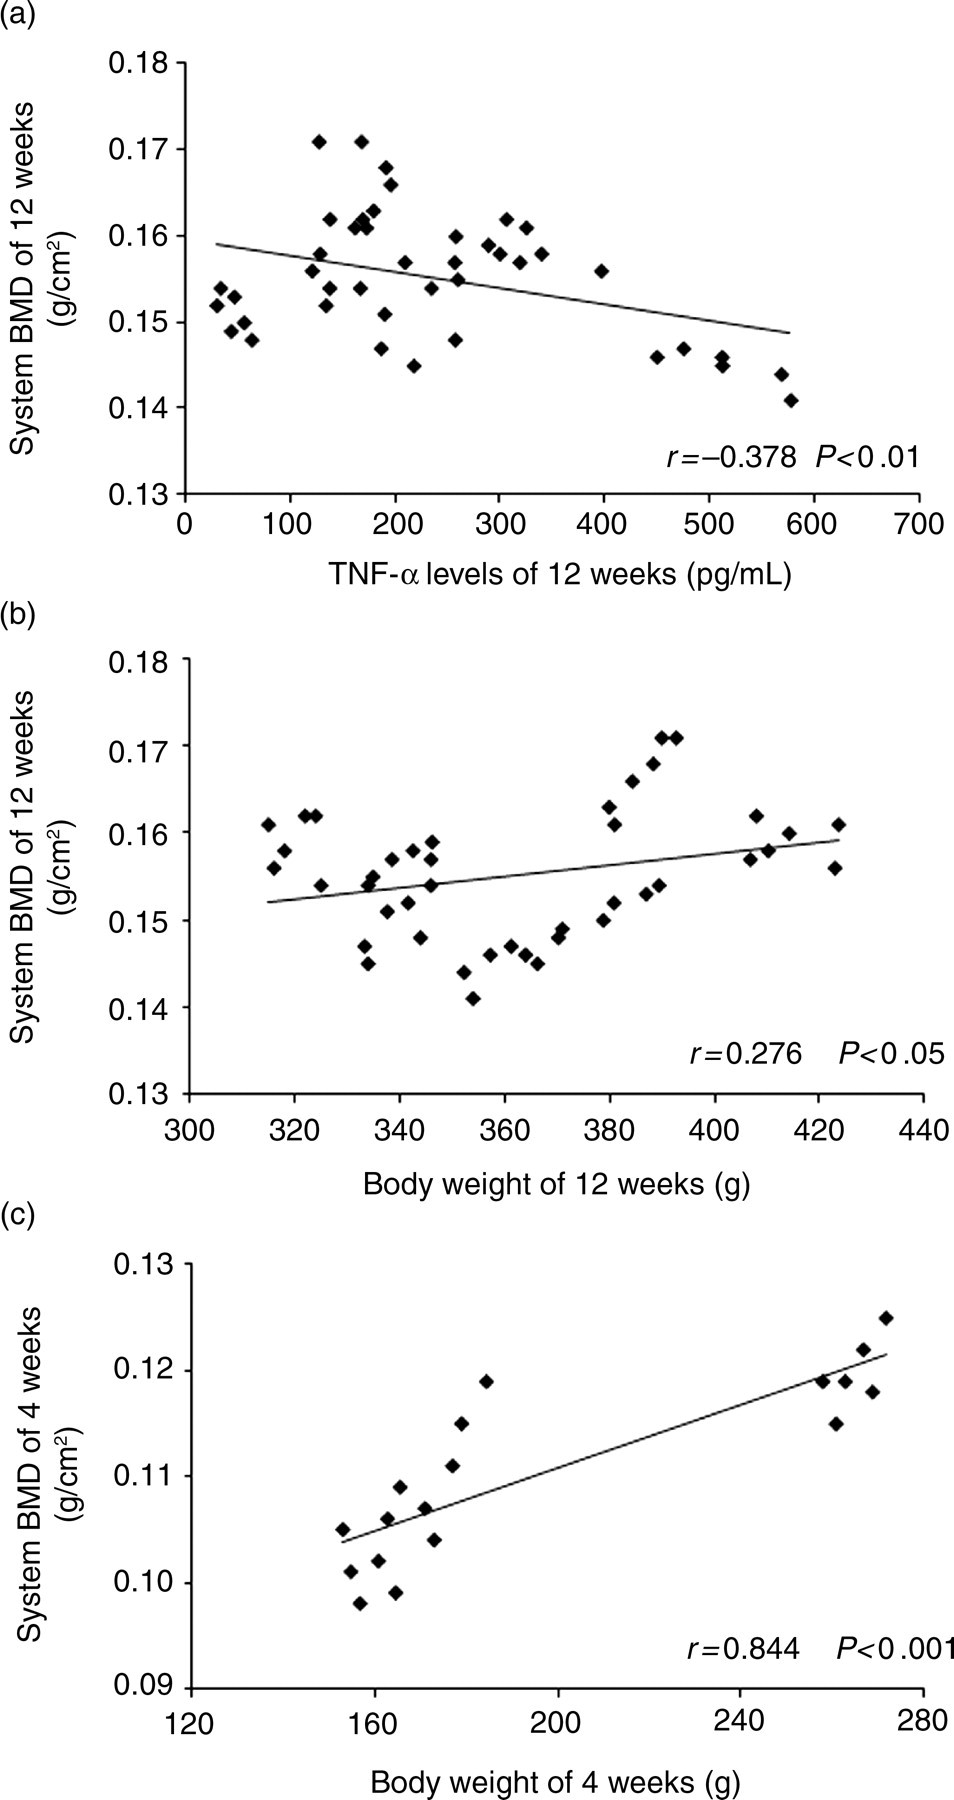
Discussion
Studies have observed that chronic food deprivation can reduce osteoblastic activity and bone formation, and impair bone mineralization and biomechanics. 23,24 In this study, we found that four-week food restriction led to a significant decrease in bone parameters and during the subsequent eight-week refeeding, bone parameters in the RN group were enhanced significantly compared with the RH group, especially with respect to BMD, which almost returned to normal levels. In contrast, other research found that refeeding for two years normalized bone formation activity in adolescent anorexia nervosa patients, but BMD was still significantly lower than that of controls. 25 Compared with neural anorexia, we thought the degree of impairment by four-week diet restriction on bone metabolism was relatively weaker, so that BMD returned to normal level after refeeding.
In this study, we noted that the TNF-α concentration in each group demonstrated an inverse tendency with bone parameters. Moreover, resveratrol administration significantly decreased the levels of TNF-α. TNF-α is part of a superfamily of cytokines with well-characterized roles in cell survival, differentiation, apoptosis and inflammatory responses. 26 Inflammation has been identified as a potential risk factor for osteoporosis, with proinflammatory cytokines IL-6 and TNF-α being important mediators of bone resorption. 27 Therefore, a significant increase of TNF-α levels may partially explain the decreased BMD in the RH group compared with the RN group. Anti-inflammatory effects of resveratrol have been proven by many studies 28,29 and resveratrol can significantly suppress TNF-α synthesis in vitro. 30 Previous studies have also indicated that TNF-α blockers might prevent structural bone damage. 13,14 Our study provides further evidence for the inhibitory role of resveratrol on TNF-α, thus preventing the decrease in BMD during CUG.
In this study, we also assessed the impact of body weight on bone status. During caloric restriction, the decline in body weight was accompanied by a parallel decrease in BMD. After refeeding, increased body weight significantly increased bone parameters. The association between body weight and BMD is not surprising. One study showed that a distance runner diagnosed with osteoporosis had an increase in body mass index from 15.8 to 21.3 kg/m2, and correspondingly, her BMD reached normal values. 31 Hence, body weight also plays an important role in the mediation of BMD, and is thus a good predictor of bone status.
To better distinguish the effects of CUG and high-fat diet on bone status in the RH group, we set up a matching HF group. Results showed that bone parameters in the HF group were markedly higher than either the NC or the RH groups. The higher serum TNF-α level in the RH group along with a lower body weight could explain the decline in bone parameters compared with the HF group. However, TNF-α level and body weight in the HF group were significantly higher compared with the NC group and nonetheless BMD was still higher in the HF group. Although obesity has been believed to protect the skeleton, several recently published studies have highlighted a negative association between high-fat diet-induced obesity and either bone density or quality. 32,33 In this study, it should be noted that the body weight in the HF group was only 11.17% higher than the NC group, as opposed to other studies on high-fat diet induced obesity models, 34,35 in which the increase in body weight was more than 20.6%, even 36.3%. This may be due to the shorter experimental period compared with other studies or the poor taste of the high-fat diet so that the daily intake was less than it should have been. We can therefore consider our HF rats to be simply overweight and not obese, so that there were no deleterious consequences on bone status. Rather, the gradually increasing body weight reflected an adaptation of skeletal remodeling to loading, stimulated osteogenesis 36 and increased bone parameters in the HF group. Another limitation to our high-fat diet model is the possibility that other cytokines in addition to TNF-α could have been involved.
In this study, we found that bone parameters of resveratrol intervention groups were significantly increased compared with their respective control groups. Resveratrol is one of the most potent Sirt-1 activators and co-immunoprecipitation experiments demonstrate that Sirt-1 and Cbfa-1 proteins associate in vitro. 20 Cbfa-1 is the earliest and most specific marker of osteogenesis. It acts as an activator of transcription and can induce osteoblast-specific gene expression in fibroblasts and myoblasts in culture. 37 Sirt-1 seems to deacetylate Cbfa-1 and contribute to the maintenance of the osteoblast phenotype by direct regulation of Cbfa-1. 20 In our study, although we did not measure Cbfa-1 levels, we can postulate that resveratrol treatment induced the formation of Sirt-1-Cbfa-1 complexes, thereby stimulating the proliferation and differentiation of osteoblasts. 20 Resveratrol also activates AMPK independent of SIRT1. 38 However, the role of AMPK in bone metabolism and osteoblast differentiation is unclear. 39 Possibly AMPK affects osteoblast function by modulating the Wnt/β-catenin signaling pathway. 39
Nevertheless, it is to be noted that food-restricted rats that were administered resveratrol had significant decreases in BMD in this study. We speculated several plausible explanations for this inconsistency. First, the essential materials needed for bone formation were scanty due to diet restriction so that osteoblastic activity was inhibited. Second, the relatively serious food deprivation (40% reduction of food intake) activated energy conserving mechanisms, with energy being preferentially redistributed toward critical organs to ensure basic metabolic activities of life. Thus, the protective role of resveratrol on bone in caloric restriction group could not be exerted, but once the supply of nutrition was adequate, as in the CUG and HF groups, this protective effect was revealed.
Interestingly, body weight of resveratrol intervention groups was lower compared with their respective controls. The weight-reducing effects of resveratrol may be due to its effects on adipocytes, as it increases lipolysis and reduces lipogenesis, contributing to reduced lipid accumulation in vitro. 40 Animal studies have reported caloric restriction mimetic effects for resveratrol resulting in weight reduction and improvement of life span of animals fed with a high-caloric diet. 41 Furthermore, our results show that although resveratrol-fed rats had reduced body weight, the BMD was increased. This seemingly contradictory finding can be explained by the fact that resveratrol helped offset the adverse effects of body weight loss on bone metabolism. Given that the beneficial effect of weight gain on bone density is associated with increased risk of obesity, therapies focused on increasing bone formation and bone size but inhibiting excessive weight gain are worthy of further evaluation.
Conclusion
In conclusion, this study has shown that firstly, caloric restriction can impair bone mineralization and this side-effect can be partially reversed after a period of CUG. Refeeding with various dietary patterns produces different degrees of recovery of bone parameters. Secondly, resveratrol has a protective effect on BMD during the period of CUG, but the exertion of this protective role depends on sufficient nutrition supply. Thirdly, serum TNF-α levels and body weight are both significant correlations with bone parameters, which are the main influencing factors in BMD. Last, resveratrol has anti-inflammatory effects, increases bone formation but inhibits excessive weight gain. This can be used as a template for synthesizing new drugs, providing a large potential for treatment of overweight and osteoporosis groups. Further research is required to elucidate the detailed mechanisms involved.
Footnotes
ACKNOWLEDGEMENTS
This work was supported by the Nature Science Foundation of China (No. 30771035, 81170782). The authors thank Dr Juan Zheng and Xiang Hu for generous advice.