
Abstract
Dyslipidemia caused by ‘Western-diet pattern’ is a strong risk factor for the onset of diabetes. This study aimed to disclose the relationship between the serum metabolite changes induced by habitual intake of high-fat and high-cholesterol (HFHC) diet and the development of impaired glucose tolerance (IGT) and insulin resistance through animal models of Macaca mulatta. Sixteen M. mulatta (six months old) were fed a control diet or a HFHC diet for 18 months. The diet effect on serum metabolic profiles was investigated by longitudinal research. Islet function was assessed by intravenous glucose tolerance and hyperinsulinemic-euglycemic clamp test. Metabonomics were determined by 1 H proton nuclear magnetic resonance spectroscopy. Prolonged diet-dependent hyperlipidemia facilitated visceral fat accumulation in liver and skeletal muscle and disorder of glucose homeostasis in juvenile monkeys. Glucose disappearance rate (KGlu) and insulin response to the glucose challenge effects in HFHC monkeys were significantly lower than in control monkeys. Otherwise, serum trimethylamine-N-oxide (TMAO), lactate and leucine/isoleucine were significantly higher in HFHC monkeys. Sphingomyelin and choline were the most positively correlated with KGlu (R2 = 0.778), as well as negative correlation (R2 = 0.64) with total cholesterol. The HFHC diet induced visceral fat, abnormal lipid metabolism and IGT prior to weight gain and body fat content increase in juvenile monkeys. We suggest that increased serum metabolites, such as TMAO, lactate, branched-chain amino acids and decreased sphingomyelin and choline, may serve as possible predictors for the evaluation of IGT and insulin resistance risks in the prediabetic state.
Introduction
Type II diabetes mellitus (T2DM) as a chronic, non-communicable disease shows notably increasing prevalence worldwide, with over 220 million people currently affected. 1 The number of adults with diabetes will increase by 69% between 2010 and 2030 in developing countries. 2 The growth of the incidence of diabetes is largely attributed to changes in lifestyle (such as an unhealthy diet) which lead to obesity becoming common in young people. 3 Childhood obesity is becoming a health problem because it may persist into young adulthood. The prevalence of childhood obesity has increased from approximately 2% to an estimate of 10% over the past decade in the USA and Western Europe. 4 Circumstances such as food consumption patterns in early childhood predispose a child to disorders such as obesity, dysglycemia and metabolic syndrome (MetS). 5 Pediatric MetS is strongly associated with adult MetS and T2DM. Dietary fat increases the risk of T2DM in US men; moreover, this ‘Western-diet pattern’ has a linear correlation with the risk of cardiovascular disease and the development of diabetes.6,7 Early detection of children at high risk followed by lifestyle intervention is crucial to stop the progression of pediatric MetS and may be helpful to reduce the morbidity of cardiovascular disease and T2DM in adulthood. 8
Animal researches have demonstrated that the intake of a high-saturated-fat diet appears to be deleterious to glucose and lipid metabolism.9,10 As the closest phylogenetic relatives to humans, the non-human primate closely resembles humans with respect to fatty acid absorption and metabolism, 11 and Macaca mulatta is a species with a very sensitive response to exogenous cholesterol. 11 The experimental outcomes would be more likely than experiments in rodents to extrapolate to predict human outcomes.12–14 Previously, most animal researches focused on the pre-diabetes state in adults to evaluate risk factors of obesity or T2DM in the short-term.9,15,16 Studies on the progression from an early age are rare. During this developmental period, the underlying mechanism of how dietary fat and cholesterol induce metabolic profile changes and further affect insulin sensitivity and secretion remains to be explored. In the present study, we fed juvenile M. mulatta with long-term, high-fat and high-cholesterol (HFHC) diets to mimic the whole development process of childhood obesity and employed a longitudinal study for metabolic parameters to screen circulating serum predictors that were sensitive to insulin resistance and impaired glucose tolerance (IGT). We hypothesized that long-term observation of an HFHC diet throughout childhood would yield differences from a short-term study in adults, and significant serum metabolite abnormalities may serve as early predictors of IGT.
Materials and methods
Animals
Sixteen six-month-old juvenile M. mulatta (rhesus monkeys, eight male and eight female) were obtained from Ping'an Animal Breeding Center in Chengdu, China, housed in clean primate facilities, had access to food and water ad libitum, and received seasonal fruit and vegetables daily. The monkeys were randomly assigned to two groups: control animals (n = 8, half were female) were fed a basal monkey diet (control monkeys, monkey chow; Animal Research Center, Sichuan Academy of Medical Sciences, Chengdu, Sichuan, China); experimental animals (n = 8, half were male) were fed a high-fat and high cholesterol diet (HFHC monkeys) consisting of 2% crystalline cholesterol and 20% lard (w/w). A weighed amount of food was offered to each animal twice a day. All procedures in this study were in compliance with the Animal Welfare Act and the Guide for Care and Use of Laboratory Animals. The experimental treatment of animals were reviewed and approved by the Animal Care & Welfare Committee of West China Hospital, Sichuan University.
Experimental protocol
Monkeys were sedated at study initiation and termination (ketamine hydrochloride, 10 mg/kg body weight, intramuscularly) for collection of blood samples, biopsy and some examinations. Blood samples (3 mL) were collected from all monkeys by femoral venipuncture after fasting 12–16 h overnight monthly. Blood was drawn into vacuum tubes containing ethylenediaminetetraacetic acid or serum-separating gel. Plasma or serum was separated and stored at -80°C until assayed. Fasting plasma glucose (FPG), fasting plasma insulin (FPI), blood chemistry and serum lipids were analyzed. Body weights were recorded monthly. Glycosylated hemoglobin (HbA1c) was tested every three months. After dietary treatment for 12 and 18 months, metabolomic analysis of whole serum and extracted lipids from serum was performed by 1H nuclear magnetic resonance (NMR) spectroscopy. Intravenous glucose tolerance testing (IVGTT) and hyperinsulinemic-euglycemic clamp (HEC) test were performed at 18 months. Additionally, body composition was determined by use of dual energy X-ray absorptiometry scanning (DEXA) with a Lunar iDXA scanner (GE Healthcare, Madison, WI, USA).
Assay techniques
Biochemical analyses
Conventional serum biochemical analysis was performed using a Roche Biochemistry Autoanalyzer (Cobas Integra 400 Plus; Roche Diagnostics, Basel, Switzerland) with commercial kits. FPI and free fatty acids (FFA) were detected by an electrochemiluminescence method using a Roche Modular E-170 Autoanalyzer with corresponding reagents. HbA1c was examined by an automated glycated hemoglobin analyzer (H2-HLC-G8; Toso Bioscience, Tokyo, Japan) combined with ion chromatography. Lipoprotein lipase (LPL) was measured with commercial enzyme-linked immunosorbent assay kits (Suolaibao Bio-technology Co. Ltd, Shanghai, China). The homeostatic model assessment of insulin resistance (HOMA-IR) was calculated by the following formula: fasting insulin (in microunits per milliliter) × fasting glucose (in millimoles per liter)/22.5. 17
IVGTT
After a consistent 16-h overnight fasting, monkeys were anesthetized and blood samples were obtained from a catheter inserted into a peripheral vein. Subsequently, a 50% dextrose solution (0.5 mL/kg) was administered over a 30-s period, and blood samples were drawn at 1, 3, 5, 7, 10, 15, 20, 30, 40, 50 and 60 min from a contralateral vein. Patency of the sampling catheter was maintained by intermittent infusion of heparinized saline. Plasma glucose was determined using a portable glucose analyzer (Roche Instruments, Basel, Switzerland) or the glucose oxidase method, and plasma insulin concentrations were determined by electrochemiluminescence (Roche Modular E-170 Autoanalyzer). The glucose disappearance rate (KGlu) was calculated using the formulas previously reported for monkeys. The insulin area under the curve (AUC-ins) during the IVGTT was calculated using the trapezoid rule.
HEC
Insulin sensitivity was measured using a HEC as described previously. After an overnight fast, monkeys were sedated and catheters were placed in both ulnar veins for 20% D-glucose and insulin infusion and for arterialization blood collection, respectively. Briefly, a 10-min priming infusion (60 μIU/m2/min) was followed by a constant infusion of 40 μIU/m2/min for 110 min. Glucose was infused at a variable rate to maintain consistent glucose levels as determined by glucose sampling and analysis at five-minute intervals (portable glucose analyzer; Roche). The mean plasma glucose was maintained at 4.4-4.7mmol/L over the 60-120 min period (mean coeffecient of variation, 4.6%). The steady-state glucose infusion rate was calculated between 80 and 120 min. The mean parameter values during the steady-state period for each individual clamp study were used to calculate SIClamp (defined as M/ΔI corrected for fat-free mass [kg], where M is the steady-state glucose infusion rate [mg/min] and ΔI is the difference between basal and steady-state plasma insulin concentrations [μIU/mL]).
DEXA scanning
Monkeys were anesthetized as described previously, and were placed on the scanner bed (Lunar; GE Healthcare). The procedure was performed according to Whole Body Analysis Protocol of Animals using the Lunar software package, which calculates the absolute mass of each tissue in relation to body weight of the scanned individual.
Biopsy and Oil Red O staining
Monkeys were anesthetized and subjected to a liver biopsy guided by B-ultrasound and a left soleus muscle surgical biopsy (size 0.5 × 0.5 cm2). Two tissue specimens were taken from each source: one was fixed in 4% formaldehyde/phosphate-buffered saline for more than 12 h for hematoxylin-eosin (HE) staining; the other specimen was cryosectioned for Oil Red O staining. Specimens were washed twice with distilled phosphate buffer solution, incubated for 30 min in Oil Red O stain solution, and rinsed twice with distilled water. Stained specimens were mounted in glycerol. Images were captured using a Leica dissecting microscope (Leica Microsystems, Wetzlar, Germany) and processed using Leica QWin.
NMR spectroscopy
Serum samples were thawed and centrifuged (4°C, 5000 × g, 10 min) to remove any precipitate. Two different methods for the preparation of NMR samples (serum sample and extraction of serum lipids) were performed as previously described. 20 The serum lipids were re-dissolved in 500 μL of deuterated chloroform (CDCl3) which contained 0.03% (w/v) tetramethylsilane for chemical shift reference (0 ppm). All NMR spectra were measured at 300 K on a Bruker Avance II 600 Spectrometer (Bruker Biospin, Rheinstetten, Germany), operating at 600.13 MHz with a 5-mm PATXI probe. The spectra of serum were obtained by a watersuppressed Carr-Purcell-Meiboom-Gill (CPMG) pulse sequence. The spectra of serum lipids were recorded with the following parameters: pulse angle of 90° RF, repetition time of 5.5 s, accumulation time of three minutes and suppressed methanol signal at 4.65 ppm. The metabolites in NMR spectra were identified according to their characteristic chemical shifts and multiplicities reference of databases in special software and literatures.21-24
Data reducing and multivariate data analysis
The NMR spectra were manually phased and baseline corrected, and then binned into contiguous segments of equal width (0.04 ppm) using the MestReC software (version 4.9.9.9; Mestrelab Research S.L., Santiago de Compostela, Spain). The regions of 4.6–5.2 ppm in serum were excluded to eliminate the influence of residual water resonances. The regions around 3.5 ppm in serum lipid spectra were removed due to residual methanol signals. The remaining spectral segments in each NMR spectrum were normalized to the total sum of the spectral intensity to partially compensate for differences of sample concentration. The normalized integral values were subjected to the multivariate analysis by using the SIMCA-P software (version 11.5; Umetrics, Umea?, Sweden). In this analysis, all spectral data were mean-centered and pareto scaling was applied. The partial least-squares discriminant analysis (PLS-DA) was applied to find a model that separates classes of observations based on their X variables. The PLS-DA model was validated by a permutation method with describing R2Y and Q2Y values. The values of variable importance in the projection (VIP) and Pearson correlation coefficient (pCorr) were calculated in this model. If an X variable with a VIP value larger than 1 (VIP>1), combined with an absolute value of pCorr larger than 0.7 (|pCorr| >0.7), it was considered to be a significantly changed metabolite related to different groups.
Statistical analysis
All data are presented as the mean ± SD. Variation between the groups was compared by analysis of variance (ANOVA) or Kruskal–Wallis test depending on variable distribution. Relationships between variables were assessed by Spearman rank correlation. Multiple linear regression analysis was used to assess the independence of relationships after log-transformation to normalize distributions. All statistical analyses were conducted with SPSS software (version 13.5; SPSS Inc., Chicago, IL, USA), and a value of P < 0.05 was considered significant.
Results
Basal parameters, body weight and histological examination
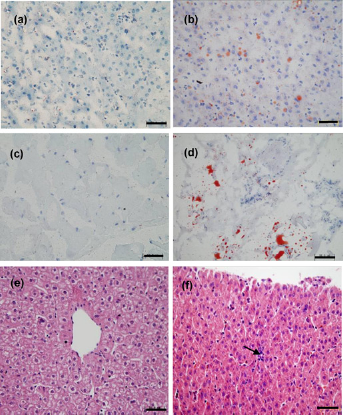
The background characteristics of the monkeys used in the present study are shown in Table 1. The weight gain tendency of HFHC monkeys was obviously lower than that of control monkeys, especially in the first six months. The weight of HFHC monkeys increased 0.98%, which was significantly less than the control, 1.35% (P < 0.001) (Figure 1a). The total body fat contents were not significantly different between control and HFHC monkeys (HFHC versus control: 10.53% versus 12.3%) (Figure 1b). During the HFHC diet period, the monkeys did not display any obvious abnormalities in serum biochemical markers, which reflect liver and renal function (Figure 1c). However, biopsy results showed accumulation of lipid droplets in the liver and skeletal muscle (Figures 2a–d) as well as slight disarrangement and local inflammatory cell infiltration in hepatocytes (Figures 2e and f).
Variations of body weight, total body fat content and general serum parameters at different times in high-fat and high-cholesterol diet (HFHCD) and control monkeys: (a) trends in body weight gain; (b) whole-body fat content at 18 months; (c) general serum biochemical markers reflecting liver and kidney functions. Triangles represent the control group, while squares represent the HFHCD group. Data are presented as mean ± SD. *** HFHCD versus control: P < 0.001. Solid bars are control monkeys and white bars are HFHCD monkeys. ALT, alanine transaminase; AST, aspartate aminotransferase; BUN, blood urea nitrogen; Cr, creatinine Biopsy of the liver and skeletal muscle after high-fat and high-cholesterol (HFHC) diet treatment 18 months. (a–d) Oil red O staining of tissue biopsy: (a) liver of control, (b) liver of HFHC diet, (c) skeletal muscle of control, (d) skeletal skeletal muscle of HFHC diet; (e–f) hematoxylin– eosin staining: (e) liver of control; and (f) liver of HFHC diet, the black arrow shows local leukocyte inflammatory infiltration. (A color version of this figure is available in the online journal)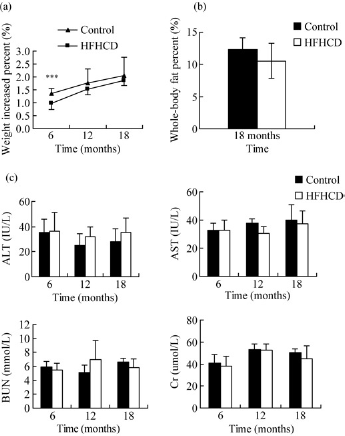
General physiological parameters of monkeys
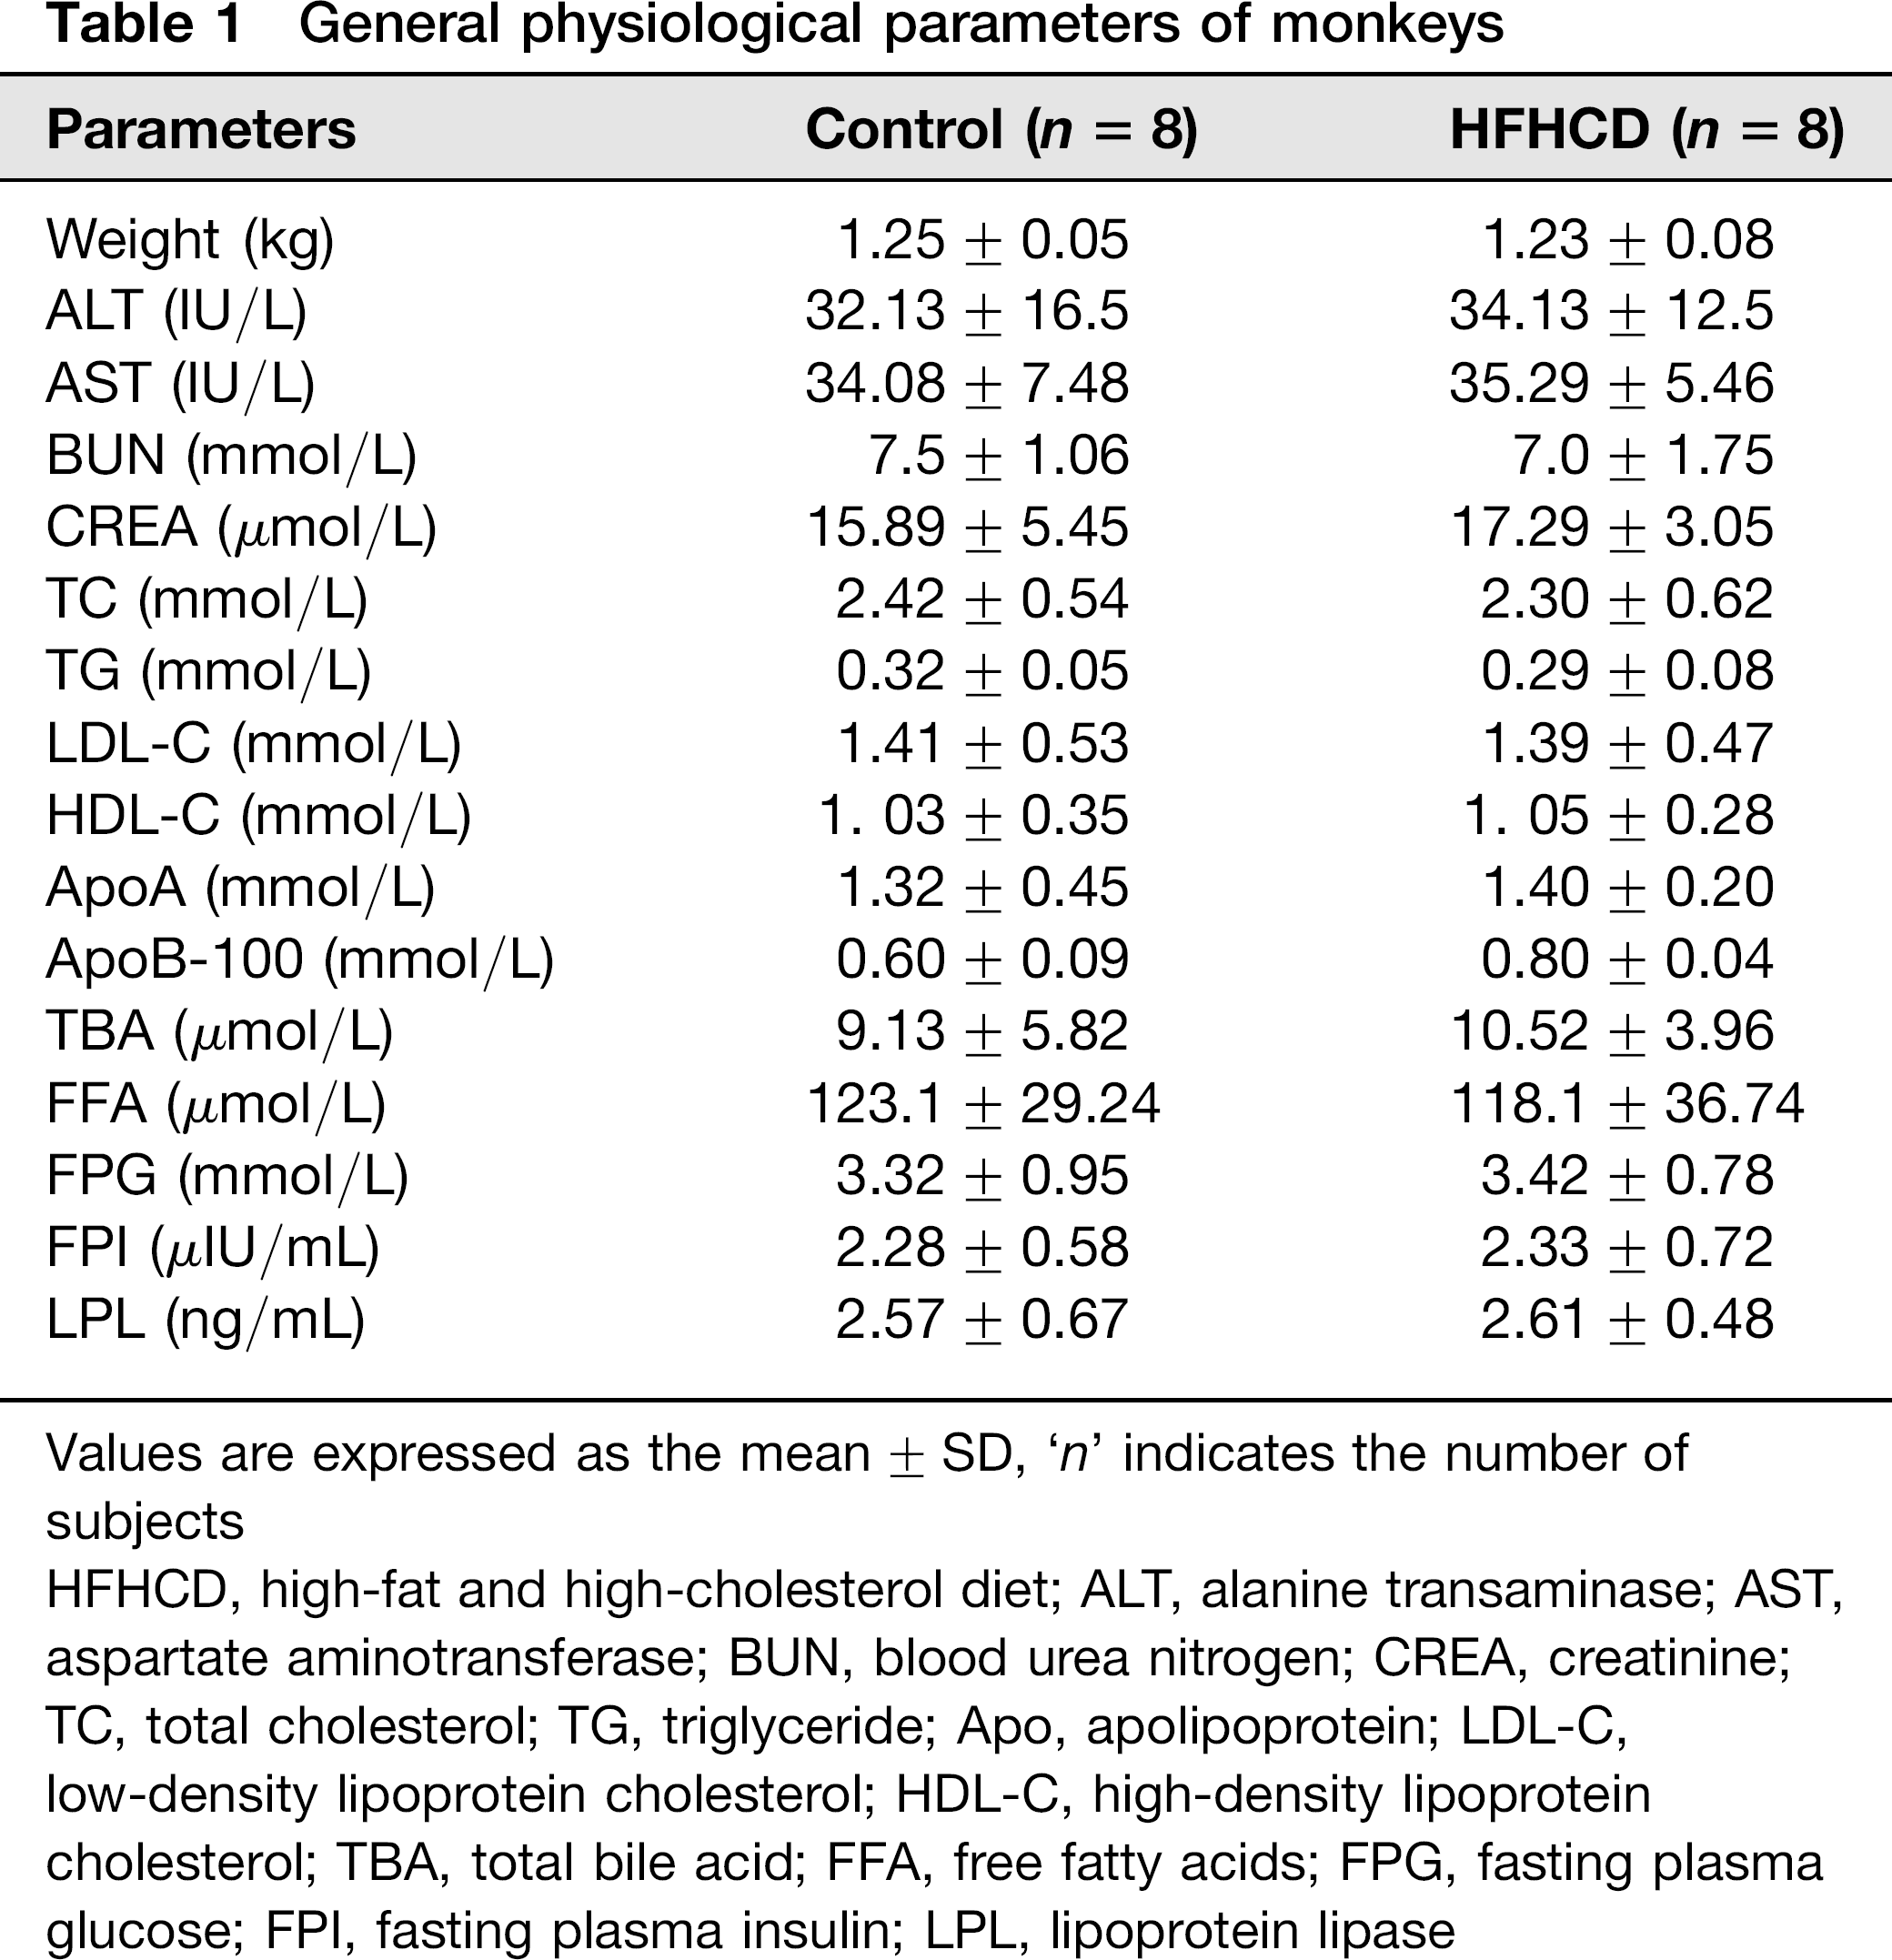
Values are expressed as the mean ± SD, ‘n’ indicates the number of subjects
HFHCD, high-fat and high-cholesterol diet; ALT, alanine transaminase; AST, aspartate aminotransferase; BUN, blood urea nitrogen; CREA, creatinine; TC, total cholesterol; TG, triglyceride; Apo, apolipoprotein; LDL-C, low-density lipoprotein cholesterol; HDL-C, high-density lipoprotein cholesterol; TBA, total bile acid; FFA, free fatty acids; FPG, fasting plasma glucose; FPI, fasting plasma insulin; LPL, lipoprotein lipase
Serum lipids
The HFHC diet significantly impacted serum lipids, whereas the serum lipids of the control group remained at general level during the experimental period. The mean serum total cholesterol (TC) of HFHC monkeys significantly increased to almost four times the general level in six months (HFHC diet versus control, 8.98 ± 3.30 versus 2.79 ± 0.90 mmol/L, P < 0.001) (Figure 3a). TG of HFHC monkeys was significantly higher than that of control monkeys throughout the experiment period in particular at 12 months (6 versus 12 months, 0.94 ± 0.43 versus 1.15 ± 0.69 mmol/L); although the difference between two groups was no longer evident by 18 months (Figure 3b). Serum low-density lipoprotein cholesterol (LDL-C) showed changes in parallel with TC (P < 0.01) (Figure 3c). ApoB-100 showed a gradual upward trend in monkeys on the HFHC diet (baseline versus 18 months, P < 0.01) (Figure 3d). In addition, high-density lipoprotein cholesterol (HLD-C) significantly increased from the general parameter (1.03 ± 0.35–2.24 ± 0.75 mmol/L) in six months (P < 0.001) (Figure 3e). Serum triglyceride (TG) and ApoA showed a consistent trend that increased to a peak at 12 months followed by a decrease between 12 and 18 months (Figure 3f). Serum FFA and LPL concentrations of HFHC monkeys were notably higher than control monkeys in the identical time (control versus HFHC at 6 months: FFA 119.1 ± 35.74 versus 1010.78 ± 289.83 μmol/ L; LPL 2.68 ± 0.47 versus 8.83 ± 1.28 ng/mL; P < 0.01) and displayed a declining trend from six months to 18 months (HFHC monkeys: FFA 6 versus 12 months, P < 0.05; LPL 6 versus 12 versus 18 months, P < 0.001). The HFHC diet increased serum total bile acid (TBA) although without significant difference compare with the control diet (HFHC versus control, P = 0.06) (Figures 3g–i).
Changes in serum lipid metabolism parameters of high-fat and high-cholesterol diet (HFHCD) and control monkeys: (a) serum TC, (b) serum TG, (c) serum LDL, (d) serum ApoB-100, (e) serum HDL, (f) serum ApoA, (g) serum TBA, (h) serum FFA and (i) serum LPL. Triangles represent the control group, while squares represent the HFHC group. Solid bars are control monkeys and white bars are HFHC monkeys. All values represent mean ± SD. HFHCD versus control: ***P < 0.001, **P < 0.01, *P < 0.05; #6 versus 12 months P < 0.05. TC, total cholesterol; TG, triglyceride; LDL-C, low-density lipoprotein cholesterol; HDL-C, high-density lipoprotein cholesterol; Apo, apolipoprotein; TBA, total bile acids; FFA, free fatty acids; LPL, lipoprotein lipase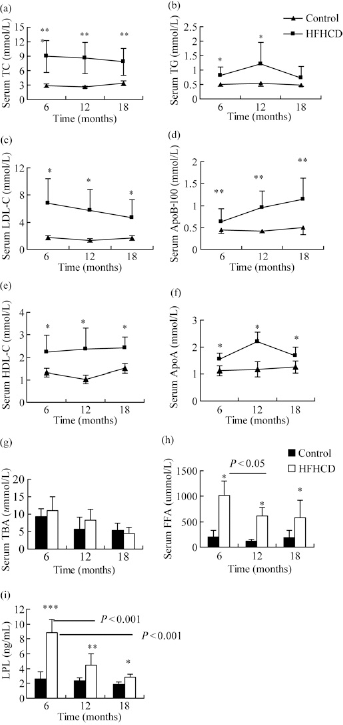
Glucose homeostasis
There was no significant effect of diet on fasting glucose levels in the first six months of HFHC diet (HFHC versus control, P = 0.408). After feeding for six months, FPG of HFHC monkeys gradually increased and reached 6.14 ± 1.95 mmol/L in 18 months, whereas the control monkeys maintained a constant state, 4.4±0.34 mmol/L (HFHC versus control, P < 0.05) (Figure 4a). FPI progressively increased in HFHC monkeys more than in control monkeys, which increased from a basal level of 2.23±0.48 to 4.13 ± 1.87, 7.07 ± 03.26 and 10.32 ± 5.0 μIU/mL in six, 12 and 18 months, respectively (HFHC versus control, P < 0.05) (Figure 4b). HbA1c concentrations in HFHC monkeys were higher than in control monkeys at 12 and 18 months (P < 0.01) (Figure 4c). Following a glucose challenge, HFHC monkeys showed a significant decrease in glucose disappearance rate (KGlu) and insulin response (AUC) relative to the control monkeys (P < 0.001) (Figure 4d and Table 2). During a HEC test, the glucose concentration was maintained at 4.4 ± 0.25 mmol/L, and the average serum insulin concentration was 145 ± 42.59 μIU/mL (Figure 4e). M value and SIclamp decreased, whereas HOMA-IR increased in HFHC monkeys compared with controls; however, no significant differences were observed in these parameters (HFHC versus control, M: P = 1.000; SI: P = 0.333; HOMA: P = 0.225) (Table 2).
Comparisons of changes in serum glucose metabolism parameters between high-fat and high-cholesterol diet (HFHCD) and control monkeys at different times: (a) variation of fasting plasma glucose (FPG); (b) variation of fasting plasma insulin (FPI); (c) levels of glycosylated hemoglobin A1 (HbA1c) at 12 and 18 months; (d) summary of blood glucose level during intravenous glucose tolerance testing at 18 months; (e) summary of steady-state plasma glucose and insulin level during hyperinsulinemic-euglycemic clamp (HEC) in HFHCD monkeys at 18 months. Triangles represent control group, while squares represent HFHCD group (a, b, d); the black bar represents control group while the white bar represents HFHCD group (c); and rhombuses represent blood insulin concentration, while squares represent blood glucose concentration (e). All values are presented as mean ± SD. HFHCD versus control: **P < 0.01, *P < 0.05; #6 versus 12 months in HFHCD group P < 0.05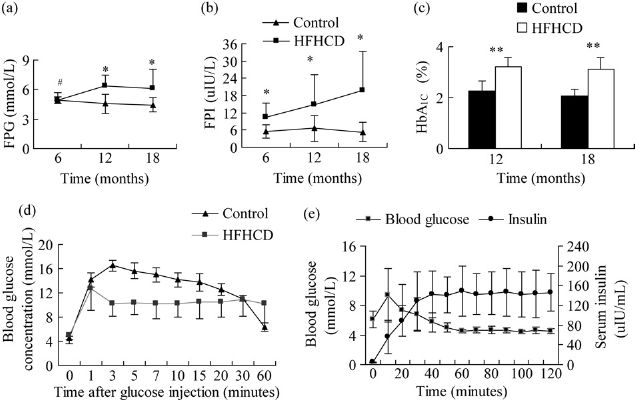
Mean values of glucose metabolic variables at 18 months in monkeys (mean ± SD)
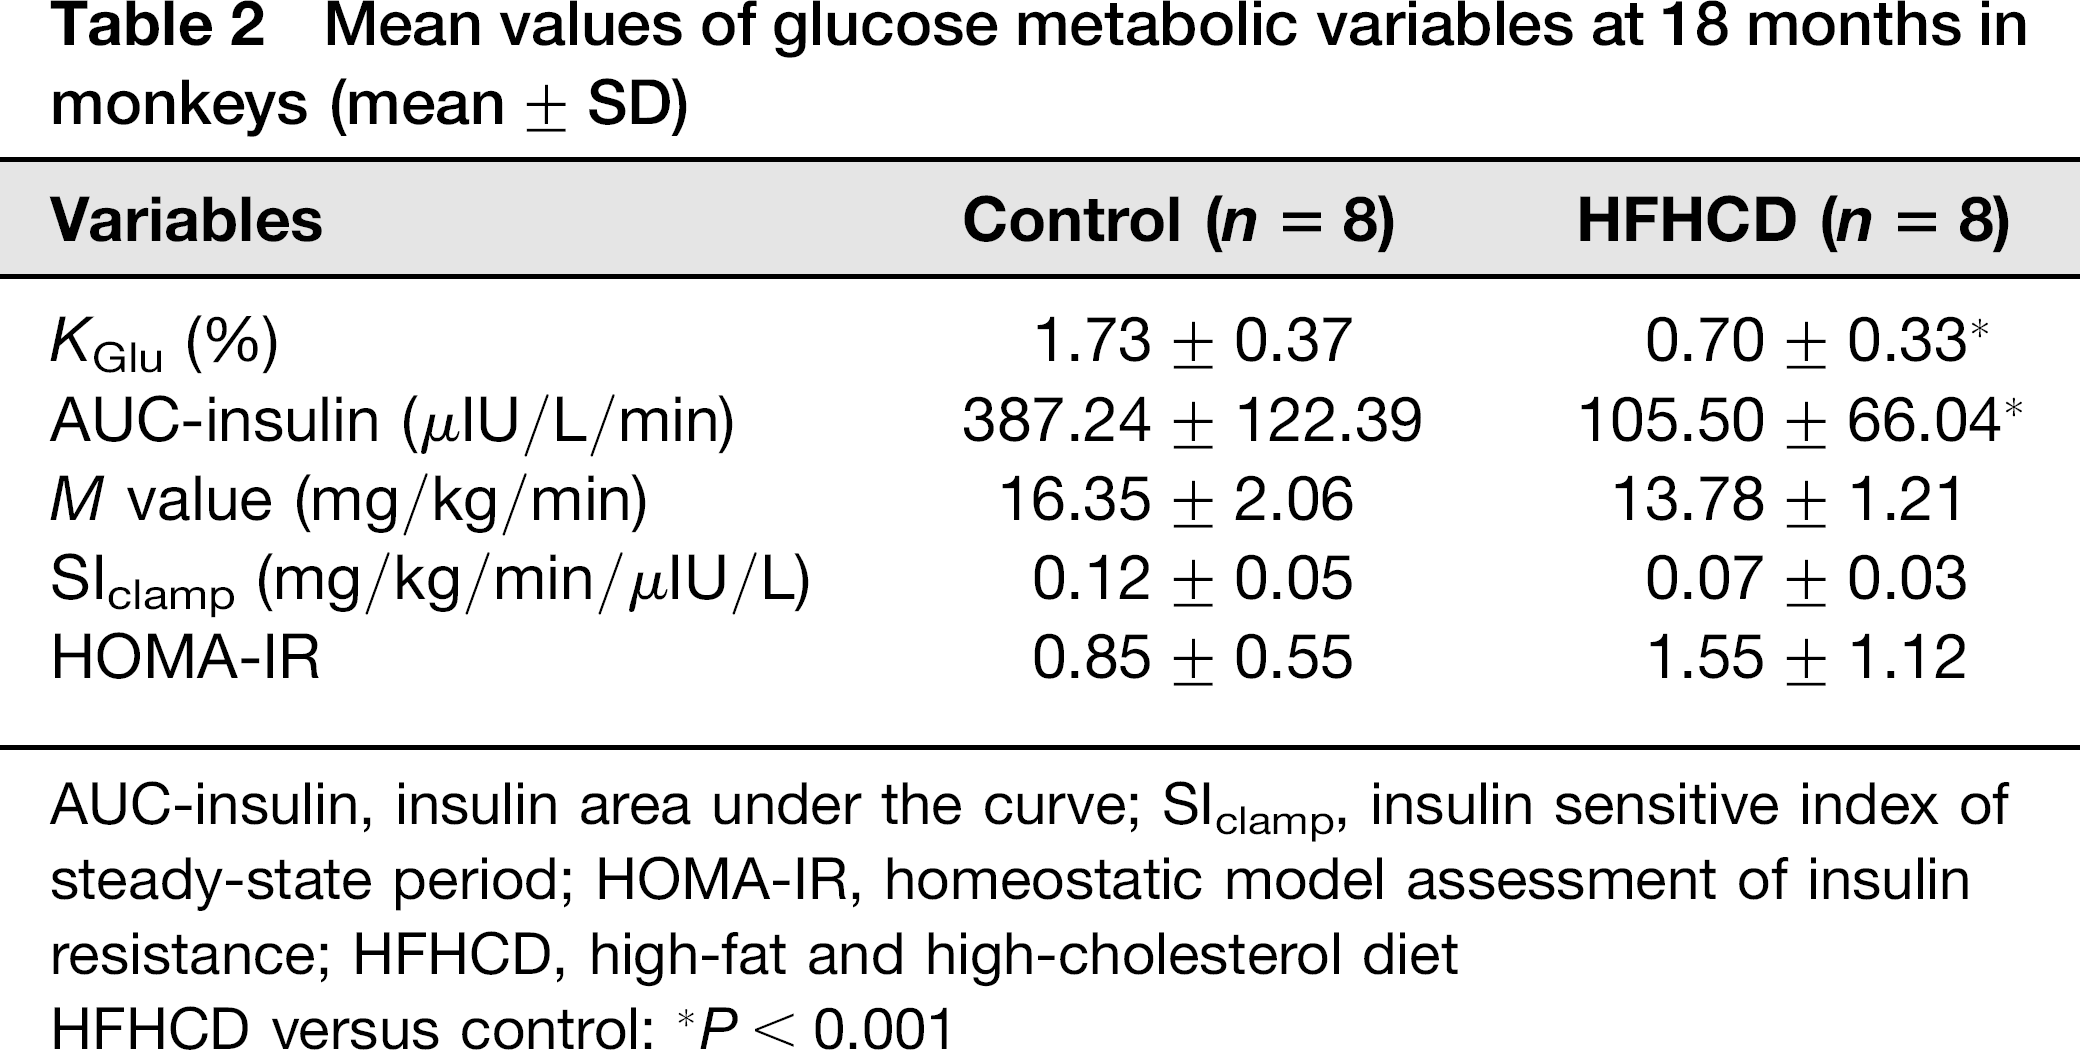
AUC-insulin, insulin area under the curve; SIclamp, insulin sensitive index of steady-state period; HOMA-IR, homeostatic model assessment of insulin resistance; HFHCD, high-fat and high-cholesterol diet
HFHCD versus control: *P < 0.001
Metabolomic analysis
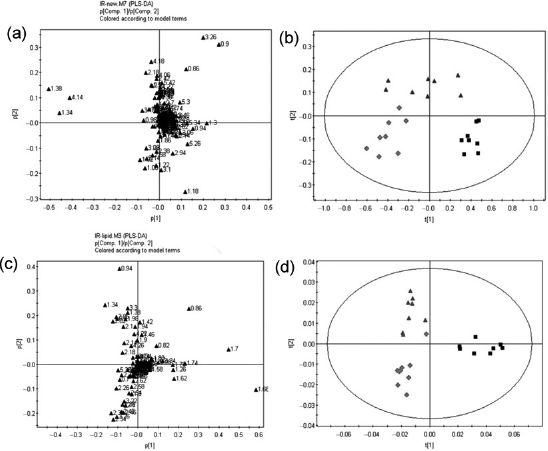
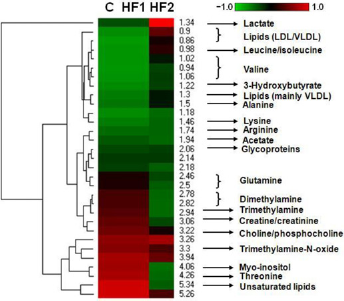
The typical 1H NMR spectra of serum and lipids are shown in Figure 5. The spectra were further binned and subjected to PLS-DA analysis. The loading plot of serum and lipid is shown in Figures 6a and c, respectively, while the scores plot revealed distinct separation of metabolites in serum (Figure 6b) and lipids (Figure 6d) between different groups. In order to illustrate the differences of metabolites, ANOVA and multiple regression analysis were subsequently performed. These significantly different metabolites are summarized in Tables 3 and 4 and relationships of relative importance of serum metabolites were visualized by hierarchical clustering (Figure 7). During the HFHC diet period, metabolite levels were different in different times. For instance, significant increases were observed in very-low-density lipoprotein (VLDL), leucine/ isoleucine, valine, lipoproteins, acetate, dimethylamine, trimethylamine-N-oxide (TMAO)/taurine and unsaturated lipids at 12 months, whereas only variations of acetate, trimethylamine, TMAO/taurine and myo-inositol reached statistical significance at 18 months. Multiple regression analysis showed that the HFHC diet had a significant effect on serum levels of TMAO, lactate and leucine/isoleucine (R2 = 0.456–0.65). With an extension of hyperlipidemia, TMAO expressed a downward trend and lactate and leucine/isoleucine increased. TMAO and lactate showed strong correlation (R2 = 20.783, P = 0.00897). Serum lipid components were also affected by the HFHC diet, including significant elevation in the levels of TC, total TG, fatty acids of varying carbon chain length, sphingomyelin and choline, esterified cholesterol, phosphatidylcholine, glycerol-phospholipid, glycerol, saturated and monounsatu-rated fatty acids. Pearson correlation analysis demonstrated that sphingomyelin and choline were the most positively correlated with KGlu (R2 = 0.778, P = 0.015), as well as negative correlation (R2 = 0.64) with TC. A longer-term HFHC diet resulted in significant and persistent increases in TC (P = 0.02), whereas sphingomyelin and choline displayed a decreasing trend compared with controls (P = 0.001).
1H NMR spectra of serum and lipids obtained from rhesus monkeys in the control (a), high-fat and high-cholesterol (HFHC) diet for 12 months (b) and HFHC diet for 18 months (c), respectively. TMAO, trimethylamine-N-oxide; VLDL, very-low-density lipoprotein; LDL, low-density lipoprotein; 3-HB, 3-hydroxy-butyrate; CHOL/CHOLest, cholesterol/cholesteryl ester; PC, phosphatidylcholine; Sm, sphingomyelin; TC, total cholesterol (A color version of this figure is available in the online journal) Two-dimensional partial least-squares discriminant analysis (PLS-DA) score plot characterization of the serum and lipid metabolic changes induced by diet. (a) Loading plot of PLS-DA from the serum; (b) PLS-DA score plot of spectral data from serum; (c) loading plot of PLS-DA from lipid; (d) PLS-DA score plot of spectral data from lipid. In PLS-DA score plot, black squares represent basal diet, red rhombuses represent 12-month high-fat and high-cholesterol (HFHC) diet, purple triangles represent 18-month HFHC diet, respectively. n = 8 monkeys per group. (A color version of this figure is available in the online journal) The changes of serum metabolites were analyzed by hierarchical clustering with Pearson correlation distance, rows describing metabolites and columns describing different groups. C: control; HF1: HFHC diet fed for 12 months; HF2: HFHC diet fed for 18 months. HFHC, high-fat and high-cholesterol. (A color version of this figure is available in the online journal)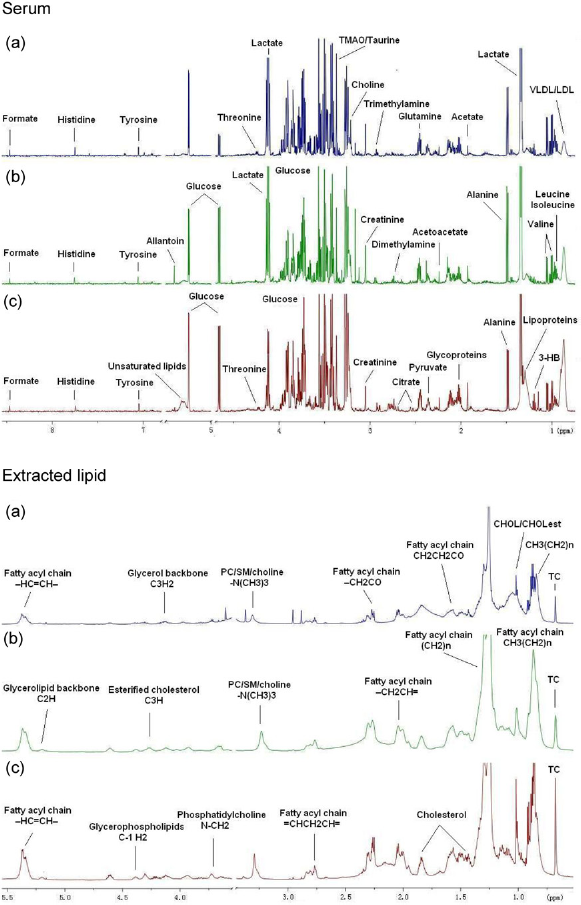
Summary of metabolic differences in the serum of HFHCD-fed rhesus monkeys
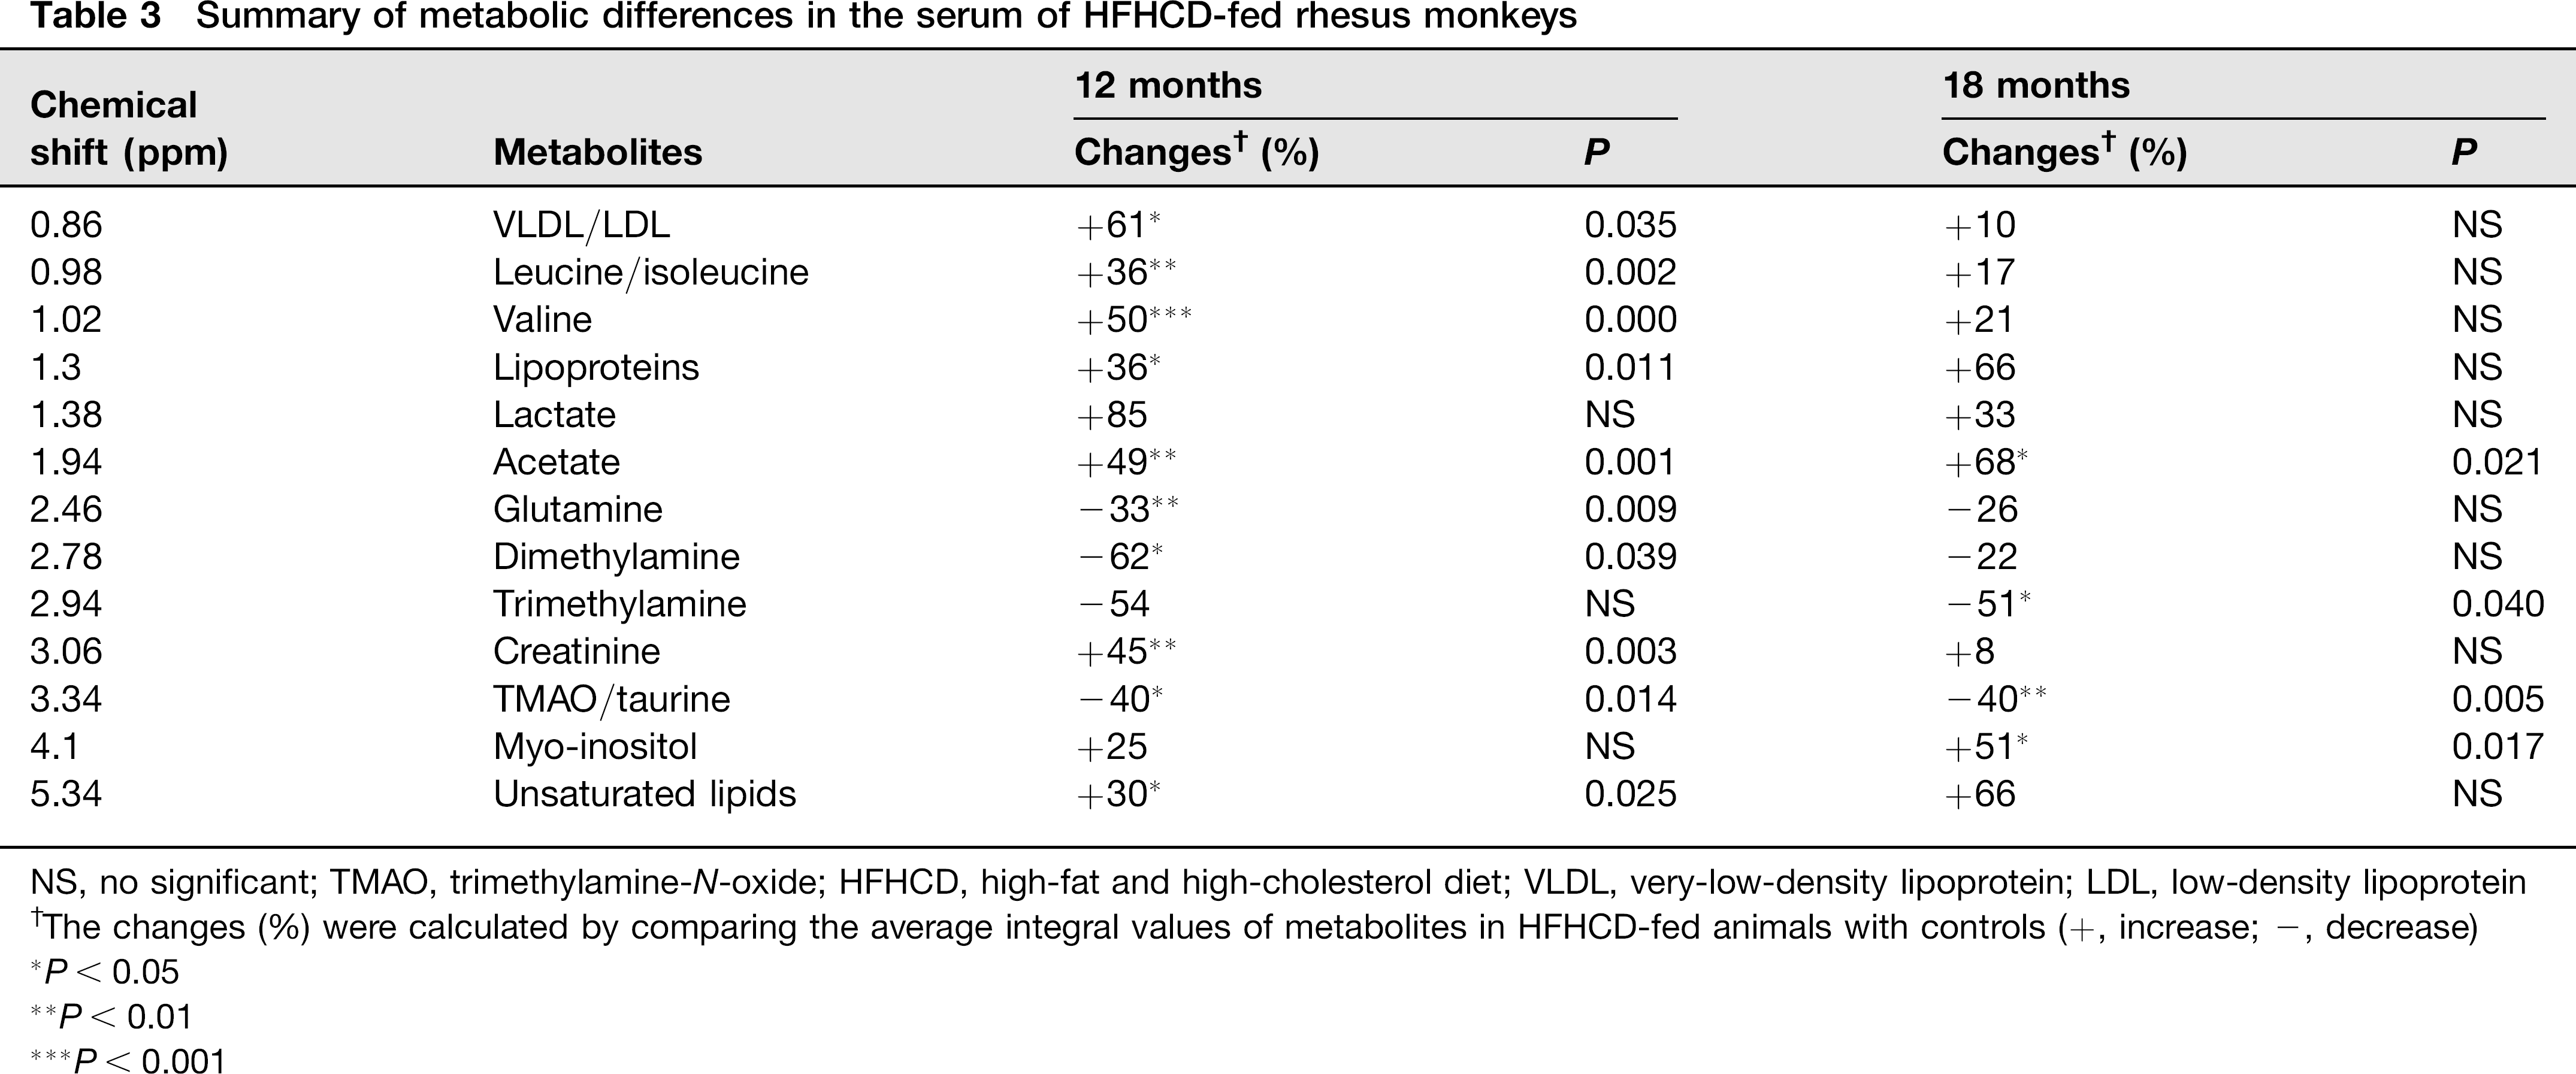
NS, no significant; TMAO, trimethylamine-N-oxide; HFHCD, high-fat and high-cholesterol diet; VLDL, very-low-density lipoprotein; LDL, low-density lipoprotein
The changes (%) were calculated by comparing the average integral values of metabolites in HFHCD-fed animals with controls (+, increase; -, decrease)
P < 0.05
P < 0.01
P < 0.001
Summary of metabolic differences in the serum lipids of HFHCD-fed rhesus monkeys
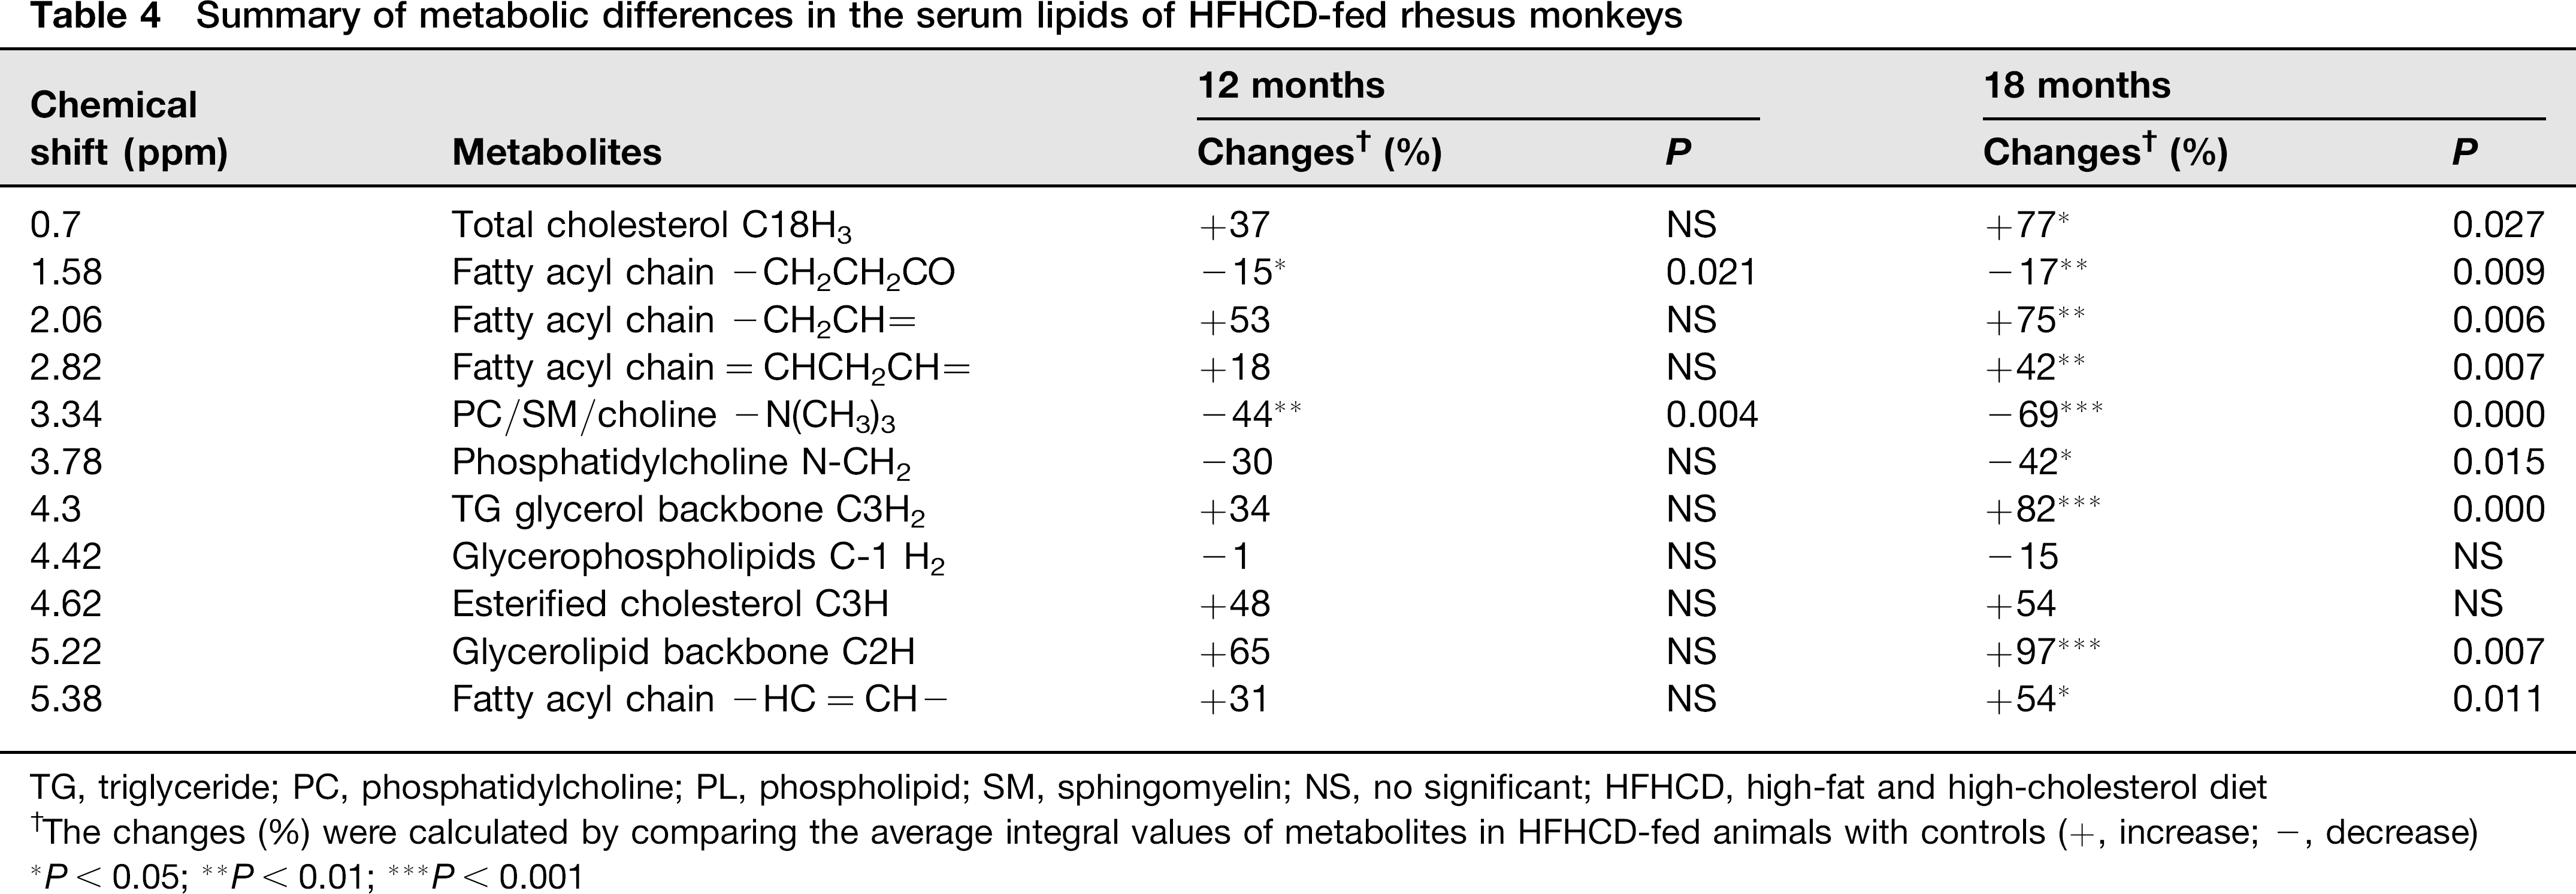
TG, triglyceride; PC, phosphatidylcholine; PL, phospholipid; SM, sphingomyelin; NS, no significant; HFHCD, high-fat and high-cholesterol diet
The changes (%) were calculated by comparing the average integral values of metabolites in HFHCD-fed animals with controls (+, increase; -, decrease)
P < 0.05;
P < 0.01;
P < 0.001
Discussion
In the present study, a diet rich in saturated fat and cholesterol content induced an exaggerated increase in TC and lipoprotein profiles. Prolonged hyperlipidemia further led to a disturbance of glucose homeostasis accompanied by disorders of amino acid and choline metabolism in juvenile rhesus monkeys. In a prediabetic state, dyslipidemia induced lipid accumulation in the liver and skeletal muscle, which is closely related to IGT and insulin resistance.
Previous studies have reported that a high-fat diet causes an elevated body weight in rodents and adult rhesus monkeys.16,25,26 However, our model of juvenile monkeys that were fed an HFHC diet for 18 months failed to gain weight or total body fat content; even weight gain percentage was lower than in monkeys that were fed the control diet. This difference may be explained by differences in lipid deposition and sensitivity to the HFHC diet with aging for different species.27,28 The older and heavier monkeys fed with an HFHC diet were more susceptible to weight gain and rapidly increased adiposity. 16 Dietary intake of cholesterol increased the total body cholesterol in monkeys. 29 Biopsies demonstrated that an abundance of lipids had deposited in the hepatocytes and intramyo-cellular along with inflammatory reaction in the liver. We suggested that visceral and hepatic fat accumulation, rather than the whole-body fat, was more sensitive to reflecting the early stage of metabolic disorders.
Prolonged diet-dependent hypercholesterolemia induced a compensatory increase in serum lipid profile. Serum LDL-C as a main carrier of cholesterol displayed a sharp increase at the first six months, followed by a decline trend in HFHC monkeys, whereas ApoB-100, a physiological ligand for the LDL receptor, showed a progressive increasing trend. The increased LDL-C was due to a decrease in LDL-C catabolism and clearance by the LDL receptor in the short-term feeding observations. As the HFHC diet was extended, absorption of exogenous cholesterol led to a degree of feedback inhibition of cholesterol biosynthesis in the liver of M. mulatta, and excess cholesterol down-regulated the LDL receptor. 30 In addition to LDL, upstream precursor particles (intermediate-density lipoprotein and VLDL) also contain ApoB-100. NMR results from HFHC monkeys showed higher VLDL compared with basal monkeys. In fact, ApoB-100 had a greater correlation with myocardial infarction than LDL. 31 Previous studies reported that feeding animals a high-fat diet led to an increase in total and LDL-C and a decrease in HDL-C. 32 In contrast, we found that the HFHC diet induced a significant increase in HDL-C along with increased total and LDL-C, which is consistent with reports of an HDL-C-raising effect of an HFHC diet in humans. 33 Due to HDL-C concentrations correlating with changes in ApoA-1 fractional catabolic rates, 34 we observed a significant increase in ApoA-1 at 12 months and a decrease in ApoA-1 with the declined TC at 18 months. The HFHC diet incited a compensatory increase of HDL to promote macrophage reverse cholesterol transport and fecal excretion. 35 As a reservoir of apoprotein C-II, elevated HDL activated LPL, which hydrolyzes most of the chylomicron TG to FFA. The HFHC diet significantly increased serum TG, LPL and FFA. Serum LPL and FFA showed a gradually decreasing trend following a compensatory increase that peaked in six months. Hypertriglyceride-mia occurred in 12 months (normal TG concentration of rhesus monkey is less than 1.1 mmol/L16). These data indicated that habitual intake of exogenous lipids and cholesterol in juvenile monkeys caused a series of compensatory increases in transportation, absorption and lipolysis.
The increased level of blood lipids can be a primary or a secondary disorder related to either diet or an underlying disease. 36 The elevated serum FFA altered pancreatic β-cell gene expression and caused toxicity.37,38 Cholesterol might become outright cytotoxic at higher levels of exposure. 30 Fasting glucose levels belatedly increased after exposured to the HFHC diet for six months while fasting insulin levels progressively increased throughout the experimental period. The decreased glucose clearance rate (KGlu) implied that the acute phase of insulin secretion was an impaired response to a high-glucose challenge. The reduced AUC-insulin implied insulin bioavailability decreased in peripheral tissues. HbA1c has been accepted by the World Health Organization as a diagnostic test for diabetes because it can reflect glycemic control in the last three months. 39 At 12 months, HbA1c increased to borderline levels that led to a diagnosis of IGT in HFHC monkeys (3.22 ± 0.36%, IGT is 3.5% 40 ). These results indicated that an IGT state had developed, although HFHC monkeys without overt hyperglycemia. The HEC clamp method is considered the gold standard to measure whole-body glucose uptake largely in muscle. 19 We used the HEC and HOMA-IR to evaluate insulin resistance and β-cell function. The M value was lower and HOMA-IR was higher in HFHC monkeys. There was significant negative correlations between the M value and HOMA-IR (R = 0.988, P = 0.012). The ratio of M/insulin (SIclamp) was also lower in the HFHC monkeys. These results implied that susceptibility to exogenous and endogenous secreted insulin decreased in peripheral tissue. Skeletal muscle is a major site of insulin action. Ectopic lipid accumulation in muscle and liver is associated with insulin resistance and functional losses in the pancreas.41,42 Increased saturated fatty acids decrease the fluidity of cell membranes, the number of binding insulin receptors and the rate of insulin-stimulated glucose transport.43,44 We therefore suggested that long-term hyperlipidemia increases the risk of the development of insulin resistance, which might be a result of the hepatic and skeletal muscle fat accumulation. The fat accumulation may produce some extent of lipotoxicity and a proinflammatory state, which play a central role in the process of glucose intolerance or in insulin resistance. 45
The dysfunction of glucose homeostasis is a progressive process accompanied by many metabolic changes. NMR-based metabolomics provide promising methods to understand the metabolic mechanisms underlying the disease development and altered metabolic pathways and networks. 46 The results of serum metabolomics revealed that the levels of sphingomyelin and choline, phosphatidyl-choline and glycerophospholipid decreased in HFHC monkeys. Sphingomyelin and choline especially showed negative correlation with TC with long-term exposure to the HFHC diet. Sphingolipid synthesis correlates with the regulation of transcription factors and regulatory proteins that control cellular lipid homeostasis. The metabolites of sphingolipid synthesis such as ceramide and glucosylcera-mide affect cholesterol efflux and mechanisms that regulate plasma high-density lipoprotein concentrations. 47 The increased cholesterol and saturated fatty acids and decreased phospholipids cause fluidity of the cell membrane to diminish and influence the exchange of substances between intracellular and extracellular matrices. 30 Choline is an important precursor of phosphorylcholine, a necessary component for assembly and secretion of VLDL. Therefore, the lack of choline can lead to accumulation of TG in the liver, causing liver steatosis. 48 Microbiota are also involved in choline metabolism, and the increased level of methylamines is a consequence of a microbiota-mediated choline metabolite. 49 Plasma glycerol changes were likely due to the lipase release of glycerol from TG-rich particles and the interplay among glycerol, TG and VLDL. Clustering analysis of 1H NMR data provided a comparison of the relative time influence of the experimental diet on the metabotypes linked to the progression of metabolic disorder. Excessive lipid accumulation in the liver and muscle was associated with abnormalities in mitochondria number, size and function, 50 which led to disturbed tricarboxylic acid (TCA) cycles and decreased energy production. Because the utilization of carbohydrates was impaired to some extent, the oxidation of amino acids becomes an alternative energy source by entering the TCA cycle at different points. 51 Increased levels of branched-chain amino acids implied that protein breakdown in skeletal muscle was increased. Glucogenic amino acids (isoleu-cine and valine) and ketogenic amino acids (leucine and lysine) in the blood circulation enhanced hepatic gluconeogenesis. Elevation of lactate indicated that glycolysis increased, and lactate would enter the cell and be converted to pyruvate. In addition, gluconeogenesis was enhanced through the glucose-alanine and Cori (glucose-lactate) cycles. TMAO, a product of di- and trimethylamine during choline or L-carnitine metabolism by gut microbiota, was found to be negatively associated with atherogenesis. 52 We also observed similar decreases in TMAO with hyperch-olesterolemia. However, the molecular mechanisms of the HFHC diet on insulin action need to be explored in a future study.
In conclusion, the HFHC diet caused a cluster of disorders of serum lipid profiles, glucose homeostasis and amino acid metabolism. Some remarkable changes in serum metabolites, including increased TMAO, lactate and branched-chain amino acids were closely related to IGT, whereas decreased sphingomyelin and choline were associated with TC. These changes occurred earlier than the clinical observation of weight gain and hyperglycemia in juvenile rhesus monkeys. The detection of visceral fat and analysis of metabolomics to predict changes in metabolite profiling can be served as a promising method for the evaluation of IGT and insulin resistance risks in the prediabetic stage.
Footnotes
Acknowledgements
We are grateful for Jing Xu and her colleagues at the Department of Experimental Medicine of West China Hospital for their work in serum biochemical and hematol-ogy examinations. We thank Pengchi Deng in the Analytical & Testing Center of Sichuan University for the NMR measurement. We also thank Yuanchao Wu of the Department of Rehabilitation Medicine of West China Hospital for DEXA detection. This work was financially supported by the following grants: National Natural Science Foundation of China (81000351, 30930088); National Program for High Technology Research and Development of China (2011ZX09307-301, 2012AA020702).