
Abstract
This study analysed the outstanding homogeneity of the German Diagnosis-Related Groups (G-DRG) using the reduction in variance (R 2) of costs. Arbitrary increase in case groups, definition of additional charges and combination of several case groups in one DRG were considered as potential confounders. In 2009, the G-DRG-system offers an outstanding homogeneity with R 2 of 83.5% in comparison to 2004 with R 2 of 70.2%. The effect of an arbitrary increase in case groups is negligible. However, a simulation of the other confounders explains three-fourth of the increase in R 2 between 2004 and 2009. The definition of additional charges attributes in particular to the outstanding homogeneity. The assessment of DRG-systems with R 2 should be complemented with measures that are independent from a trimming of costs, e.g. relating actual costs with prospective payment. The G-DRGs left medical ground in order to achieve optimal economical homogeneity.
Introduction
In 2004, Diagnosis-Related Groups were legislatively introduced in Germany, abbreviated as G-DRG, based on the Australian-Refined DRGs (AR-DRGs) as template. They replaced a reimbursement scheme consisting of a combination from daily hospital rates and lump sums. For the part of the statutory health insurance of the German Bismarckian system – all hospital costs – including the physicians fees – are covered by the G-DRGs, with the exception of investments that are covered by the supporting organization of the hospitals. 1 Until now, the psychiatric hospital reimbursement is not addressed. The system has been annually revised since 2004. Based on a voluntary sample of hospitals providing a data-set from one year, the Institute for the Remuneration System (InEK) defines the groups and calculates the case weights for the DRG-system of the year following the next year. 2 Cost accounting follows a bottom-up approach. 3
A strong cost control, a high degree of transparency and an improvement of health-care quality are, among others, the advantages of using a patient classification system (PCS) as DRGs for reimbursement purposes. For example, the same price for the same service might force the competition on quality, if the patients are allowed to select a hospital of their own choice. Prerequisite is the definition of a consistent product catalogue. From the supplier's point of view, costs of each product should be predictable; from the customer's point of view, specifications of each product should be clear. Taking DRGs as products, homogeneity measures describe the fulfilment of this prerequisite. Unfortunately, the customer's (i.e. patient's) point of view is difficult to assess because of the vagueness of medical homogeneity. Common is the evaluation of the supplier's (i.e. hospital's) point of view, to assess the variation of product (i.e. DRG) costs and the economic homogeneity.
Basic measure for economic homogeneity is the relative reduction in variance (RIV or R 2) by comparing the variance of inpatient costs or inpatient length-of-stay after grouping with the variance of inpatient costs before grouping. Excluding outliers, the AR-DRGs reached values of about 50–60%, and the German Diagnosis-Related Groups (G-DRG) 2009 a result of 83.5%. This R 2 means that 83.5% of the inpatients' cost variance is reduced by the DRG-system. The InEK ascribes the extreme success in view of economic homogeneity to a systematic system development. In parallel, concerns about the quality of the G-DRGs arose from a methodological point of view. 4 This led us to two research questions: (1) Is the outstanding economic homogeneity of the G-DRGs caused by a purposeful system development or an arbitrary refinement? (2) Are there negative side-effects that have to be accepted? In the following sections, we will present qualitative analyses to answer both questions.
Materials and methods
Data
The InEK publishes information about the G-DRGs periodically. Annual reports describe in detail the processes and the results of the G-DRG revision. For example, homogeneity measurements as RIV and coefficients of variation (COV) are mentioned. The so-called G-DRG Browser, a Microsoft Access database, includes information on demographics, costs, diagnoses, procedures and administrative characteristics from the inpatients of a voluntary sample of hospitals taking part in the cost accounting of the G-DRGs. In parallel, there is a browser covering all hospitals without information on costs. Data are mostly aggregated to a DRG-level. Inpatients with either an extreme short or extended length of stay are excluded from the G-DRG Browser. The remaining inpatients are called inliers.
We made use of the G-DRG Browser from the systems 2004 to 2009 for full-service departments. Due to the delay between data acquisition and system design, this period corresponds with the years 2002–2007 (Figure 1). The data include the arithmetic mean and the standard deviation of costs, as well as the number of inpatients per DRG. Services and products covered by additional charges are excluded from the regular cost accounting and therefore not present in the data. Table 1 shows some characteristics about the data used.
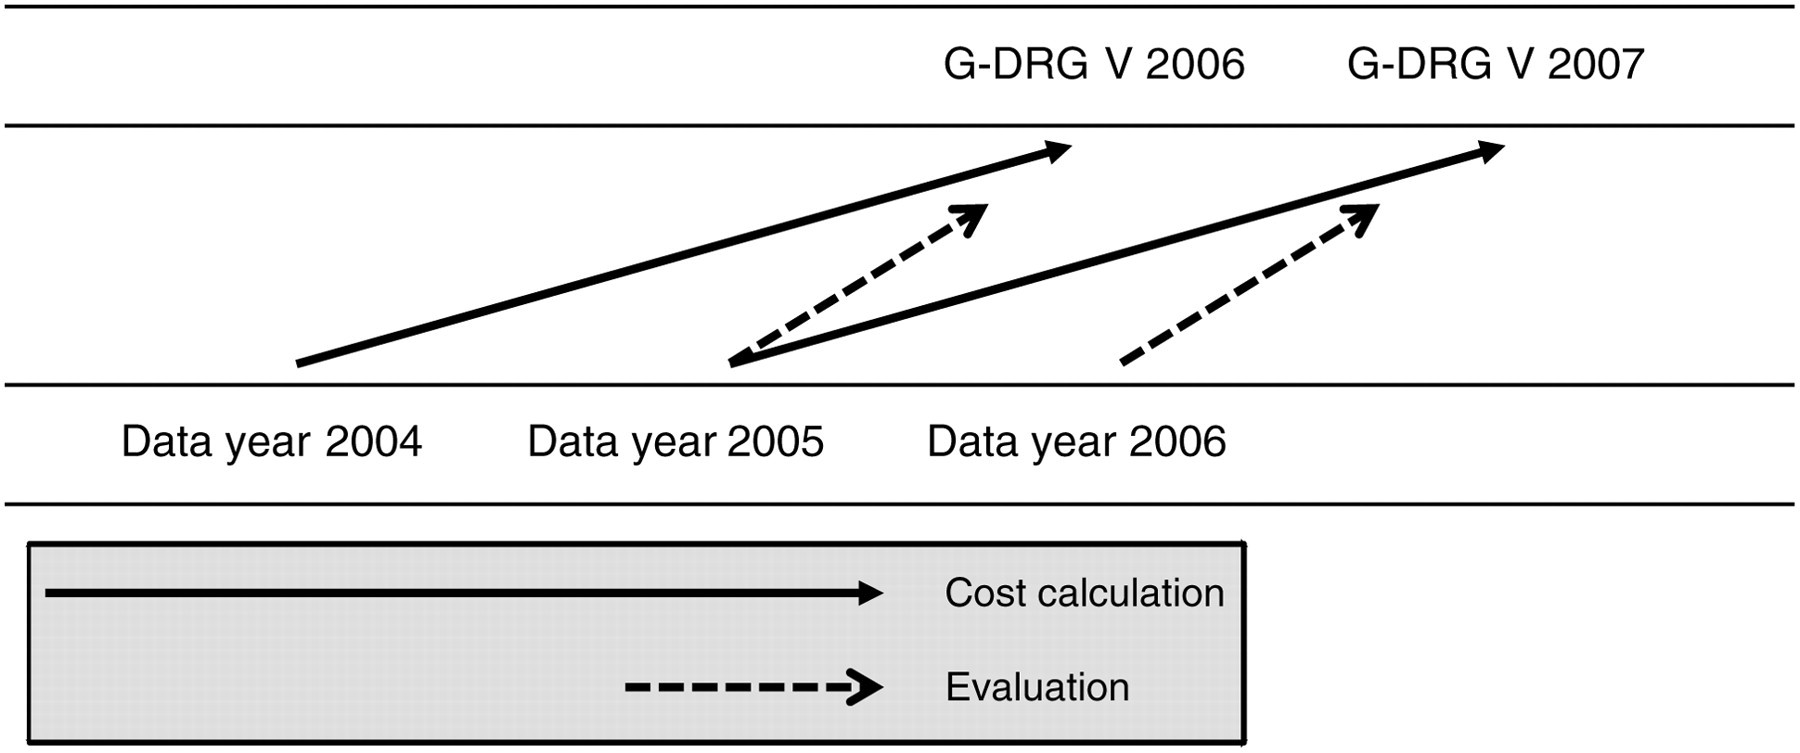
Inter-relation between annual versions of the G-DRGs (top) and years of samples used for the calculation of the RIV (bottom). G-DRG, German Diagnosis-Related Groups; RIV, reduction in variance
Sample for cost accounting according to the InEK-reports
InEK, Institute for the Remuneration System; G-DRG, German Diagnosis-Related Groups
*Number of inliers displayed in the G-DRG Browser for main departments
†No cost accounting for G-DRG 0.9
‡Cost accounting of G-DRG 1.0 has some particularities. The means were calculated as geometric ones. Routine data from all of the hospitals were not available to the InEK. Data were directly analysed from the receiver of hospitals' data. In the following years, a company was responsible for a preprocessing
Textual descriptions, case weights and some information on length of stay distribution of each DRG are published as catalogue in Microsoft Excel charts. We used these charts to qualitatively assess the structure, complexity and medical homogeneity of the G-DRGs.
Measures
RIV characterizes the homogeneity of a whole DRG-system. It mainly drives the classification process used for the definition of groups.
5
RIV gives the coefficient of determination R
2:
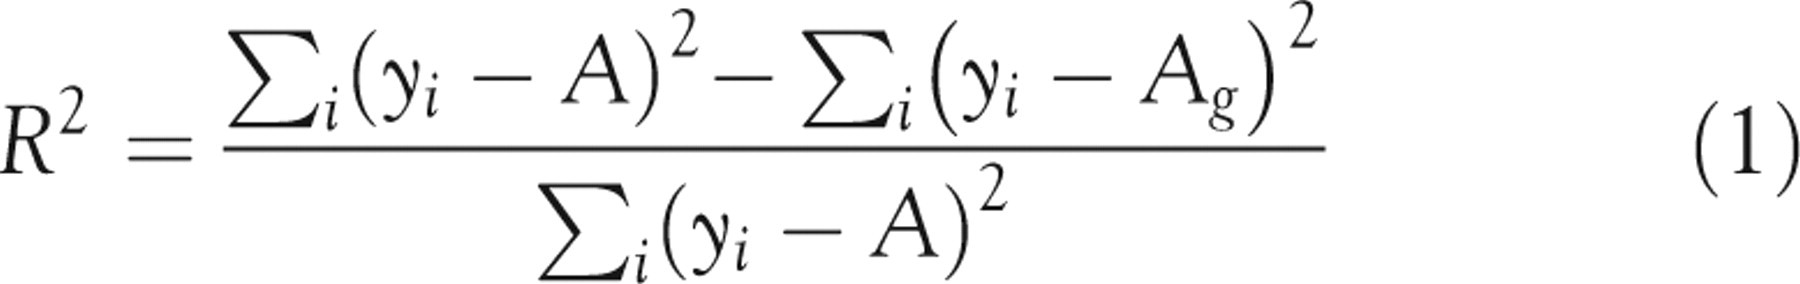
R 2 is defined as the ratio between the differences of variance before and after grouping to the variance before grouping, e.g. for costs or length of stay. A is the mean in the complete sample and A g the mean in each DRG. The range is positive with a minimum of zero and a maximum of one. The maximum of one is reached if the values after grouping within each category are all the same. Figure 1 shows the inter-relation between different RIV presented in the InEK-reports.
COV is a simple measure for the homogeneity of a distribution, at an early stage used for the evaluation of prospective reimbursement systems:
6

It is defined as ratio between the standard deviation s and the mean 
We analysed three variables potentially confounding the economic homogeneity: an arbitrary increase in case groups, the definition of additional charges and the combination of several subsets of patients in one DRG by conjunction.
Results
Raw homogeneity of the G-DRGs
RIV is the main measure used for the evaluation of the G-DRG design. Table 2 shows the respective figures for the versions 2003–2009. There is an absolute increase of R 2 from 70.2% in version 2004 to 83.5% in version 2009 for inliers and from 55.8% to 74.4% for all cases of the cost accounting sample. The relative increase of 18.8% follows an asymptotic curve with 11.0% version 2004 to version 2005 and 2.2% version 2008 to version 2009. A comparison of two consequent systems using the same database excludes case-mix effects. That reduces the relative increase in R 2 significantly. The highest improvement in RIV could be reached by undocking from the AR-DRGs.
RIV according to the InEK-reports
InEK, Institute for the Remuneration System; G-DRG, German Diagnosis-Related Groups; RIV, reduction in variance
COV shows a similar trend for inliers between versions 2003 and 2009. We split the DRGs into two groups with a COV below 0.54 and 0.54 and higher (corresponding with a coefficient of homogeneity of 0.65). In version 2004, with 55.2% the majority of the DRGs fell in the group with lower homogeneity and 44.8% in the group with higher homogeneity. This proportion changed dramatically in version 2005 with 25.3% and 74.7%, and ends up in version 2009 with 9.7% and 90.3%. The relative bettering each year follows the same asymptotic curve as RIV.
Arbitrary increase in case groups
An arbitrary increase in groups raises RIV. Feldman presented a respective formula in arguing ‘that data-splitting is an aggressive technique that can result in an improvement (i.e., smaller weighted variance or smaller COV) even though the split makes no medical sense’.
7
According to Feldman, the expected RIV 
To assess the effect between two years, we applied the difference ΔDRG instead of the total number of DRGs, N(DRG).
Due to the large number of cases, the expected increase in RIV is rather small in comparison with the results reached with the G-DRGs. The expected increase accounts only for about 0.5% of the total increase in RIV.
Use of conjunctions
The textual definitions of the DRGs became longer and longer. For example, version 2010 defines G-DRG A09C as ‘Artificial ventilation >499 and <1000 hours with complex operating room procedure or multiple trauma or complex intensive care treatment >3220 points, without complicating constellation, age >15 years, or without complex operating room procedure, without multiple trauma, with complicating constellation or complex intensive care treatment 2209–3220 points or age <16 years’. Fischer presented data concerning the use of conjunctions like ‘and’, ‘or’, ‘with’ and ‘without’, the use of words like ‘age’ as well as the use of punctuation marks like the comma and parenthesis. 4 To add version 2009, we applied the method proposed by Fischer to the respective definitions. Whereas the number of DRG-definitions without conjunctions decreased from 81 in version 1.0 to 73 in version 2009 (−9.9%), the number of DRG-definitions using six or more conjunctions increased from 20 to 302 (+1410%). The maximum number of conjunctions used for a DRG-definition rose from seven in version 1.0 to 14 in version 2009. We regard the use of conjunctions as a combination of different medical case groups into a single economical one. The official number of groups remain ostensibly small, the real number rises enormously (Table 3). Concerning homogeneity, the effect of an arbitrary increase in case groups on the RIV is masked. Therefore, we applied the formula of Friedman to several DRGs, established by separating the DRGs according to their conjunctions. Table 3 shows the effect on RIV, which is 10 times higher than using the official number of groups.
Simulated effect of conjunctions on the RIV of inliers
G-DRG, German Diagnosis-Related Groups; RIV, reduction in variance
More than six conjunctions were counted as six
Definition of additional charges
Definition of additional charges for services and products like blood components, chemotherapeutics, haemodialysis or cardiac stents may improve as well as deteriorate homogeneity. Taking into account the motivation to increase homogeneity, one can assume that services and products are excluded from the DRGs, if this decision increases R 2. About 2.5% of the cases in the cost accounting sample are corrected with regard to these services and products (Table 4). To simulate the effect of this trimming, we compared the RIV from two consecutive data years using the same DRG-definitions. Differences can be attributed either to changes in case-mix or to changes in cost trimming. Table 4 demonstrates that there is indeed a substantial effect on R 2, with a relative increase between 0.8% (version 2006) to 8.7% (version 2004). Version 2005 is an outlier with a decrease of 0.5% comparing data from 2003 and 2004.
Change in the RIV due to the definition of additional charges
G-DRG, German Diagnosis-Related Groups; RIV, reduction in variance
Combination of confounders
We combined the effects of additional charges and an arbitrary increase of case groups to reach an overall estimation of the influence of confounders on the RIV. Table 5 shows the comparison between the RIV published by the InEK (gross) and the RIV corrected for the confounders' effects (net). In the combination, there is a significant reduction. Taking the net RIV, homogeneity of G-DRG 2009 is quite lower with a R 2 of 73.6% compared with the published value of 83.5%.
Net change in the RIV for inliers in comparison with the previous year
G-DRG, German Diagnosis-Related Groups; RIV, reduction in variance
Discussion
From version 2004 to version 2009, R 2 of the G-DRG-system increased from 70.2% to 83.5%, calculated in a trimmed sample of inliers used for cost accounting. However, three-fourths of the increase of 13.2% can be attributed to confounding factors, namely the exclusion of special products and the artificial limiting of the number of groups by combining different subsets of patients. The definition of special products and the respective exclusion of costs in the cost accounting are particularly responsible for the jump in R 2 from 70.2% in G-DRG 2004 to 78.0% in G-DRG 2005. The other main factor explaining the striking change for the better of RIV is the transition from an AR-DRG translation to a national system that raises R 2 from 62.1% in G-DRG 1.0 (data year 2002) to 76.4% in G-DRG 2004 (data year 2003). We conclude that the extraordinary economic homogeneity of the G-DRGs is to a relevant extent caused by secondary interventions and cannot be ascribed to a purposeful system development.
Nevertheless, a net R 2 of 73.6% – even calculated from trimmed data – is the highest value for a DRG-system published so far. In 2005, Switzerland calculated RIV for a couple of PCS to support the decision about a new national DRG-system. 8 The study provides results for R 2 based on a data-set of 200,000 inpatients trimmed for 1000 outliers (0.5% outliers). All results are lower in comparison to the G-DRGs: All Patient DRG (AP-DRG) – 0.60, All Patient Refined DRG (APR-DRG) – 0.64, International Refined DRG (IR-DRG) – 0.58, AR-DRG – 0.57, LDF – Leistungsbezogene Diagnosen-Fallgruppen (LDF) from Austria – 0.39, and Striving for Quality Level and Analysis of Patient Expenditures (SQLape) from Switzerland – 0.64. Switzerland decided later to adopt the G-DRGs, but without presenting respective results in that study.
In their analysis of DRG-systems, Averill et al. 9 excluded within each DRG the 1% of patients with the highest costs and the one-half of 1% of patients with the lowest costs. Furthermore, 16% of the original sample were excluded due to several reasons (e.g. data quality). Nevertheless, in the remaining sample of 4,203,646 inpatients from 1993, all results of R 2 are lower in comparison to the G-DRGs: DRGs of the Health Care Financing Administration, 0.5151; severity DRG, 0.5331; refined DRG, 0.5577; AP-DRG, 0.5600 and APR-DRG, 0.6009. AP-DRG and APR-DRG perform better in the Swiss study, but the difference remains stable, which could support the reliability of these findings.
In view of the extensive trimming performed in cost accounting of the G-DRGs, it is conceivable that a net RIV calculated on untrimmed data will be on the level of APR-DRGs or SQLape. To have a fair comparison, it might be worthwhile following the recommendations to replace the measure of RIV of costs by a proportion of prospective payments to current costs. As an example, the payment redistribution impact RPAC for a subgroup s is calculated with the product of the number of patients in DRG g in subset s with the average costs A and the actual costs y of patient i:
9

However, this raises political questions: Should current costs be refunded? It might be of political interest to initiate a more efficient delivery of health-care services by offering subtotal reimbursements in some periods. Marazzi et al.
10
proposed two predictive quality measurements comparing reimbursements based on a given period to the observed costs of a different period: the mean squared reimbursement error, 

The high gross RIV for the G-DRGs is bought dearly. First, the G-DRGs have lost their diagnoses orientation. More and more, fee-for-service aspects are introduced. The number of additional charges (‘Zusatzentgelte’ in German) quintuples from 26 in version 2004 to 127 in version 2009. With the G-DRG 2009, reimbursement is based on a complex combination of a case-based scheme with the additional charges. According to the classification proposed by Barnum et al. 11 Germany has replaced one mixed provider payment system with another mixed system. Using DRGs for the comparison of hospitals, the evaluation of outcomes, the support of quality management as well as the support of health policy is remarkably hindered. A simple list of frequencies per DRG does not reflect hospitals' services adequately. Furthermore, the exhaustive use of conjunctions in the definition of DRGs uncouples the financial perspective from the medical one. The aim to interlock both perspectives to improve delivery of health-care services cannot be achieved. The G-DRGs lost their potential as a transparent base for the communication between hospital management and health-care professionals. The former belief of a large number of case groups as common prerequisite for medical expressiveness and economical heterogeneity did not come true. 12
Conclusions
Economical homogeneity measured with RIV of costs or length of stay is the central evaluation criterion for PCS. 13 In the refinement of the G-DRGs, medical homogeneity stood back in the optimization of RIV. This depreciates the value of a PCS in creating transparency for the patients, in improving health-care quality and in offering a service catalogue being a prerequisite of a real competition. DRGs could not be justified by cost control alone. That could be achieved a whole lot simpler by either a global or a line item budgeting. A successful implementation needs a reasonable balance between economical and medical homogeneity. For the latter, appropriate measures are still needed.
Concerning economical homogeneity, the handling of outliers and the trimming of costs will greatly affect the results. We propose to establish an international reference data-set in order to offer the prospect of calculating homogeneity measures for different PCS on a transparent basis. The standardization of cost data will be a major issue in this data-set. Due to the different methods applied in the cost accounting, it remains unclear, whether and when this could be achieved. 3