
Abstract
Objective
To determine the characteristics of general practices which perform poorly in terms of Quality and Outcome (QOF) performance indicators in England's NHS.
Method
Retrospective, four year longitudinal study, 2005 to 2008. Data were obtained from 8515 practices (99% of practices in England) in year 1, 8264 (98%) in year 2, 8192 (98%) in year 3 and 8256 (99%) in year 4. Outcome measures: QOF performance scores; social deprivation (IMD-2007) and ethnicity from the 2001 national census; general practice characteristics.
Results
We identified a cohort of 212 (2.7%) practices which remained in the lowest decile for total QOF scores in the four years following the introduction of the QOF. A total of 705,386 patients were registered at these practices in year 4. These practices were more likely to be singlehanded (odds ratio [OR], 13.8), non-training practices (OR, 3.9) and located in deprived areas (OR, 2.6; most vs least deprived quintiles). General practitioners (GPs) in these practices were more often aged ≥65 years or more (OR, 7.3; mean GP age ≥65 years vs <45 years), male (OR 2.0), UK qualified (OR 2.0) with small list sizes (OR 3.2; list size <1000 vs 1500-2000 patients). We identified individual QOF indicators which were poorly achieved. The reported prevalence of most chronic diseases was lower in the poorly performing cohort.
Conclusions
A small minority of practices have remained poor performers in terms of measurable performance indicators over a four-year period. The strongest predictors of poor QOF performance were singlehanded and small practices, and practices staffed by elderly GPs.
Introduction
In parallel with the increased adoption of performance indicators in healthcare systems, there has been an expanding literature describing their role as incentives in pay-for-performance systems, for driving up overall quality standards and for justifying public investment in health. 1 The Quality and Outcomes Framework (QOF), introduced in England in 2004, has been acclaimed in terms of demonstrating pre-existent levels of high quality primary care, overall quality improvement and the reduction of health inequalities. 1 Dissenting voices have raised concerns about ‘tick-box medicine’, the failure to value personal care and the lack of validated indicators measuring many of the essential functions of primary care such as early diagnosis and empathic care. 2 Some chronic diseases have been omitted altogether from the indicators used.
Evaluation of healthcare systems in terms of performance indicators has generally focused on overall achievement rather than the poor performance of a few. This makes sense from a public health perspective since the population is better served by concentrating on raising the mean standard rather than concentrating on improving the performance of the outliers. General practice though, is different. With its registered list system, UK general practice offers patients exclusive registration at one practice. If that practice is poorly performing, each of the patients registered at the practice lacks alternative access to higher quality primary care, short of registering with another practice. Most patients form a long term relationship with their practice and their own general practitioner (GP) which acts as a disincentive to change practices in search of higher quality standards.
Although concerns have been raised about poor performance in individual practitioners and about wide variations in performance, none of the international literature about performance indicators has described the characteristics of general practices which continue to perform poorly over time. We decided to use the performance data contained within the QOF to identify the characteristics of sustained poor performance among general practices, during the four years for which QOF data are currently available.
Methods
QOF data
We obtained QOF data covering the four years April 2004 to March 2008 for all general practices in England. These data covered the following domains: chronic disease management; practice organization; patient experience; additional services; and access.
Practice and population characteristics
A detailed national summary of practice characteristics was obtained. 3 Variables included: practice list size; age/sex breakdown of registered population; number of full time equivalent GPs; the age of the GP; the country where each GP was medically qualified; and training practice status.
A variable was constructed to describe the mean age of GPs in each practice. We took the mid-point of each of the ten age categories in the original data and used this to determine a weighted average for the practice as a whole, based on the number of full time equivalent GPs in that category. This value was then used to allocate each practice into one of four mean GP age categories: under 45 years; 45-54 years; 55-64 years; and ≥65 years.
Data from the 2001 national UK Census were obtained based on the Lower Layer Super Output Area (SOA) 4 for each practice and used as the basis for calculating social deprivation (the Index of Multiple Deprivation, or IMD-2007 5 ) and ethnicity. Each SOA consists of about 1500 people within a defined geographical locality. Census data based on the home address of all patients registered at a general practice are not available in England so the SOA in which the general practice was located had to act as a proxy for the registered population at each practice.
Statistical methods
We constructed a dataset containing QOF data, practice and SOA-based census variables for all practices in England. We removed practices from the dataset if they were no longer independent at the end of the study year or had a list size of under 750 patients or under 500 per full time equivalent GP on the grounds that these were likely to be newly formed or about to be closed.
We defined longitudinal cohorts of poorly performing practices based on their total QOF score over each of the four years for which QOF data are available. We then explored the characteristics of these poorly performing practices using univariate analysis (simple logistic regression) to define their practice and demographic characteristics. We then searched for possible confounding variables using multivariate analysis (multiple logistic regression). The analyses were conducted using logistic regression which produces odds ratios (ORs) for the likelihood of being a poorly performing practice. Logistic regression requires a reference variable to be defined amongst the range of each ordinal variable. The ORs represent the likelihood of belonging to the poor performers' cohort compared to the reference group. Values >1.0 mean that these practices were more likely to be in the poorly performing cohort than practices in the reference group.
Results
Practices included in the analysis
Sixty-one practices were removed as likely to be newly formed or about to be closed in year 1, 145 in year 2, 180 in year 3 and 38 in year 4. Due to postcode and SOA anomalies, we were unable to match IMD-2004 and ethnicity data for 35 practices in year 1, none in year 2, 361 in year 3 and 1 in year 4. The final dataset consisted of 8515 practices (99% of the total) in year 1, 8264 (98% of the total) in year 2, 8192 (98% of the total) in year 3 and 8256 (99% of the total) in year 4; data were available for 7984 practices in all four years of the study.
Defining poorly performing practices
Overall, 212 (3%) practices remained in the cohort of practices with QOF scores in the lowest 10% during each of the four consecutive years of the study, 542 (7%) remained in the lowest 20% cohort and 753 (9%) in the lowest 25% cohort (Table 1). Rising national mean performances in all practices over the four-year period of study were mirrored by rising mean values in each of the poorly performing cohorts (Table 1).
Cohorts of practice performance over four consecutive years 2004–2008
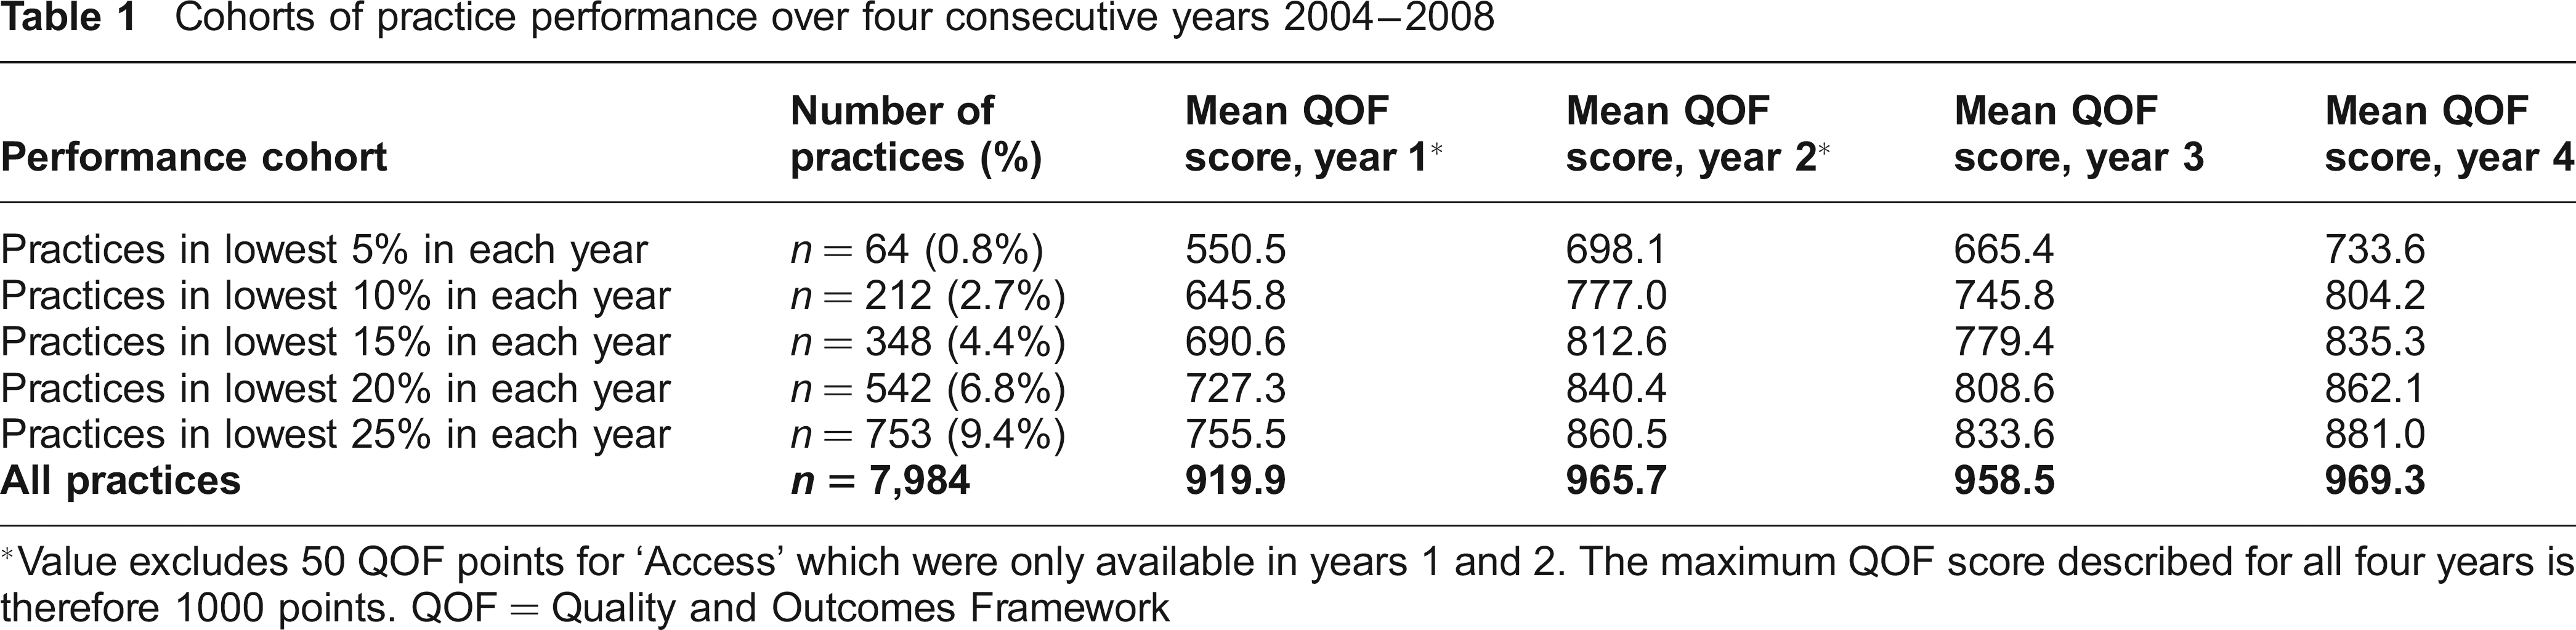
Value excludes 50 QOF points for ‘Access’ which were only available in year s 1 and 2. The maximum QOF score described for all four year s is therefore 1000 points. QOF — Quality and Outcomes Framework
In order to focus on the poor performers, our principal analysis was based on the 212 practices remaining in the lowest 10% for total QOF scores during the first four years after the introduction of the QOF (the ‘poor performance cohort’). A more stringent definition of poor performance would have reduced the significance of the analysis; a more generous definition would have substantially increased the number of practices in the poor performance category, thus reducing face validity. The mean QOF score of the poorly performing cohort was 804 in year 4; the mean score for the remaining practices was 976. A total of 705,386 patients were registered at these practices in the final year of study.
Practices omitted from the analysis
The total number of general practices in England has declined since 2005. To ensure that we had not missed poor QOF performance in their final year before closure, we explored mean QOF performance in these practices. Practices which closed in the subsequent year did have lower QOF performance than national mean levels, but their overall QOF performance was significantly higher than practices in the poor performance cohort (Table 2).
QOF performance of practices which closed in the years 2004–2008 compared with QOF performance of poorly performing practices in the same year
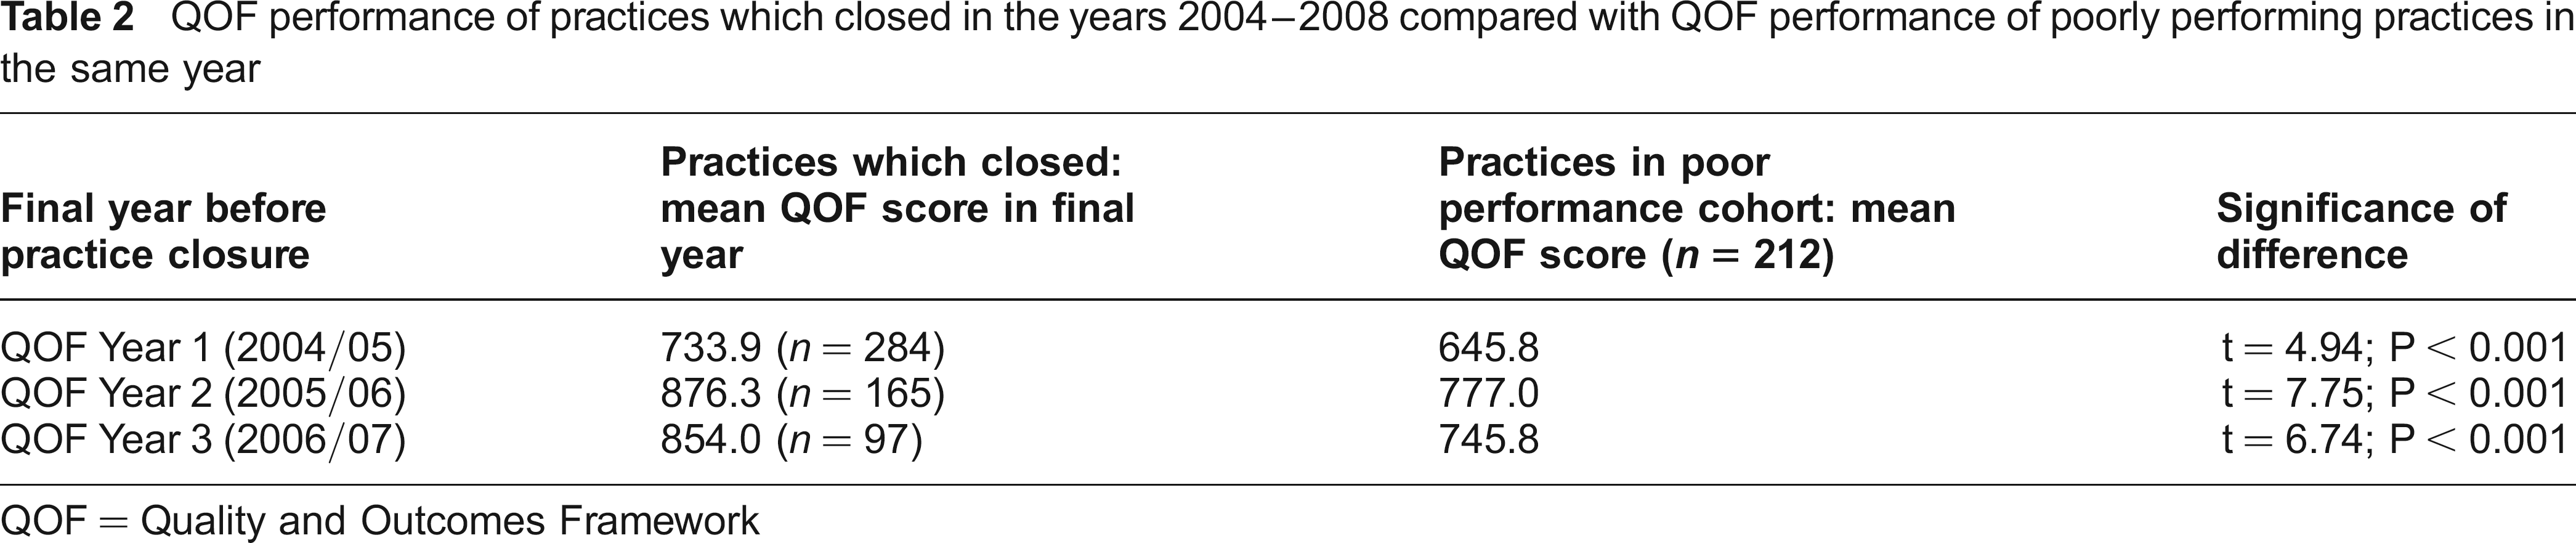
QOF = Quality and Outcomes Framework
Characteristics of the poorly performing practices – univariate analysis
The characteristics of the 212 ‘poorly performing’ practices are summarized in Table 3. Characteristics strongly associated with poor performance were non-training practices and practices with older GPs. Practices with large list sizes per full time equivalent (FTE) GP were not more likely to be in the poorly performing cohort.
Relationship between poor performance and descriptive primary care variables: simple logistic regression.
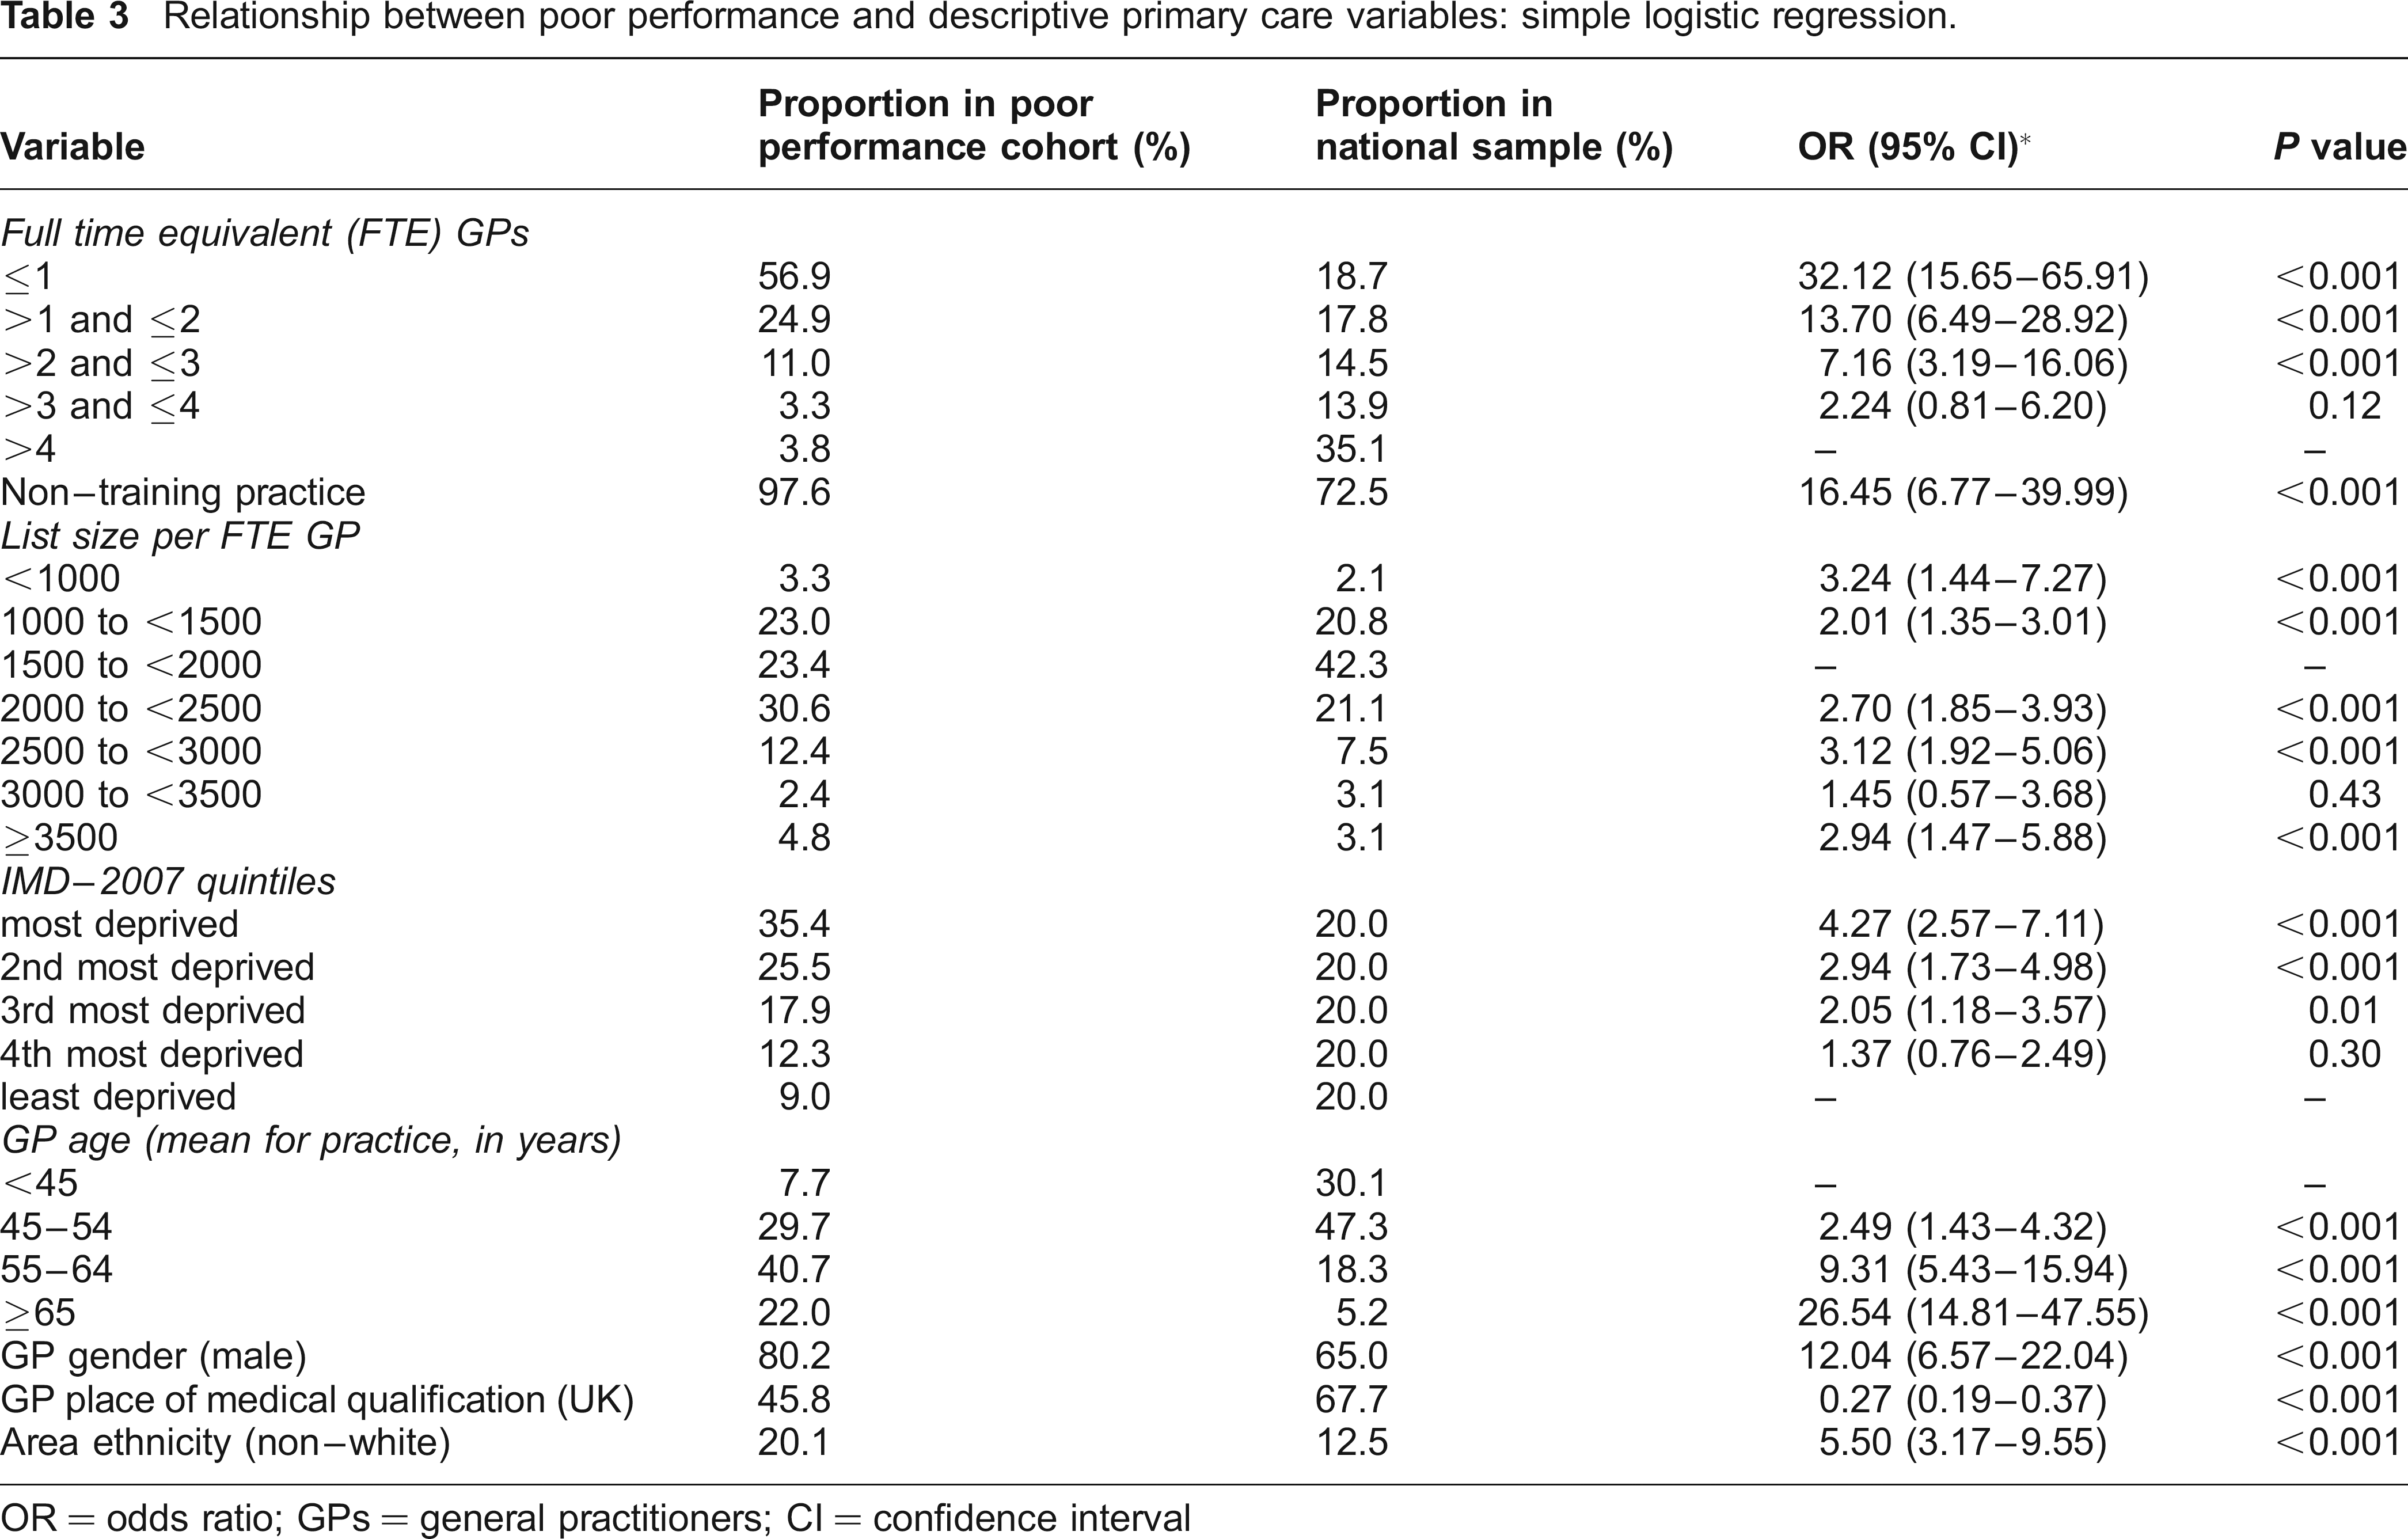
OR = odds ratio; GPs = general practitioners; CI = confidence interval
Characteristics of the poorly performing practices – multivariate analysis
Multivariate analysis was conducted using the poorly performing cohort of 212 practices as the dependent variable. All of the variables explored using univariate analysis were included in the multivariate analysis (Table 4).
Relationship between poor performance and descriptive primary care variables: multiple logistic regression
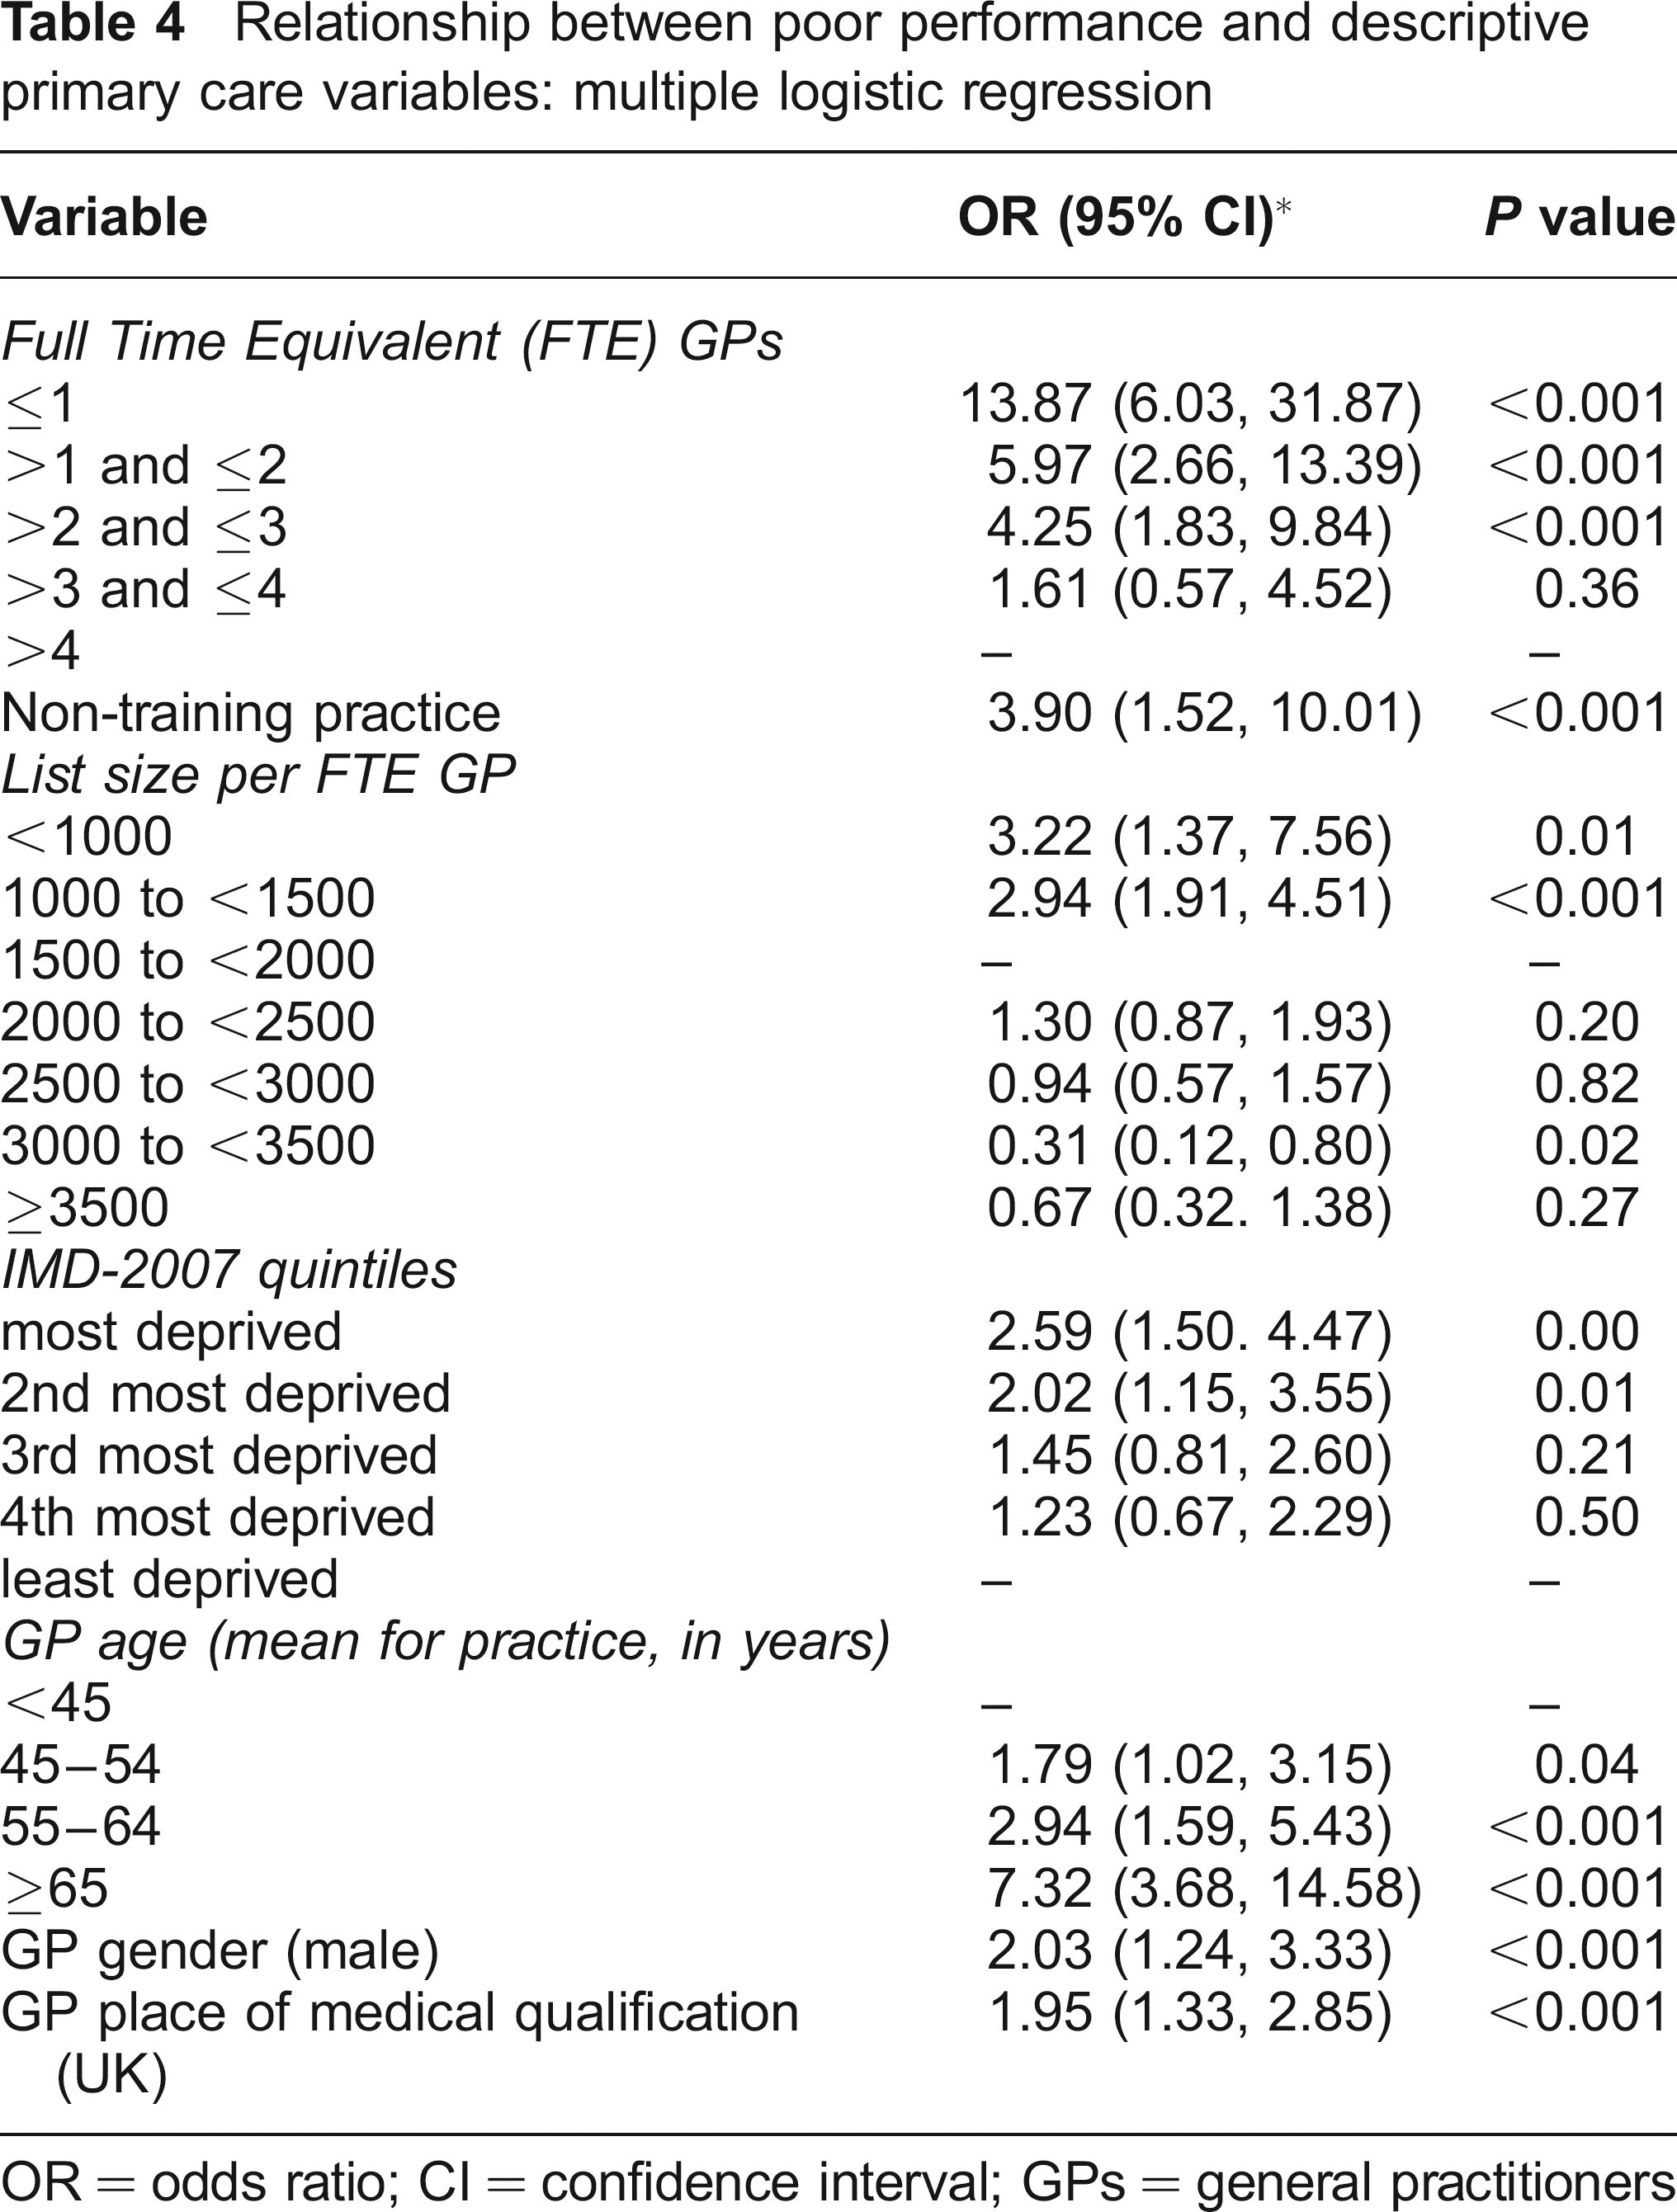
OR = odds ratio; CI = confidence interval; GPs = general practitioners
Some variables were no longer significant in the multivariate analysis and some variables changed their direction of association. The ethnicity of the local population no longer remained a significant predictor, mainly because ethnicity was strongly confounded by social deprivation. Similarly, non-UK trained GPs initially appeared more likely to be poor performers, but once adjusted for confounding, particularly by singlehanded status and GP age, the association with poor performance was stronger for UK trained GPs.
Based on the findings of the multivariate analysis, the strongest predictors of poor performance were single-handed status, mean age of GPs and training practice status (Table 4). Smaller practices in general were more likely to be poor performers: the OR was highest for singlehanded practices at 13.87 (compared to practices with >4 FTE GPs) and fell progressively as practice size increased. Similarly, practices with older GPs were more likely to be poor performers: the ORs rose progressively in the three older age bands, reaching 7.32 for practices where the mean age of GPs was 65 years of more, when compared with practices where the mean age was under 45 years. Non-training practices were more likely to be poor performers: OR 3.90.
Singlehanded status and variability
In any study of the characteristics of general practices, singlehanders may be disproportionally represented among the outliers. This is because variations in the performance of individual GPs may be cancelled out within a group practice. To determine if the association of poor performance with singlehanded status was the result of a statistical artefact, we calculated the variability of QOF scores in singlehanded and group practices. The standard deviation of total QOF score was 86.0 in single-handed practices, 55.3 in practices with 1.1–2 FTE GPs, 47.6 with 2.1–3 FTE GPs, 32.0 with 3.1–4 FTE GPs and 24.5 with over 4 FTE GPs.
Having established the greater variability in total QOF score among singlehanders, we determined whether singlehanded status was more strongly associated with poor performance or with high performance. We created a cohort of high performing practices by selecting those with total QOF scores in the top 10% for each of the four years of our study (n = 183). Based on the same method as above, the adjusted OR for singlehanded practices belonging to the high performing cohort was 1.41 (95% confidence interval [CI], 0.64 to 3.09; P = 0.40).
Singlehanded practices were thus more likely to have a total QOF score scattered across a wider range than group practices, were significantly more likely to be in the poor performance cohort of practices, but not significantly more likely to be in the high performance cohort. Although 56% of our sample of poor performers were singlehanded, this represents just 8% of all singlehanders.
Poor performance and geographical distribution
The 212 practices in the poor performance cohort were distributed unevenly throughout the country. Of the ten strategic health authorities (SHAs) in England, those with the highest proportion of practices in the poor performance cohort were London SHA at 4% (n = 57), south east coast SHA at 3% (n = 21) and West Midlands SHA at 3% (n = 32). In contrast, less than 1% of practices were in the poor performance cohort in two SHAs: south central, 0.2% (n = 1) and north east, 1% (n = 4).
Poor performance, QOF domains and QOF indicators
The poor performance cohort was defined in terms of its total QOF score. But is achievement diminished equally across all domains and all indicators within the QOF? The profile of QOF performance in the poorly performing cohort is summarized in Table 5. Particular shortfalls in clinical indicator categories in the poorly performing cohort were achievements on the depression, mental health and palliative care categories. Notable shortfalls in the achievement of individual QOF indicators were those related to mental health (five out of the nine clinical indicators with the greatest shortfall were depression or mental health indicators) and those related to poor record keeping (five out of the six organizational indicators with the greatest shortfall referred to records of clinical summaries or repeat prescribing).
QOF performance: achievement of QOF categories and individual indicators in poorly performing practices
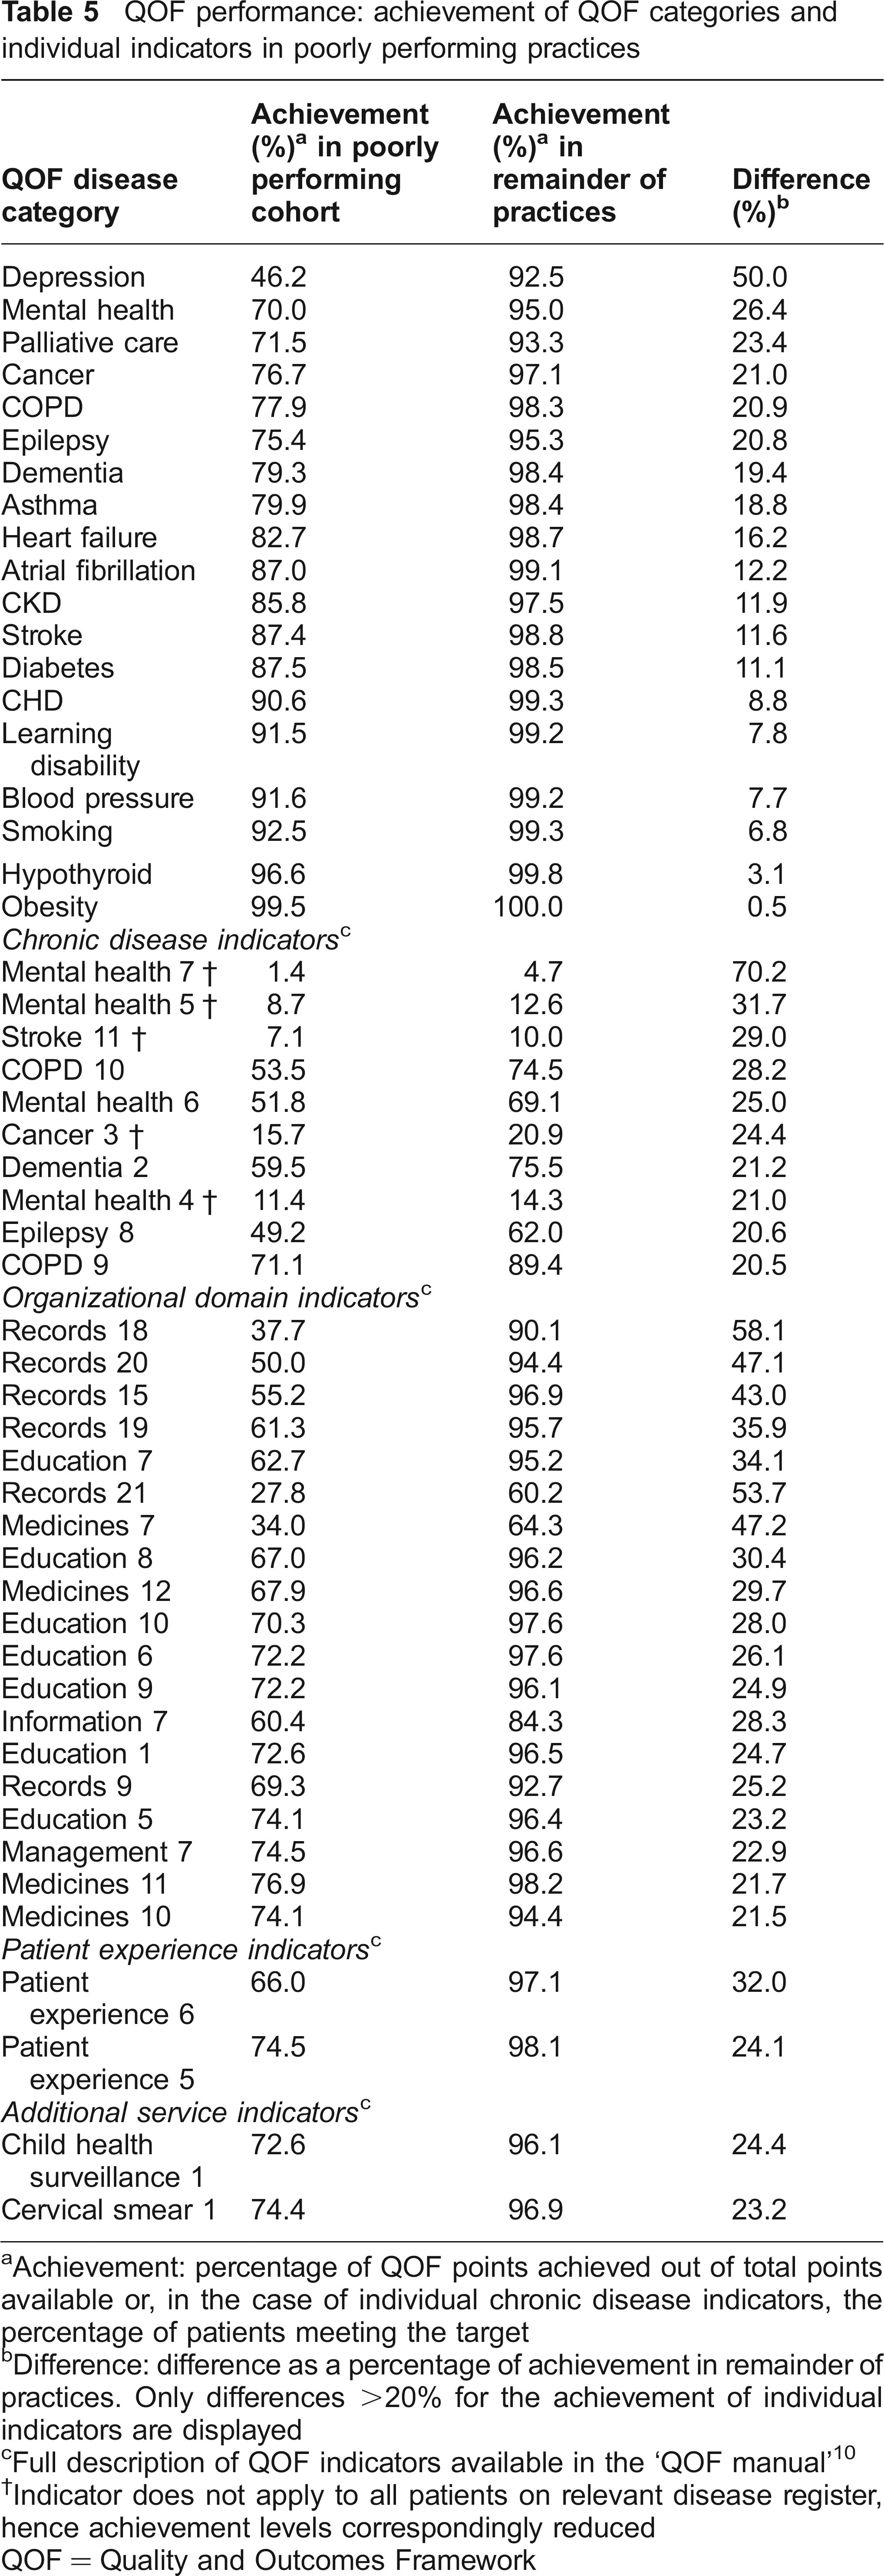
Achievement: percentage of QOF points achieved out of total points available or, in the case of individual chronic disease indicators, the percentage of patients meeting the target
Difference: difference as a percentage of achievement in remainder of practices. Only differences >20% for the achievement of individual indicators are displayed
Full description of QOF indicators available in the ‘QOF manual’ 10
Indicator does not apply to all patients on relevant disease register, hence achievement levels correspondingly reduced
QOF = Quality and Outcomes Framework
Overall, the poor performance cohort was characterised by poorer organizational domain scores than clinical indicator scores. Poorly performing practices scored a mean of 71% (95% CI, 69–74%) of available organizational domain QOF points and 84% (82–85%) of clinical QOF points. In contrast, the remaining practices had similar organizational and clinical indicator scores, achieving 95% (95–96%) and 98% (98.0– 98.2%), respectively.
Differences between the poor performance cohort and the remaining practices might have been distorted by differential exception reporting rates. 6 Differences are known to occur in the willingness of practices to exception report certain patients, thus excluding them from performance targets. Exception report rates can only be calculated for those clinical indicators which apply to the whole disease register. Where available, values corrected for exception reporting are presented in Table 5.
Prevalence of chronic diseases and poor performance
Reporting bias may be introduced by differential prevalence rates for the chronic diseases which feature in the QOF. Because the poorly performing practices were located in more deprived areas, which could be expected to have higher disease prevalences, we adjusted for deprivation, ethnicity, age and gender. Prevalence rates for most of the chronic diseases were lower than expected in the poorly performing practices (Table 6).
QOF chronic disease prevalence: recorded prevalence in poorly performing practices
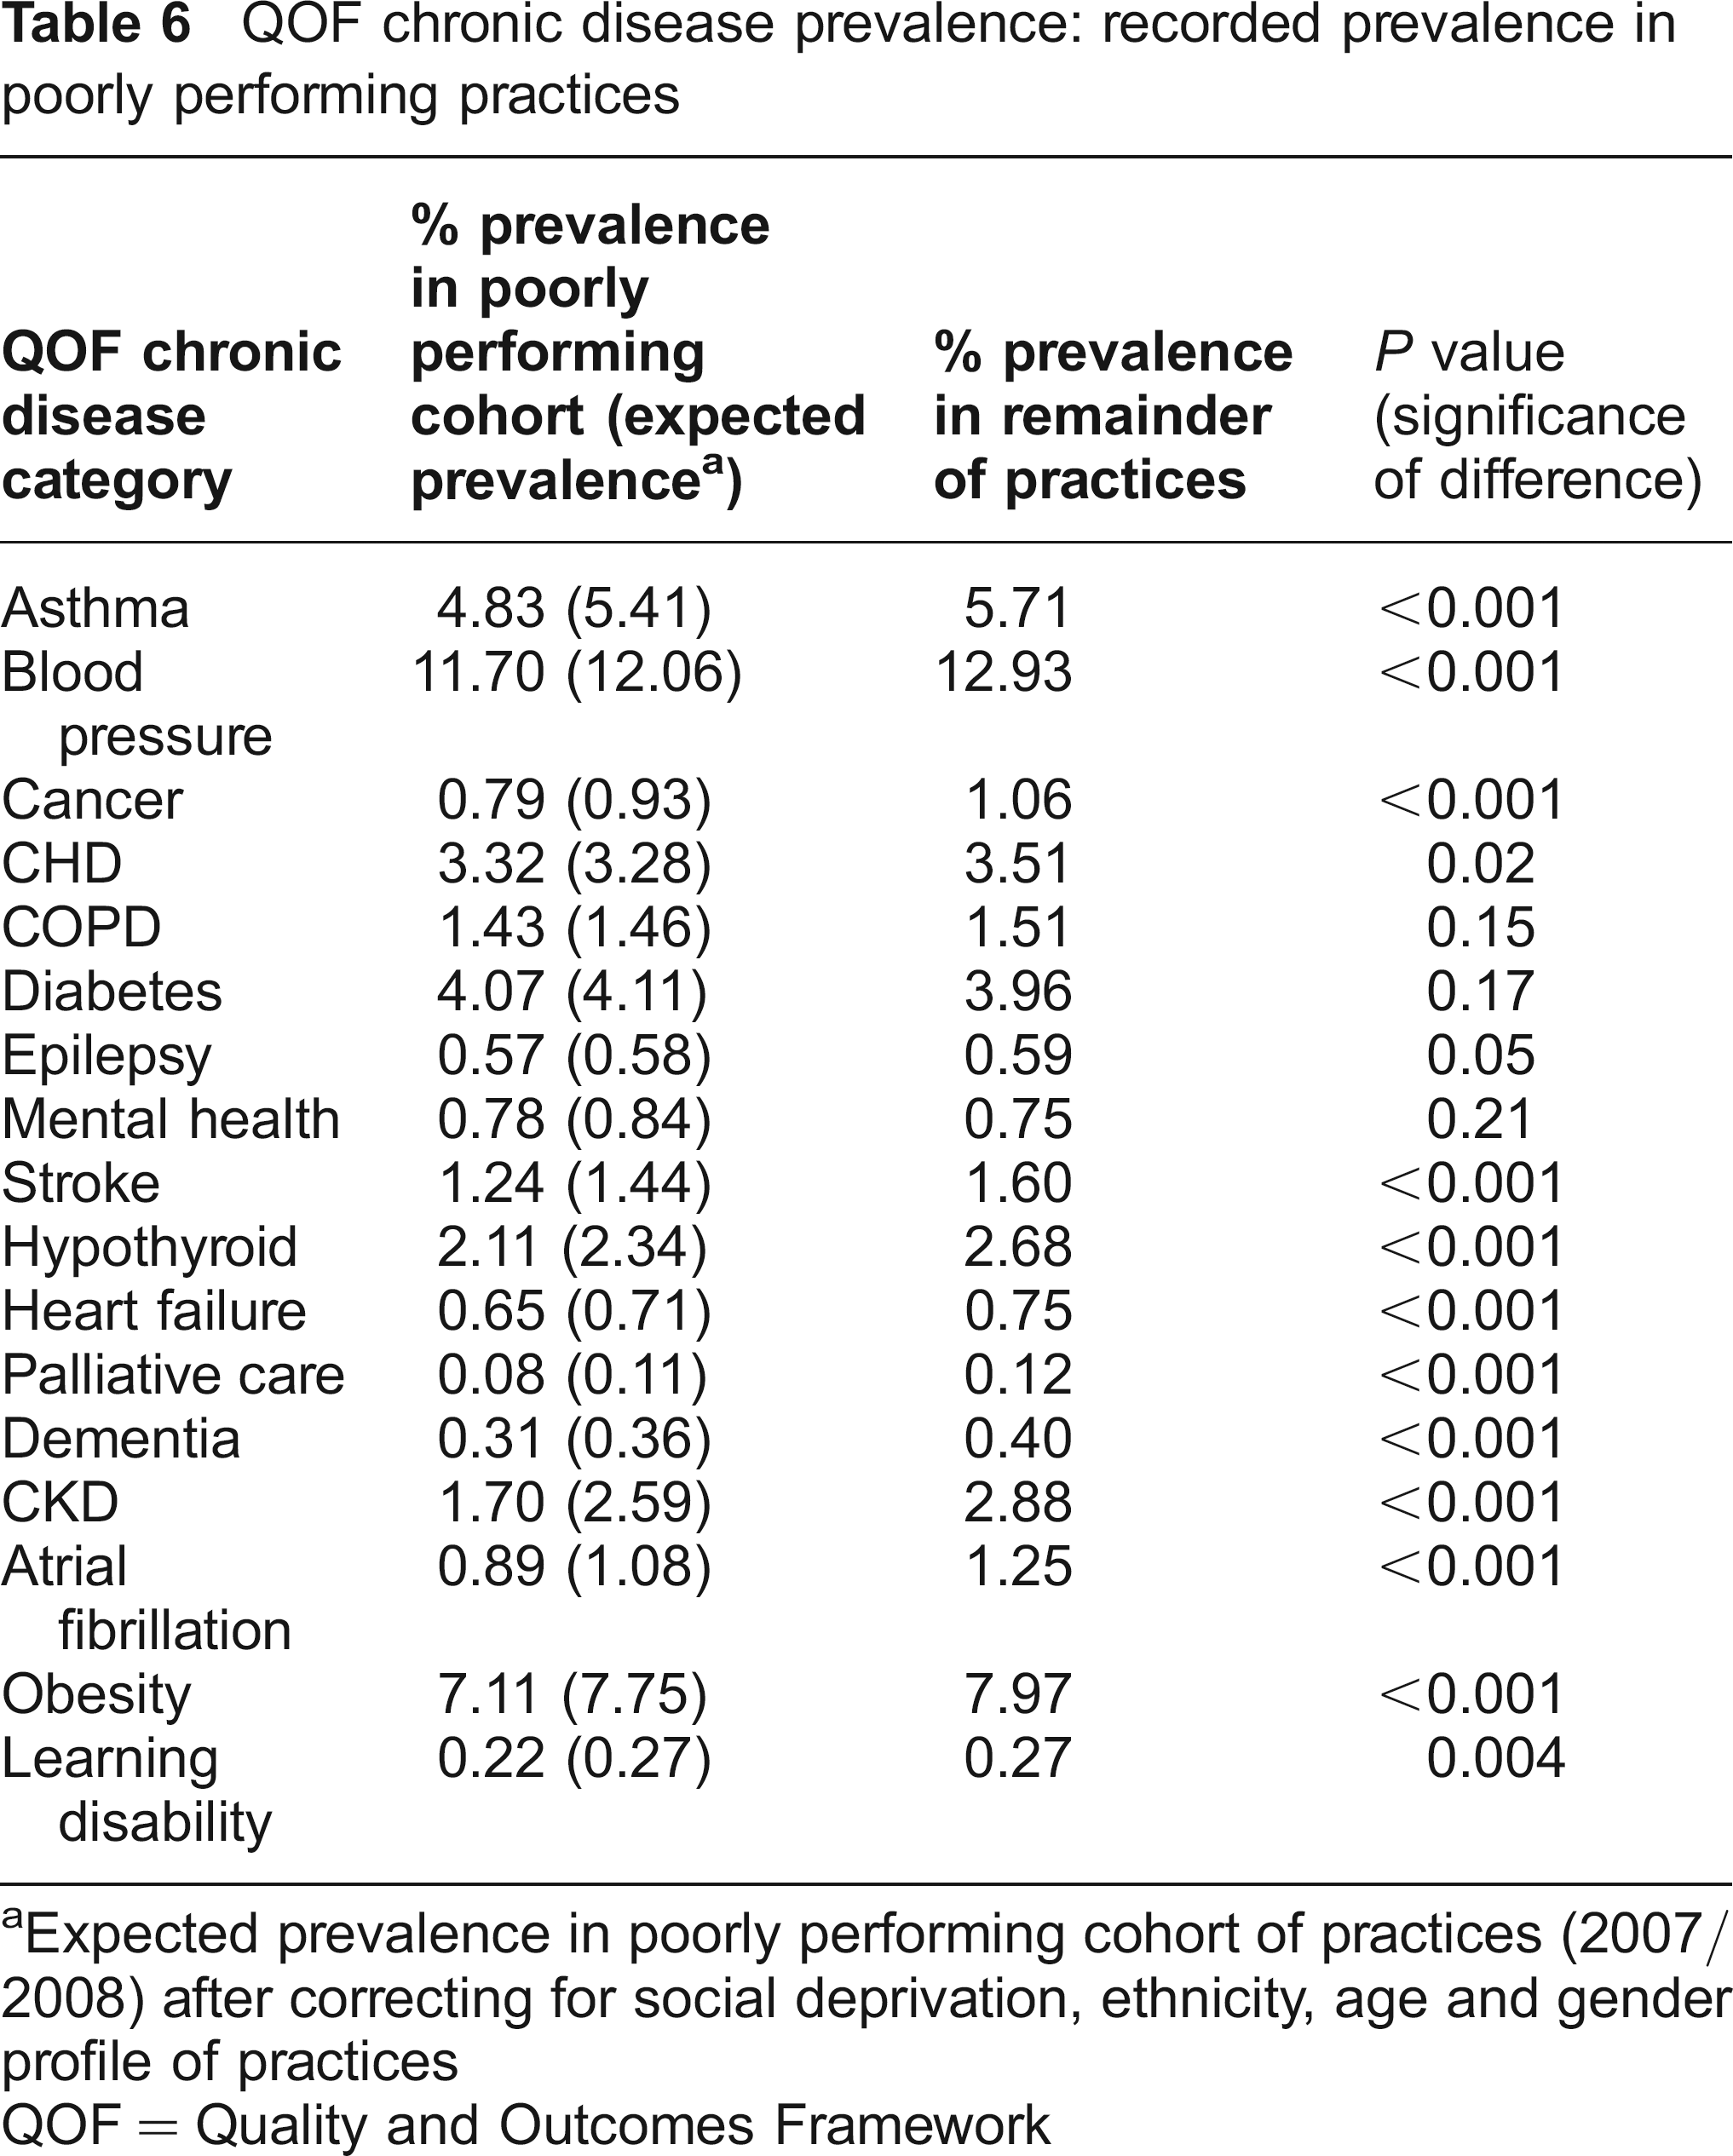
Expected prevalence in poorly performing cohort of practices (2007/ 2008) after correcting for social deprivation, ethnicity, age and gender profile of practices
QOF = Quality and Outcomes Framework
Discussion
Main Findings
We have defined a cohort of 212 practices (3% of all practices in England) which remained in the bottom decile of QOF performance during each of the first four years since the introduction of the QOF. Smaller practices (fewer full time equivalent GPs) and practices with older GPs were more likely to be ‘poor performers’; the association was strongest for singlehanded GPs and practices in which the average age of GPs was over 65 years. In spite of improvements over the last four years, the mean QOF score of these poorly performing practices still lags 165 QOF points behind the remaining practices.
Performance was unevenly diminished in the poorly performing cohort. Particular shortfalls were noted for indicators in the chronic disease categories of depression, psychotic illness, palliative care and epilepsy. Large shortfalls in individual targets were observed, particularly those relating to mental health issues or the demonstration of well kept clinical records containing clinical summaries, or ‘problem lists’.
Limitations
The main limitations of this study were the limitations of the QOF itself. Many criteria of excellence such as personal care and diagnostic skill are difficult to capture by any performance indicator, whereas some eminently measurable aspects of care quality are included in other performance measures but not in the QOF. 2 QOF performance is therefore only a snapshot of overall practice performance. Practices which appeared to be poorly performing in our study may have offered excellence in other domains of care which were not included in nationally reported data. In particular, there is evidence that singlehanded practices offer higher levels of access than group practices and offer a degree of continuity of care which few group practices can match. 7 Only qualitative studies involving visits to practices and interviews with staff and patients are likely to determine whether performance was globally or selectively diminished in the poor performers identified in our study.
Implications
This is the first study to report on the characteristics of practices performing consistently less successfully in terms of QOF achievement. True, poorly performing practices accounted for only a small proportion of all practices (although less stringent definitions would have substantially enlarged the cohort), but these practices provided the primary care for just over 700,000 registered patients. Patients are loath to change their GP 8 and there is no evidence that patients in poorly performing practices are more likely to register elsewhere. Breaking this deadlock will be difficult to achieve unless the process of informing patients and changing GPs is made easier for patients. Moreover, QOF performance did improve in the poorly performing practices over the four years of the study, but the remaining gap between these practices and national average scores in year four was substantial at 165 QOF points.
Previous regional studies have reported little or no difference in the clinical performance of singlehanded practices once the results were adjusted for confounding,9,10 but national studies have consistently demonstrated poorer achievement. 5 One option for improving reported quality achievement is to develop loose associations (forming networks) between small practices, but whether these can bring about quality improvement is not established. 11
The 2004 NHS Contract for GPs in England removed the requirement for GPs to retire at 70 years. 12 Our results question the wisdom of allowing elderly GPs to continue in practice without additional checks on the quality of their care, although we cannot be certain that alternative explanations, such as poor recording of performance, did not contribute to low scores in these practices. Future developments in primary care such as compulsory revalidation and practice accreditation may ensure that only practices offering high quality care will retain their NHS contract. Both processes are likely to emphasize professional values that are assessed by peer review and practice visits, rather than the data driven emphasis of the QOF. 13
Poor performance affected most aspects of QOF, but we have identified specific indicators which are particularly poorly delivered in the poor performance cohort, some of which may be remediable by specific interventions. More broadly, the shortfall in poorly performing practices was more organizational than clinical, suggesting that these practices may benefit from greater managerial input.
Poorly performing practices also reported lower than expected prevalence rates for common chronic diseases. Under-reporting of chronic disease raises concerns about the use of QOF-derived prevalence rates for resource allocation purposes (which could selectively disadvantage more deprived areas) and also for the quality of care provided to patients whose chronic disease has not been recognized or coded onto a clinical ‘problem list’ by the GP.
Finally, having identified a cohort of relatively long term poorly performing practices, the challenge for researchers is to identify successful interventions for transforming these practices, even when poor performance appears to be entrenched.