
Abstract
Objectives:
Health care budgets are finite and decisions must be made about which interventions to provide and, by implication, which will not be provided. The aim of this study was to investigate what features of health care interventions, including the type of health gain, are important to members of the public in England in making priority-setting decisions and to understand why.
Methods:
Q methodology was used with 52 members of the public in north east England. Respondents rank ordered 36 health care interventions from those they would give highest priority to through to those they would give lowest priority to. A form of factor analysis was used to reveal a small number of shared viewpoints.
Results:
Five factors emerged: ‘life saving to maximize the size of the health gain’, ‘everyone deserves a chance at life’, ‘(potential for) own benefit’, ‘maximum benefit for (perceived) lowest cost’ and ‘quality of life and social responsibility’. There were different views about which interventions should be given priority. Respondents considered not only the type of health gain received from an intervention as important, but also the size of the health gain, who received the health gain and an individual's personal responsibility.
Conclusions:
Aspects other than health gain need to be considered when soliciting the public's views of priorities for health care interventions.
Introduction
In the UK, quality-adjusted life-years (QALYs) have become an established measure of health outcome used in health care policy decision-making. The National Institute for Health and Clinical Excellence (NICE) has specified that QALYs should be included in submissions of technology appraisals for new interventions. 1 One of the main assumptions of the QALY is that people value the trade-offs between quality of life and life expectancy the same. That is, they value a gain of one QALY which comes from an extra one year in full health the same as a one QALY gain arising from 10 years during which quality of life is improved by only 0.1 in each year (where 0 is death and 1 is full health). As with other health technology assessment agencies, QALYs are assumed to be of equal value. However, outside of these agencies there has been a tradition of questioning this, especially since the Oregon experiment. 2
Studies which have attempted to estimate the monetary value of a QALY from members of the public indicate that the type of QALY gain is important, typically with higher values for scenarios which include a reduction in the risk of death and lower values for an improvement in quality of life only.3,4 Although the type of QALY gain is important to people, there is little evidence as to why this is the case.
Our aim was to investigate what features of healthcare interventions, including the type of health gain, are important to members of the public and to understand the reasons why.
Methods
Q methodology5,6 is used to study subjectivity, which can be described as an individual's views, opinions or beliefs on any given topic. 7 The starting point of any Q study is to develop the concourse which represents all of the possible views on the topic in question. 8 A set of statements (Q set) is derived from the concourse and provides the focus for data collection and analysis. Each individual respondent is asked to provide their point of view on the statements by rank ordering them (usually according to agreement). Following the Q sorting exercise, a form of ‘by-person’ factor analysis is conducted. This analysis groups together similar Q sorts to reveal a small number of underlying perspectives which are referred to as factors. A ‘composite’ Q sort can then be calculated to represent each factor. Through interpretation of the factors, rich descriptions of different points of view are generated. Q methodology was chosen because a study of priorities requires methods which involve rank ordering either explicitly or, by inferring an order at the aggregate level, based on respondents’ choices.
Developing the statements (the Q set)
Generally in Q studies the concourse consists of statements of opinion on a particular topic which can be collected from sources such as interview transcripts, academic or popular literature. 7 In this study the concourse consists of health care interventions currently provided by the National Health Service (NHS). To reduce this large concourse down to a smaller Q set a matrix was devised (Table 1). It was structured to make the Q set representative of the types and size of QALY gain people could get from health care interventions. Four categories of health care intervention are represented in the Q set: quality of life enhancing interventions, life extending interventions, interventions which improve both quality of life and life expectancy; and life saving interventions. Life saving interventions are defined as treatments which if not provided would result in premature death (though in the long term no intervention is life saving). Life extending interventions in this study are those which give small reductions in the risk of death each year, which over the long-term would lead to a longer life expectancy. The size of the health gain was also included in the statements and the magnitude of QALY gains was available for just under half of the interventions. The type of disease was not specifically included in the matrix, but when choosing the interventions an attempt was made to cover a large number of disease areas, including some that were likely to be less familiar. As the statements in this study were not of the traditional discursive form, they will be referred to as items.
Q set matrix
QALY = quality-adjusted life-years
Once the matrix structure had been established a number of sources were used to obtain information for the Q set. As a starting point, a general practitioner provided suggestions. To supplement this and to supply information on the size of the health gain for each of the interventions, a search of the clinical guidelines produced by NICE and the NHS Health Technology Assessment Programme was undertaken.9,10 The aim was to select interventions to achieve an equal number of items representing the four types of health gain. However, information on the size of the QALY gain was limited for the life extending interventions and the interventions which improve quality of life and life expectancy. A total of 36 interventions were included in the Q set. Each item was printed on a card in a standard format, including an item number which was used for data recording purposes (Figure 1).
Example Q item
Each card was ‘labelled’ with the name of the healthcare intervention, the condition in question and a brief explanation in lay terms. The impact of the intervention on quality of life and life expectancy was detailed on each card together with the size of the health gain in terms of the number of QALYs generated for the average patient over their remaining lifetime.
Sample (the P set)
Sample selection in Q methodology has much in common with qualitative sampling techniques. People are sampled purposively in relatively small numbers from those who are likely to hold different views. Analysis reaches saturation when no new views are expressed, with 40–60 respondents typically being sufficient. 6 A local social research company was contracted to recruit a sample of members of the public in north east England which was roughly balanced across age groups, employment status and sex (Table 2). All respondents received £20 at the end of the session.
Sample characteristics
Conducting the Q sort
The Q sorts were conducted through a series of 10 groups consisting of between two and eight people per group. At the beginning of each group, participants were told that the NHS operates with a limited budget therefore choices have to be made about which treatments to provide. As each item also provided information on the size of the QALY gain from treatment, an introduction to the concept of QALYs and how they are calculated was presented. The study was set up as a societal problem with participants asked to consider the normative question of what interventions should be given priority while considering that the NHS operates within a fixed budget. Respondents were free to consider how prioritizing the interventions might affect them personally, their immediate families and society more widely. No attempt was made to restrict their perspective to either an individual or a citizen perspective since public values are likely to incorporate all of these. To begin the Q sort each participant was given the pack of 36 cards (Table 3). They were asked to read through each of the cards and sort them into three initial categories: those interventions they would give highest priority, those they would give lowest priority and those about which they were less sure.
Q items and factor arrays (F1-F5)
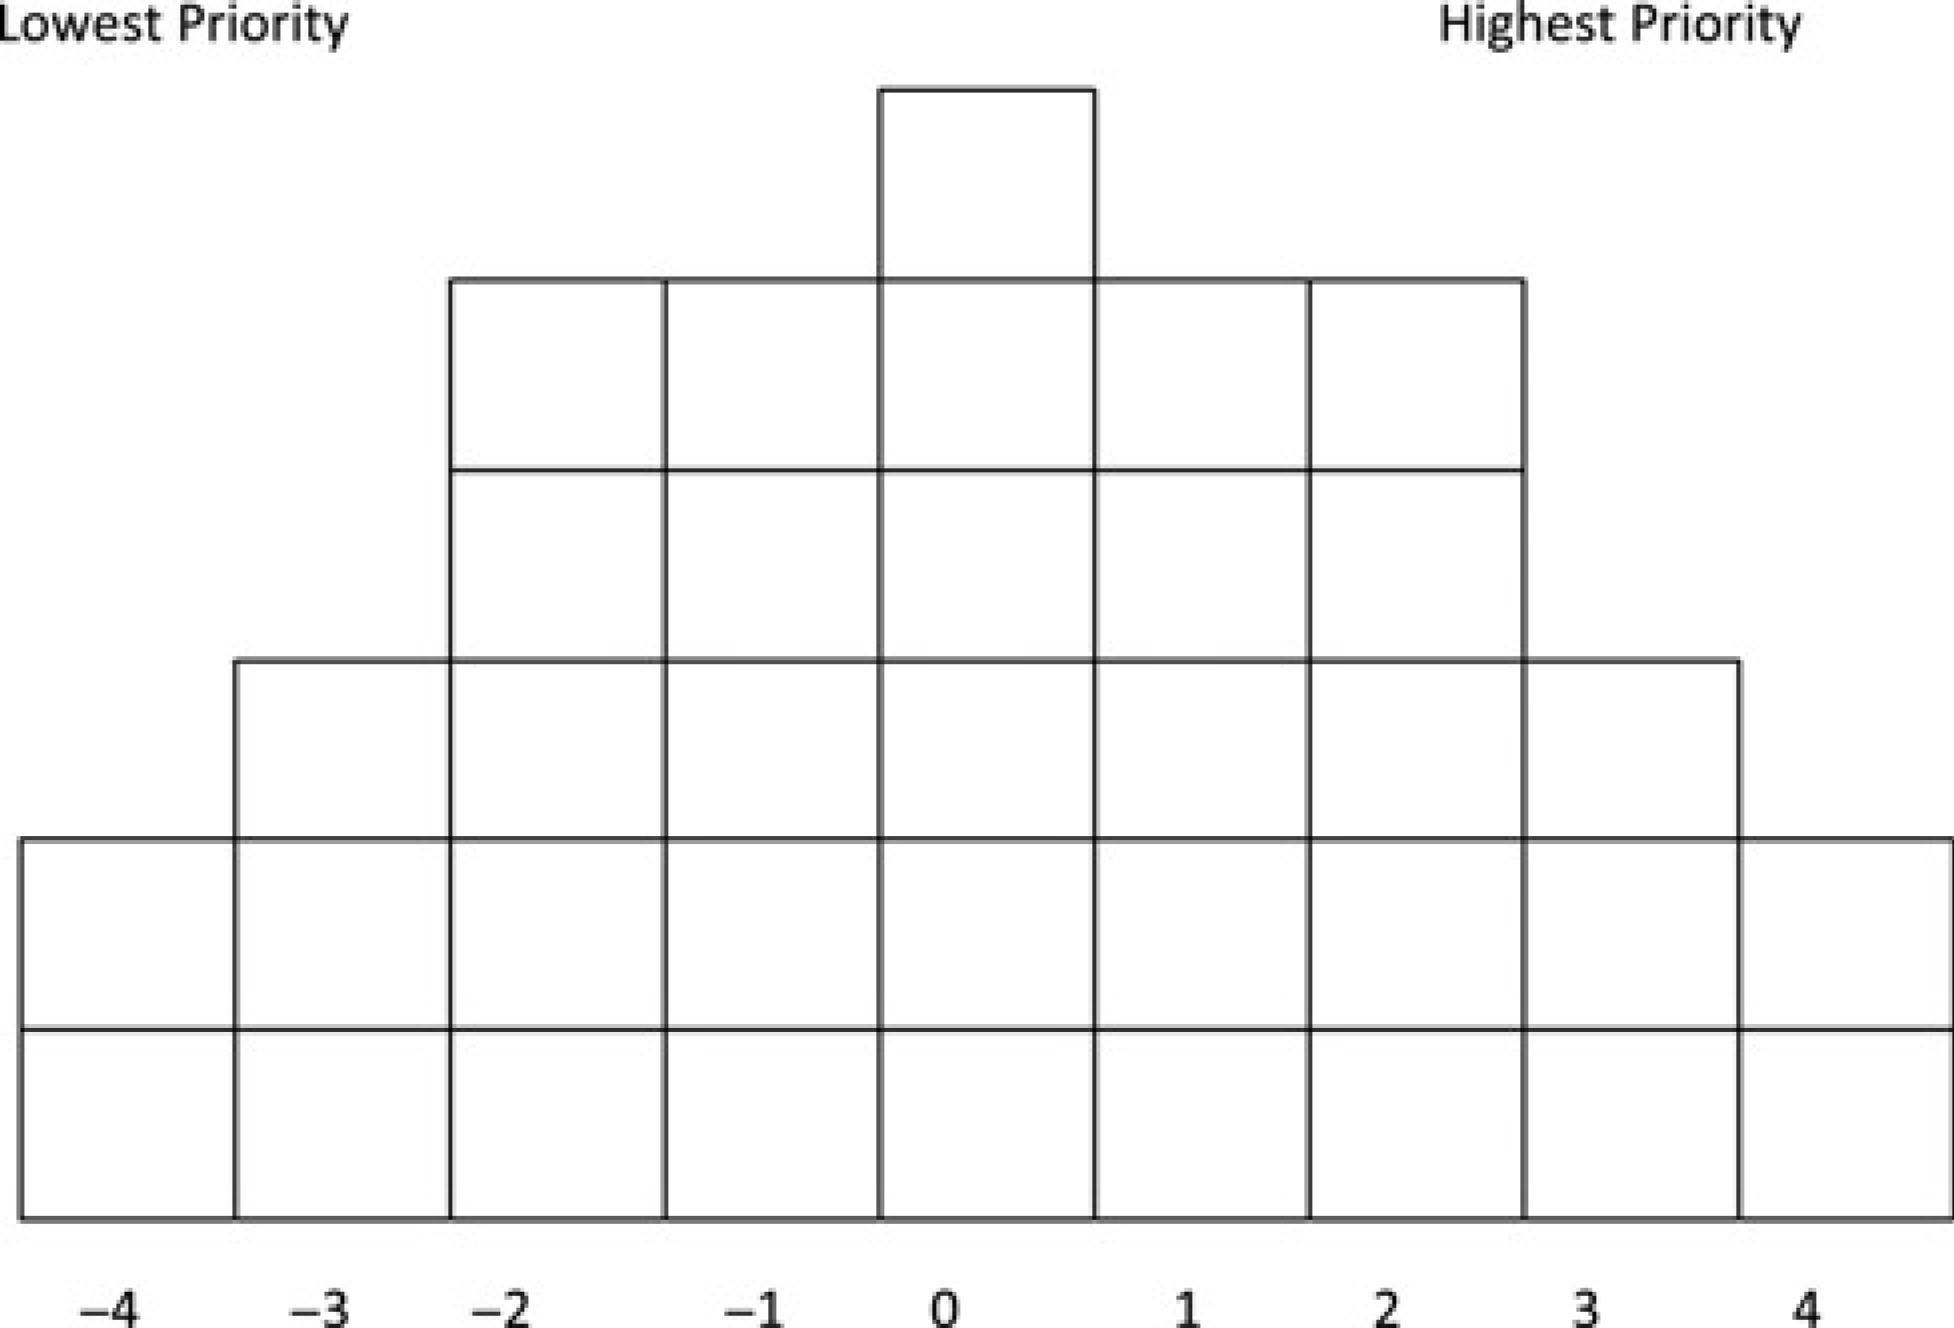
Once the initial sort was completed the participants were asked to rank order the items using the Q sorting grid (Figure 2). The grid ranges from +4 (highest priority) through to -4 (lowest priority). It takes the form of a quasi-normal distribution with fewer items placed in the tails of the distribution. Participants were then directed to record their final sorts on a response sheet which was printed with a small reproduction of the sorting grid and participants transcribed the item numbers according to their Q sort. They also provided some written comments giving reasons why they had placed the cards in the +4 and -4 positions and any other general comments.
Q grid
Participants took around 45 minutes to complete their sort. Once all participants had completed the exercise a short group discussion was facilitated by the researcher to gain a better understanding of their views. Participants were first asked to give general comments on the exercise before moving on to more specific questions about the placing of items, especially those at the extremes of the distribution. While participants commented on each other's views, no changes to the Q sorts were made as a result of the discussion. The discussion was audio recorded and this was used to aid the interpretation of the factors.
Analysis
Factor analysis was used to identify a small number of ‘shared viewpoints’. The degree to which an individual agrees with the factor is given by their factor loading which is essentially a correlation coefficient, takes a value between -1 and +1, and represents the degree to which each Q sort is (dis) similar to each factor. 11 Factors are represented by a factor array, which is a composite Q sort 7 based on the average of the scores (i.e. +4 to -4) given to an item by all of the defining Q sorts. These are Q sorts which are both significant for the factor (in this study this is a factor loading over 0.41 - an explanation of how this is calculated is shown Appendix 1 (available online only at: http://www.jhsrp.rsmjournals.com/cgi/content/full/16/2/81/DC1/) but not significant on any other factor. These scores are then weighted to reflect that some Q sorts are more highly associated with a factor than others. 11 A factor array can be laid out for each factor using the original sorting grid by placing each item in the spaces on the grid as an aid to interpretation. 8 Analysis was conducted using PQMethod 2.11. 12 Principal components analysis was followed by varimax rotation to derive the factors.
Results
The characteristics of the 52 people who took part are presented in Table 2. A range of factor solutions based on two to five factors were explored. A five factor solution was chosen even though the fifth factor has only four significant Q sorts (and two defining sorts) because it provided a solution that was most consistent with the views expressed by those participants based on their comments during group discussions and the brief written summaries they provided. Three and four factor solutions did not allow this account to emerge. The factor arrays for all five factors are presented in Table 3. The factor loading for each participant on each of the five factors is shown in Appendix 1.
Factor 1: ‘life saving to maximize the size of the health gain’
Interventions which were described as life saving were given highest priority in Factor 1 on the basis that they give the largest health gain in terms of the number of life years gained. This focus on the size of the health gain that would be received from a treatment is reflected in the comments provided by the respondents during the post-sort discussion and in their written comments:
Renal replacement therapy can help a sick patient to have more life years (ID4, female, age 29)
[Referring to neonatal intensive care] babies have potentially their full life ahead of them so saving 79 years (ID42, female, 43)
The rule-of-rescue was another feature of the life saving interventions which was important to this factor. Treatments that would be conducted as an emergency or needed to be done urgently were given higher priority (appendectomy +2; salpingectomy -3). Similarly interventions which were deemed to be non-urgent or pose no immediate threat to patients were given lower priority by this factor.
Culpability is also a key issue for this factor, with interventions which could be caused by the patient's lifestyle given low priority (Orlistat -4; counselling for alcoholism -4). Lifestyle diseases are seen by respondents associated with this factor as being in the control of the patient:
Because smoking and obesity are in the control of most individuals (ID42, female, 43)
Everybody knows about the negative effects of drinking alcohol so they should know how much they have drunk and how to [stop] drinking (ID4, female, 29)
Related to this issue of control was the perception that these interventions (or alternatives to them) are available outside of the NHS and that patients should pay for such treatments themselves.
Factor 2: ‘everyone deserves a chance at life’
This factor is also concerned with life saving but with a focus on the age of patients. Children are given priority for two reasons: they would receive the greatest increase in life expectancy (maximizing benefit) and they ‘deserve a chance at life’.
Neonatal intensive care and ectopic pregnancy are highest priority simply because highest priority has to go to the youngest patients because everyone deserves a chance at life (ID25, male, 22)
Priority goes to children – anything which has the greatest increase in life expectancy must be prioritized (ID48, male, 21)
Like Factor 1, culpability is important with treatments for alcoholism and obesity in the -4 position and higher priority has been given to interventions for diseases where the patient had no control over the cause of the disease. Thus, inherited diseases such as cystic fibrosis and sickle cell anaemia have positive scores and are both distinguishing items for this factor.
Children were regarded by many participants as blameless for their illness which contributed to the focus on interventions for the young being given highest priority;
The treatments are for children that are not to blame for their illness and have their whole life ahead of them (ID28, female, 22)
The 18 participants who load onto this factor had a median age of 22 years and eight of the respondents with significant loadings on Factor 2 were students. Although Q studies are not designed to be representative across populations and are based on small numbers, it is possible that there is some relationship between the low age of the group and the focus on young people in the factor array. However without a subsequent study of a representative population sample it is not possible from the data available to make a more conclusive link.
Factor 3: ‘(potential for) own benefit’
Factor 3 is concerned with the personal experiences of respondents and the people around them. The focus is on interventions from which they believe they would benefit personally. The type of QALY gain appears not to be important. Rather the type of disease plays a more important role in the decision. Four of the interventions given highest priority were for heart disease and several respondents’ comments indicate that they feel they would benefit either now or in the future from the provision of heart disease interventions,
Having heart problems, I feel they take the most problems and are required for myself [referring to item 15] (ID35, male, 57)
At 72 two areas [Alzheimer's and arrhythmias] where I might need help the most (ID33, male, 72)
Although the general theme of the factor is on the personal benefit that would be received from treatment, one participant did indicate that treatments for heart disease should be provided as it was likely to affect a large number of people in society
Probably the biggest potential killer diseases affecting large numbers of people? [referring to items 5 and 31] (ID31, male, 66)
The focus on heart disease may also be linked to the age range of the participants who have high factor loadings on this factor. The average age of the respondents is 59 years with a median age of 66 years which is notably higher than any of the other factors. Higher priority has been given to interventions for cancers, Alzheimer's disease as well as heart disease all of which predominantly affect older people in society.
Like Factors 1 and 2, lower priority was given to interventions which were seen to be self inflicted and participants thought that treatment could be sought outside the NHS. An individual perspective was also adopted with regard to lower priority interventions as is shown in the comments,
Smoking and alcoholism at the bottom as I don't drink or smoke. I just bought a new car as I don't drink (ID8, male, 82)
A somewhat unusual feature of Factor 3 is the positioning an intervention for sudden infant death syndrome in the -4 position. This is a distinguishing item for this factor (0, +3, -4, +3, 0). However, it is difficult to be clear on the reasons for the positioning of this item from the qualitative comments provided. Item 33, salpingectomy for ectopic pregnancy (+3, +2, -2, 0, +2), is also distinguishing for Factor 3. There may be a link between the positioning of this card, the individualistic approach of these respondents and the demographics of the participants who load onto this factor, but it is not possible to be sure.
Factor 4: ‘maximum benefit for (perceived) lowest cost’
Factor 4 was concerned with use of NHS resources to benefit the maximum number of people. Treatments which respondents considered best value for money are given priority in this account despite the fact that no information is given on the cost of each item.
The items which are ranked highest for this factor relate to diseases which affect large numbers of the population but where the intervention is likely to be lower cost,
Based on straightforward low cost for maximum benefit. Acute MI, appendicitis are straightforward and affect many (ID40, male, 38)
However, no discussion was given to the overall health care budget and how, if many people are affected, the overall budget may have to be increased. The focus appears to be on using low cost per person technologies even if the overall cost is higher than for a high cost intervention used by a smaller percentage of the population. This is further evident in the positioning of air ambulances in the factor array in the -4 position which is a distinguishing item for Factor 4 (0, +3, +1, -4, +2). Many of the participant comments expressed the high cost element of the air ambulance and the number of people they would help,
Lowest priority is to air ambulance as the number of people benefiting would be small and very expensive (ID29, male, 67)
This concern about the costs of treatments was also used as an argument for preventive treatments. Influenza vaccine (-1, 0, -1,
There is no discussion in this account of self infliction or blame. So called ‘lifestyle diseases’ are given high priority which differentiates this from previous factors,
Don't think alcoholism is self-inflicted, [it] probably doesn't cost very much [to give the advice] and can probably make a big difference (ID1, male, 37)
The placing of counselling for alcoholism reflects this view receiving a positive score compared with factors 1, 2 and 3 (-4, -4, -4,
Factor 5: ‘quality of life and social responsibility’
The size of the health gain is less important in this factor and quality of life carries more weight than in any of the other factors. Personal experiences of the participants with high loadings on this factor have also influenced their Q sorts.
There is a mixture of quality of life enhancing and QALY gaining interventions in the highest priority section of the Q grid. Of the life saving interventions, only the air ambulance was ranked in the top two columns by this factor. The importance of quality of life was emphasized by one participant commenting on item 18,
Quality of life is very important. Alzheimer's is likely to become a large problem as more of us live longer. Long life expectancy with Alzheimer's is grim for everyone (ID34, female, 38)
However, a number of quality of life enhancing interventions have been given lower priority. The participants’ comments suggest that they made some kind of judgement about the societal value of treatments for varicose veins and Viagra which were regarded as cosmetic or unimportant.
A distinguishing item for this factor is smoking cessation for chronic obstructive pulmonary disease (COPD) (-3, -3, -2, +4,
Interventions earlier on are more important to prevent obesity in the first place. Society definitely does have a duty to address the consequences as high priority (ID34, female, 38)
Discussion
People take account of the type of health gain which arises from treatment when making judgments about which interventions to prioritize but there are also other issues which are important to them. Gains associated with life saving interventions are valued more highly than those which are life extending or quality of life enhancing. There are two explanations for prioritizing life saving interventions, both of which are familiar from the health economics literature. The first relates to health maximization and interventions which yield the greatest health benefits are prioritized. The maximization of health gain is generally viewed as one of the main objectives of the health-care system. 13 The second account takes a ‘fair innings’ view 14 with priority given to life saving interventions for younger people who were seen not to have had a fair chance at life. This preference for younger people has also been expressed in a number of other studies.15–17 Although other studies have found that members of the public prioritized life saving interventions the explanation as to why they are given priority has generally been based on a rule of rescue argument. 18 Our results indicate two other reasons for preferring life saving interventions which may be related to the type of interventions presented in the Q set.
An issue which has become increasingly prominent in England is whether treatments which provide small increases in life expectancy for patients with terminal illness should be provided. These interventions are often portrayed as life saving interventions as they are for people whose death can be considered premature. A policy debate on whether these interventions should be provided is ongoing and NICE has recently relaxed its guidance on cost-effectiveness for these types of interventions. 19 While our results show that, to some people, life saving interventions are regarded as more important, caution must be used in making comparisons between the types of life saving interventions we used and those currently being considered by NICE. The interventions we used produce health gains which are much larger than those which are subject to consideration by NICE, where benefits are often a gain in life expectancy of only a few months. The size of the health gain is important in distinguishing between life saving interventions and all other interventions.
Personal responsibility was important for three of the factors, with counselling for alcoholism and smoking cessation for COPD given low priority. In contrast the other two factors were more concerned with social responsibility, leading to the same interventions being given high priority. This inconsistency on the issue of culpability is not surprising. There is mixed evidence within the literature regarding the extent to which a person's lifestyle should influence whether they receive treatment. Studies which have examined preferences for treatment for people with liver disease results have found that there is a preference for giving lower priority to patients whose illness was as a result of their lifestyle.20,21 However, in the case of liver disease the issue of culpability maybe confounded by the fact that treatment is generally a transplant where there is insufficient supply. Therefore this result may not be seen when looking at other disease areas in which there are more treatment options. More mixed results have been reported in studies which look at the general principles relating to culpability.18,22 One study found that respondents did not think that patient lifestyle should be taken into account when asked to consider the principles the health service should use when deciding on how resources should be allocated though this difference may be related to the different type of statements used. 22
We decided that the name of the disease and the interventions should be included in the item description rather than presenting generic, unlabelled interventions. This was to enable respondents to identify with the interventions and to try and prevent respondents making different assumptions about what the intervention might be. This may have resulted in a labelling effect, with diseases that were more familiar to the respondents being seen more in the tails of the distribution and therefore also more prominent in the group discussion while those interventions which were less familiar being seen more in the middle of the distribution. It was important to cover a wide range of disease areas to try and make respondents aware that decisions have to be made about all interventions in reality. At the end of the Q sort many respondents commented that they found the exercise challenging which may also have resulted in those interventions with which they were most familiar being placed in the tails of the Q grid.
As part of the general introduction the issue of priority-setting within the NHS was posed as a societal problem thus veering respondents towards a citizen perspective, although people could take a more selfish perspective. It was important not to constrain the perspective from which people conducted their sort as when thinking about their views on health policy respondents are citizens, individuals, family members and potential patients.
Our results provide information to those who wish to use the views of members of the public in prioritizating lifesaving interventions and discussions about personal responsibility. These results need to be confirmed in a large, nationally representative sample.
Footnotes
Acknowledgements
Helen Mason is supported by an ESRC post doctoral fellowship (grant number PTA-026-27-1555). Cam Donaldson is an NIHR Senior Investigator.