
Abstract
Objectives:
Health funders face the challenge of determining the appropriate level of surgeon fees in fee-forservice schemes. A resource-based relative value scale (RBRVS) attempts to identify the fees that would exist in a competitive market. Private insurance providers in New Zealand do not use a RBRVS but rather rely on a market. We explore the extent to which private surgeon fees in New Zealand are consistent with fees that would be generated by a RBRVS.
Methods:
Data on 155,290 surgical procedures from 2004-06 were provided by New Zealand's largest private health insurer. 314 procedure codes were matched to the Australian Ministry of Health and Ageing's RBRVS. A random effects model determined predicted surgeon reimbursements based on the RBRVS, the location and the year. Procedure volume and specialty were explored as potential sources of deviations.
Results:
The RBRVS, location and year explain 79% of the variation in surgeon fees. After accounting for the RBRVS, location and year, no statistical differences were found between five out of the seven specialties, but higher volume procedures were associated with lower fees. There was some evidence that the model explained less variation in lower volume procedures.
Conclusions:
Surgical fees were generally consistent with those predicted by the RBRVS. However, the fees for high volume procedures were relatively lower than predicted while the fees for low volume procedures appeared more variable. The findings are consistent with the hypothesis that market forces lowered prices for procedures with higher volumes. This has implications for how health funders might determine private surgical fees, especially in mixed public-private systems.
Introduction
Although New Zealand has a predominately public health system, nearly 30% of all individuals have private health insurance1,2 and approximately 33% of all surgical procedures are performed in the private sector. 3 Because surgeons working in the private health sector charge their patients on a fee-for-service basis, the challenge facing insurers, the public and surgeons is to identify fees that reflect the time required to perform the operation and peri-operative care, the resources required to support and deliver the service, the level of expertise and training required to perform the surgery, the degree of risk associated with the procedure and a reasonable return to the surgeon.
Other countries, most notably the USA4–6 and Australia, 7 have responded to the fee-for-service environment by developing relative value scales (RVS) for surgical fees. RVSs assign each procedure a number of relative value units (RVUs) based on the work required (time, mental effort, clinical judgment, technical skill and physical effort under stress), the relative practice costs, the opportunity cost (lost income due to time in training), and the cost of malpractice insurance. The final fee is determined by multiplying the RVU by a conversion rate (e.g. NZ$50 per unit), subject to some adjustments. 8 The intent is to develop a transparent payment system that reflects the inputs required for each procedure, provides an equitable system for determining fees and, via the adjustments, controls overall spending.
In contrast, the private sector in New Zealand operates essentially as a free market with no RVS or direct interference from the government. While insurance companies publish schedules of historical fee ranges for each procedure and the reimbursement available to those insured, 9 surgeons and specialists are free to submit any fee to patients (which the insurer can then either accept, reject or reimburse in part). Thus, New Zealand provides an interesting setting in which to investigate whether market-generated fees for specialist services are consistent with factors identified in the RVS. If so, then implementing a resource-based pricing mechanism in countries with a private health system might be redundant as fee levels might already reflect economic fundamentals. An alternative possibility, however, is that fees deviate from the RVS according to factors such as the procedure volume or specialty. This may provide evidence that a market mechanism is problematic for determining surgeon fees.
Although no RVUs have been developed for New Zealand, the Australian Ministry of Health and Ageing (hereafter MHA) recently engaged in an extensive process to develop RVUs for Australia. In this study we matched fees charged by surgeons from data provided by Southern Cross Medical Care Society (Southern Cross), New Zealand's largest private insurer, with the corresponding Australian RVUs for the procedure. We hypothesized that where there is competition among specialists for private surgical services, reimbursements would be consistent with the RVUs developed for a similar health system (Australia). The purpose of this paper is to examine the extent to which the market-generated fees charged by private surgeons and specialists in New Zealand are consistent with those suggested by the Australian RVS and the extent to which procedure volume and specialty are associated with deviations.
Methods
Data
Data on fees charged by surgeons for 155,290 surgeries from 2004–06 were obtained from Southern Cross. The dataset includes 314 different procedures from seven different specialties: general surgery, gynaecology, ophthalmology, orthopaedics, otolaryngology, peripheral vascular surgery, and urology. A procedure refers to a therapeutic or a surgical procedure such as a laparo-scopic cholecystectomy, while an individual surgery refers to a single patient undergoing a procedure. The dataset included: fee charged by surgeon for the surgery; location (city or region) where surgery took place; and Southern Cross procedure code for surgery.
The location categorized into metropolitan areas (Auckland, Christchurch, Waikato, Wellington) or rural areas (other north island or other south island). There were 55,468 individual surgeries where the location was unknown. In these cases, the location was assigned according to where the surgeon normally worked. We determined the yearly procedure volume directly from the data.
MHA relative value units
A committee consisting of representatives from the Australian MHA and the Australian Medical Association (AMA) led the development of the RVS for Australia. The resulting RVUs ranged from less than one to around 40. The level of fee for a given procedure was to be determined by multiplying the number of RVUs by a conversion factor (which might change annually to reflect general inflation or other common factors):

Linking Australian MHA procedure codes to Southern Cross procedure codes
There were 848 procedure codes in the Southern Cross dataset, with many procedures performed only sparingly (e.g. less than five occurrences in the data set) and other procedures having over 10,000 observations. In order to obtain a representative sample of procedures, a sampling method was adopted whereby procedures were sorted by specialty and number of times they occurred in the dataset (volume strata of 0-25, 26-50, 51-100, 101-300, 301-1,000, and 1,000+). Southern Cross procedure codes were matched to the Australian MHA procedure codes based on a stratified approach with the goal of matching 35% of the procedures in each stratum. This ensured that the sample of procedures was representative across specialty and volume.
The matching of procedure codes was performed by an experienced surgeon (JW) based on publicly available descriptions of the procedures and clinical knowledge. The resulting matches were reviewed by a senior medical coder from Southern Cross for verification. Discrepancies, when they arose, were resolved by the respective parties. If it was determined that no match existed or no consensus in discrepant ratings could be reached, the code was not used in the analysis. After reviewing the codes, the results were found to be sensitive to the inclusion of four procedures with the largest RVUs (1% of the total). These four procedures were determined to be outliers and not included in the analysis. Therefore, the data presented included 310 procedures (155,266 surgeries).
Analytic methods
As per equation (1), the extent to which the Australian RVUs are consistent with surgical fees was examined using two different models. First, at the individual fee level, a linear mixed effects two-way multilevel model, with a random effect for procedure (i) and a fixed effect for year (t) was used with a generalized least squares estimator. This model takes advantage of the natural data structure that individual fees are clustered within procedures to produce efficient estimates. The estimation yields observed procedure level RVU and specialty effects that are unbiased. The analysis was repeated at the procedural level (n = 310) using ordinary least squares on the procedure average of each variable (also known as the between effects estimator). Therefore, all procedure level analysis used the mean procedure surgeon fee and yearly volume, along with the percentage of individual surgeries per procedure that took place in each location and in each year. Unlike the individual-level analysis, the procedure-level analysis gave equal weight to each of the 310 procedures. The above two models were used to examine the impact of RVU on surgeon fees controlling for regional (Auckland, Wellington, Waikato, other north island and other south island compared with Christchurch) and time effects. Yearly volume and the interaction of volume and RVU, along with specialty effects were added to identify systematic differences in fees from the RVUs across specialties and by volume of procedures. Finally, a hypothetical financial impact of switching pricing mechanisms was examined by calculating deviations of the actual fees from a predicted RVU fee.
Results
Summary of data
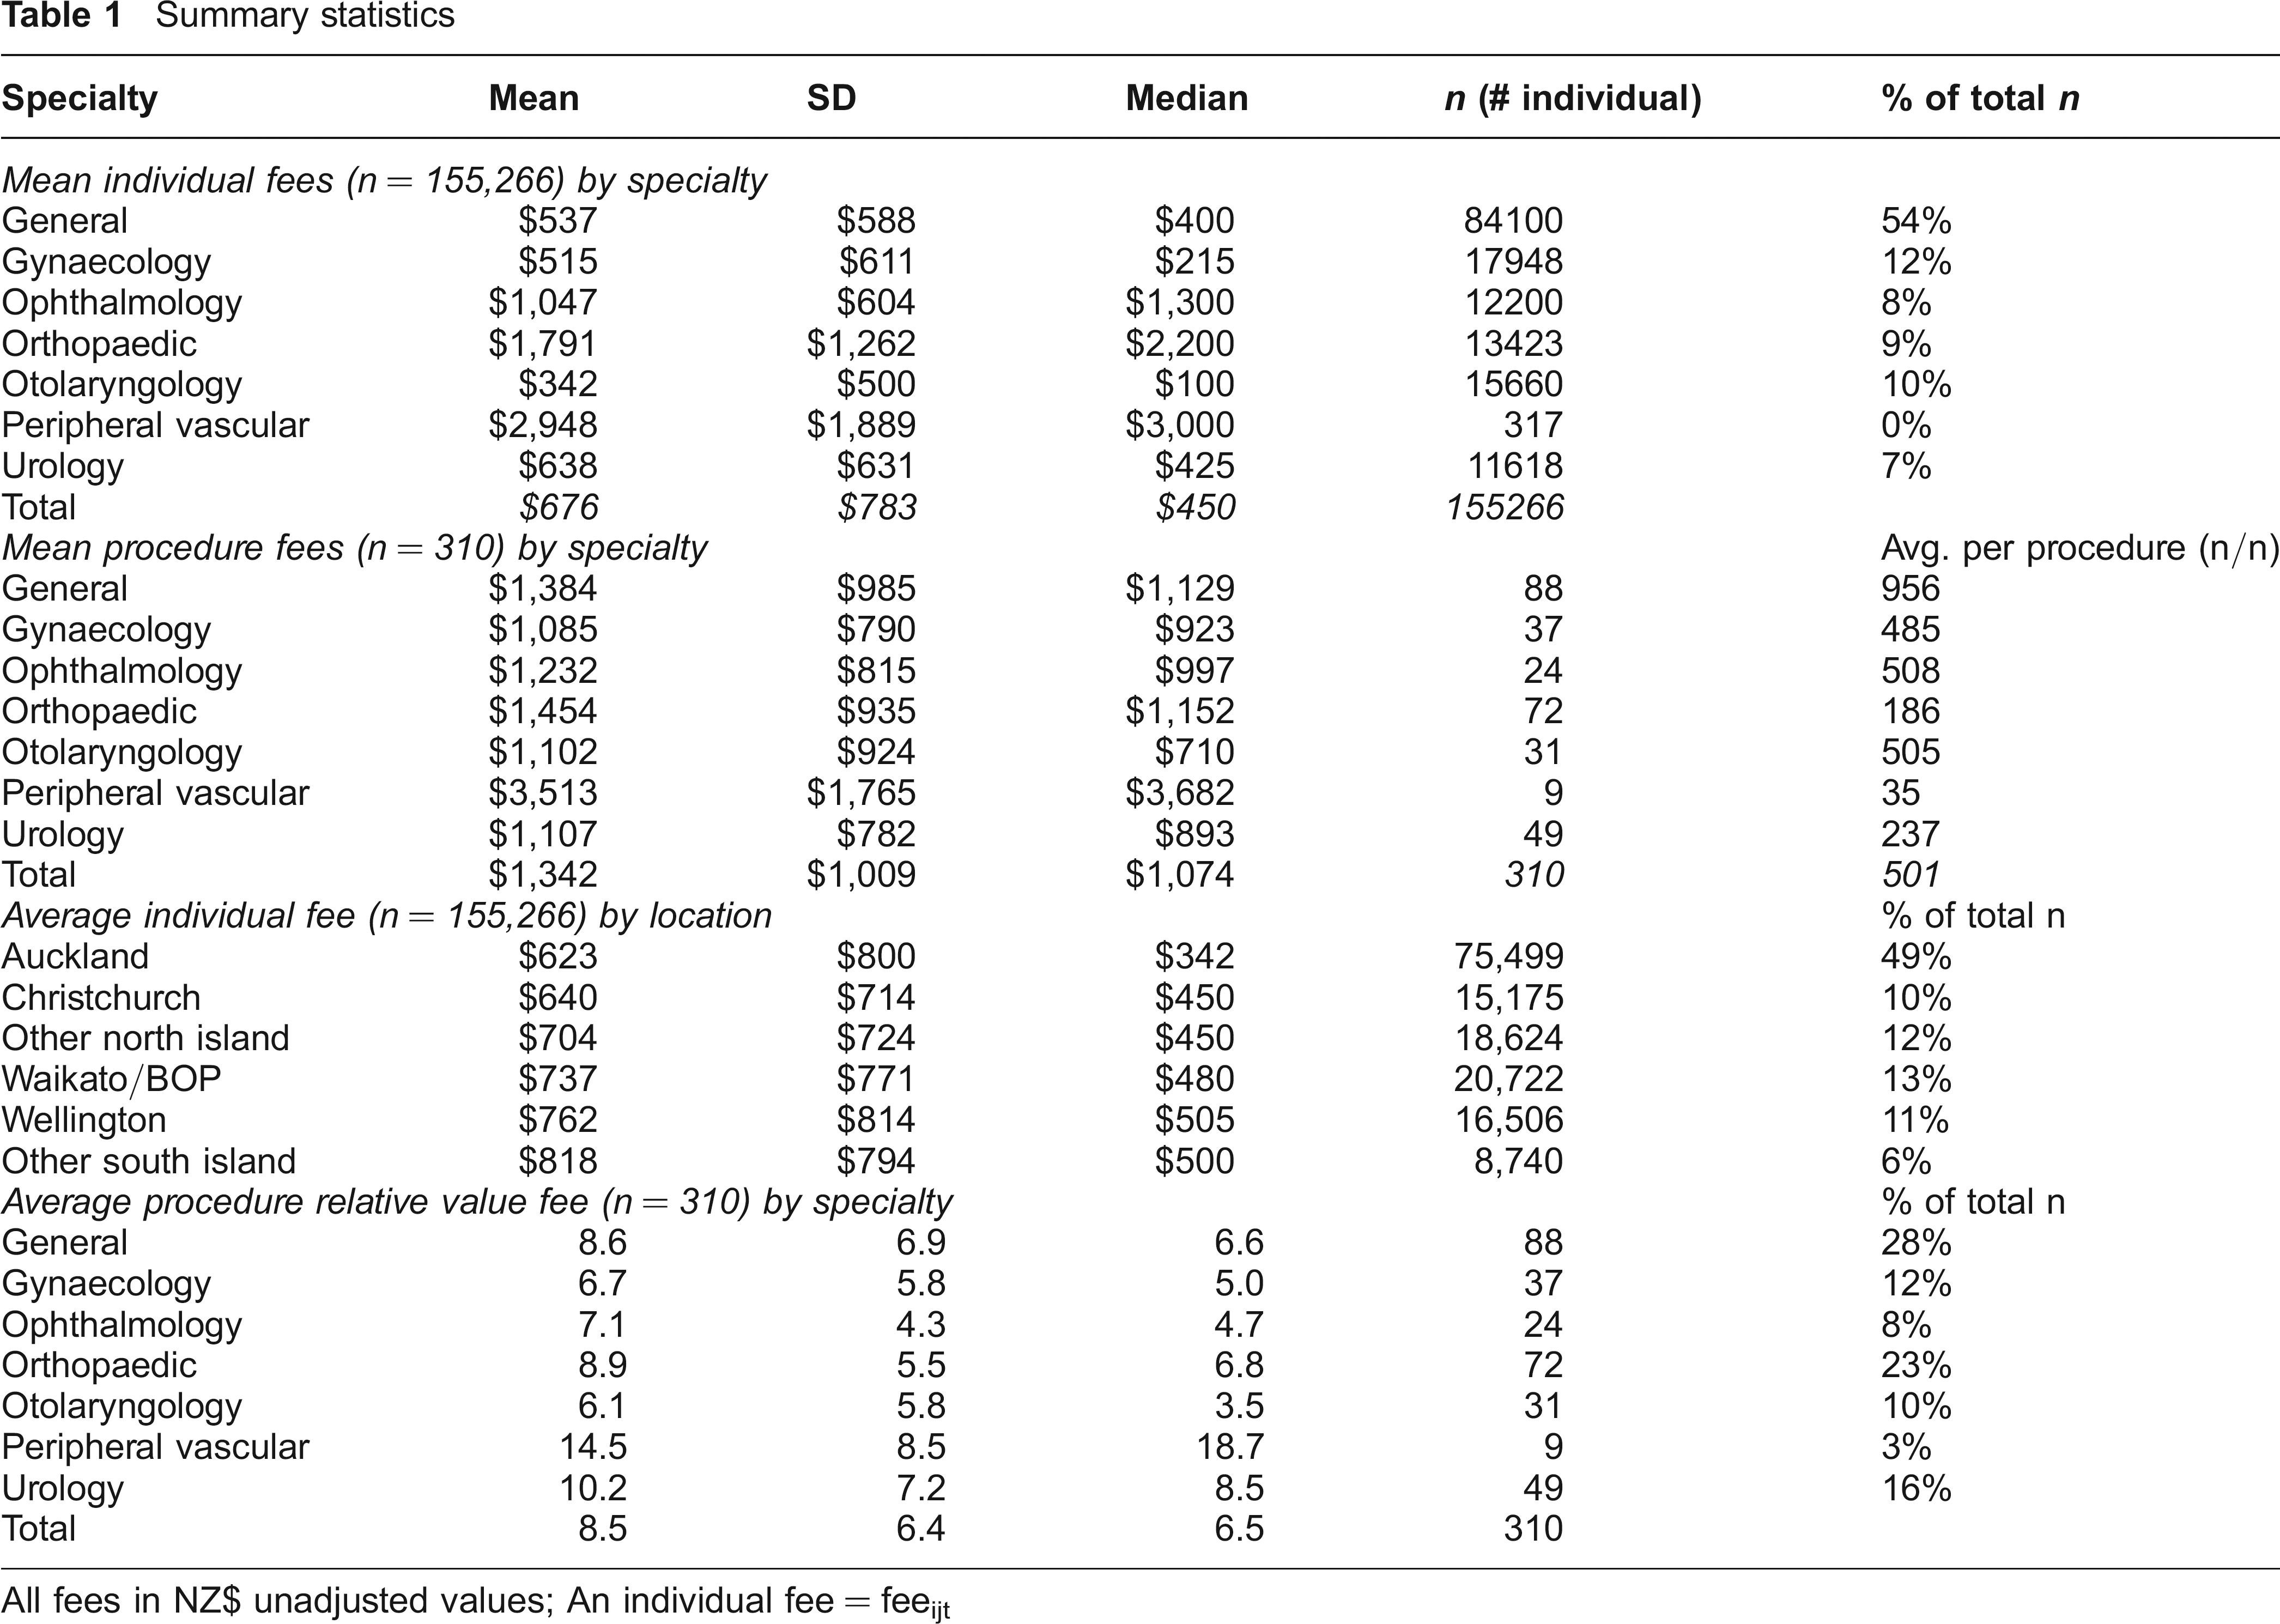
Table 1 provides the summary statistics for individual fees by specialty and location. The sample included more general surgery individual cases (n = 81400) and procedures (n = 88) at higher volumes (average volume of 956 cases per procedure) then the others in the sample (average of 501 cases per procedure). Peripheral vascular was associated with the lowest average number of cases (317), procedures 9 and average volume per procedure (35). Nearly half (49%) of individual surgeries took place in Auckland, reflecting the fact that it is a major tertary centre for New Zealand with nearly one third of the population (1.2 million).
Summary statistics
All fees in NZ$ unadjusted values; An individual fee = feeijt
Table 1 also provides the procedure level summary statistics or the mean fees and RVU by specialty. In both the individual fee and procedure level statistics, Peripheral Vascular surgeons had the largest average fee (NZ$2,948 and NZ$3,513, respectively) and Otolaryngology surgeons, with a mean of NZ$342, had the smallest average fee in the surgery level analysis, while gynaecological specialists, with a mean of NZ$1,085, had the smallest average in the procedure level analysis. The average RVU for a procedure was 8.5 (median of 6.5), ranging from a low of 0.71 to a high of 30.92. Across specialties, average RVUs ranged from a high of 14.5 per procedure (peripheral vascular) to 6.1 (otolaryngology). This is consistent with reports that the private sector largely performs simpler, more elective surgeries compared to the public sector, 11 although peripheral vascular procedures are an exception. Figure 1 provides a scatter plot of mean fees versus the RVU and illustrates a correlation of 0.79. While the sample average of the mean yearly volume is 174 individual surgeries per procedure, the median is 15 and ranges from six in urology to 57 in general surgery. Therefore, the market for private secondary services includes many low volume procedures. The correlation of mean yearly volume with mean fees is 20.22 and with the RVU is 20.20.
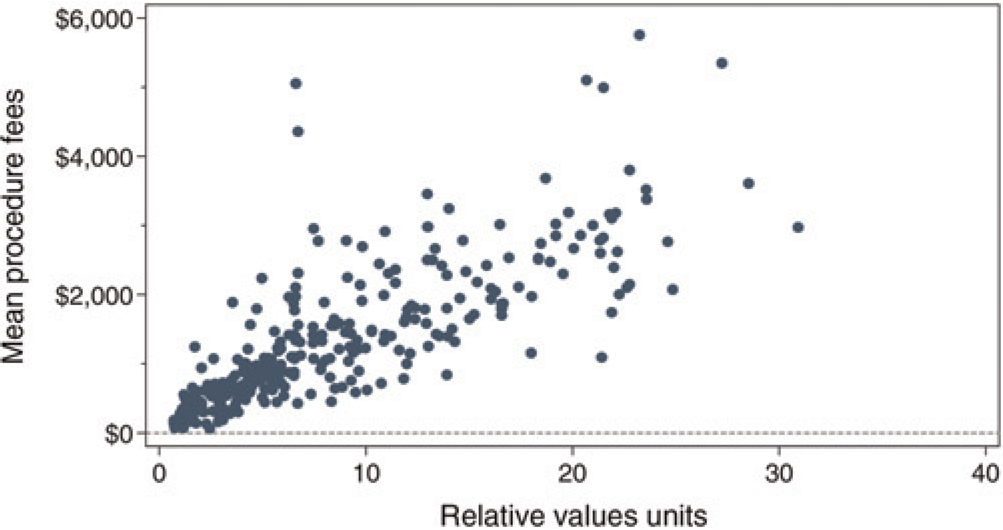
Mean procedure fees, pooled 2004–06, vs. relative value units
Predicting New Zealand surgical fees with Australian RVUs
Regressions on the RVUs plus location and year effects, are provided for both the procedure (Model 1) and the individual fee (Model 4) levels in Table 2. In both models, the RVUs are significant predictors (P < 0.01) with similar coefficients (reflecting the fact that RVUs vary between procedures but not within a procedure). The models explain 64% and 79% of the variation in surgeon fees, respectively, and the intraclass correlation coefficient indicates that 88% of the total variation in individual fees is due to procedure level effects. All speciality level effects are expressed in relation to orthopaedics.
Regression results: mean procedure and individual fees
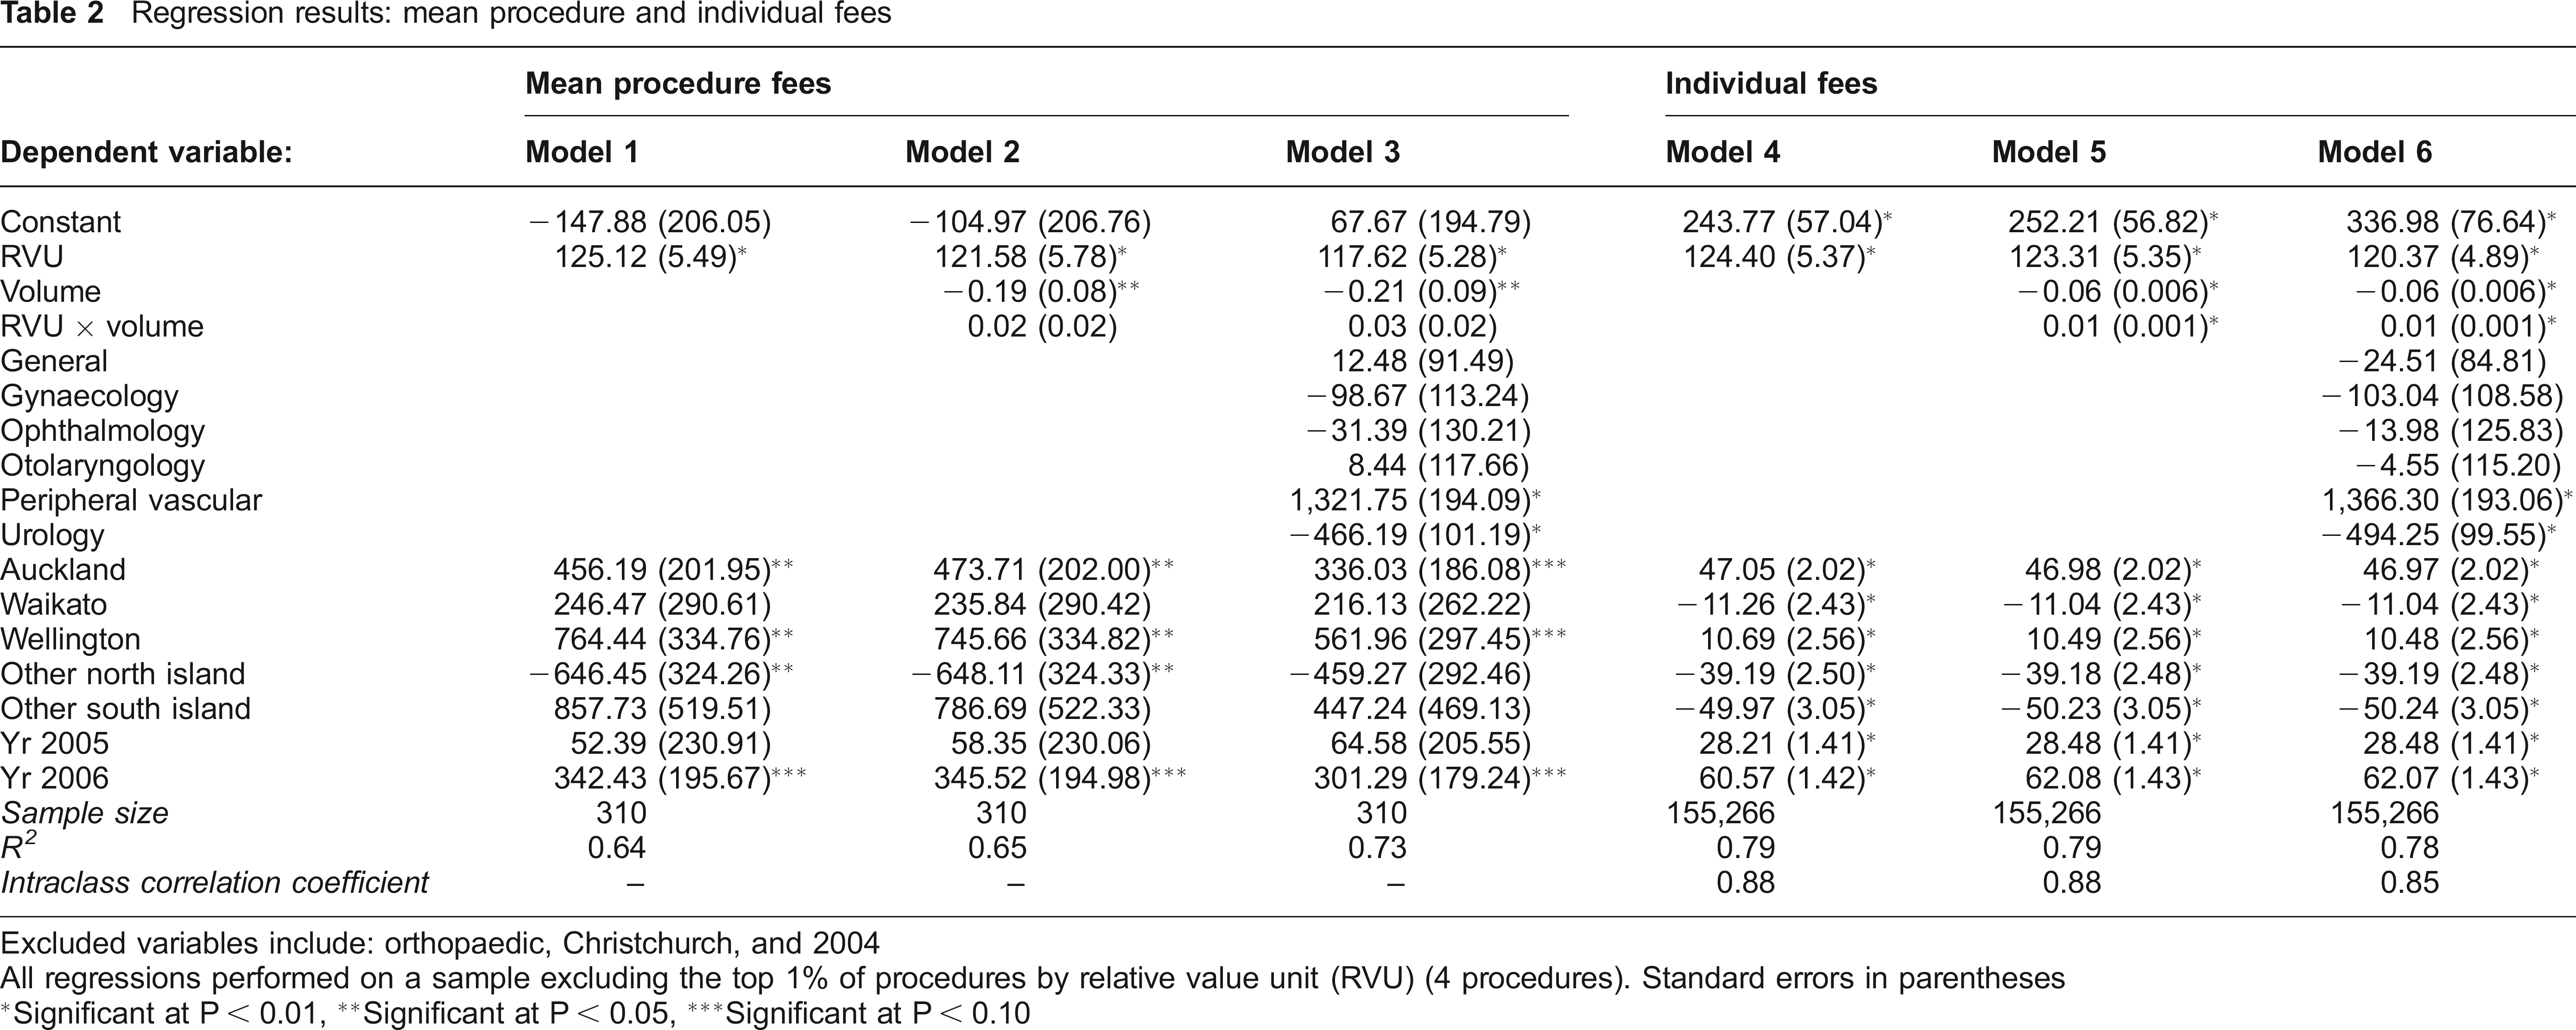
Excluded variables include: orthopaedic, Christchurch, and 2004
All regressions performed on a sample excluding the top 1% of procedures by relative value unit (RVU) (4 procedures). Standard errors in parentheses
Significant at P < 0.01,
Significant at P < 0.05,
Significant at P < 0.10
Volume of procedures
The impact of volume on reimbursements (Models 2, 3, 5 and 6 in Table 2) suggests that at both the procedure and individual levels, the average reimbursement is relatively lower (controlling for RVU) for higher volume procedures. At the procedure level, there is a decrease in fees of NZ$190 for every additional 100 surgeries per year (Model 2). The impact is somewhat less at the individual level (reduction of NZ$60 for each additional 100 surgeries) due to the fact that high volume procedures carry greater weight in the individual level results than the procedural level (where each procedure has equal weight in the analysis). At the procedural level, there is little evidence that higher volume procedures with high RVUs are associated with higher reimubursement (as indicated by the lack of significant interaction between RVU and Volume; b = 0.02 and 0.03 in Models 2 and 3, respectively). However there is a small significant effect in the individual data (b = 0.01 in Models 5 and 6). The volume effect may reflect the tendency for high volumes to deviate less from the fees predicted by the RVU. To illustrate, Figure 2 shows the plot of the difference between the predicted and actual fee (residuals from Model 1) against the mean procedureal volumes. The tendency of average fees to be below their predicted values as volume increases reflects the low volume procedures being relatively above their predicted levels. In addition, low volume procedures appear to be more dispersed around their predicted values than high volume procedures, although this is not significant due to the small number of high volume procedures.
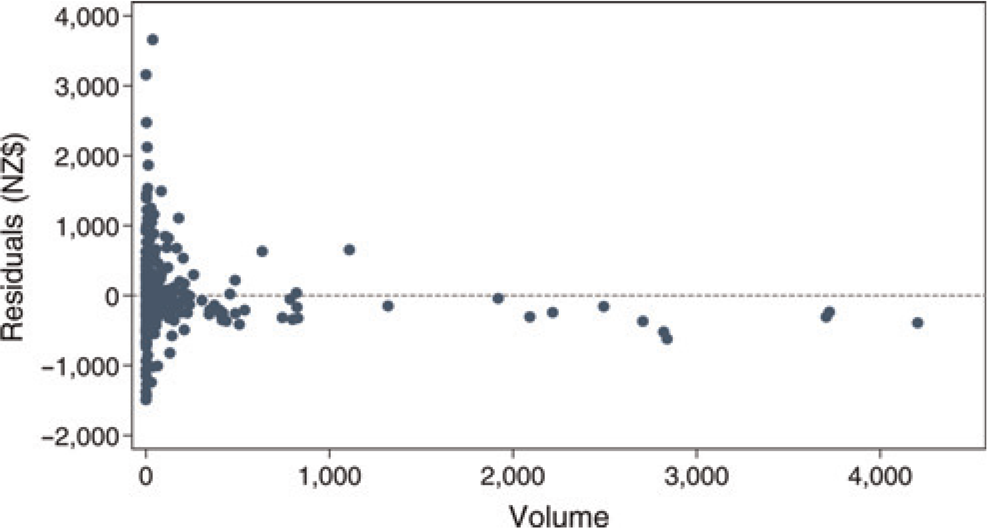
Procedure level residuals vs. mean yearly volume. Residuals are based on Model 1, Table 2 (which includes relative value unit, city effects, and time effects)
Variation between specialties
The results from examining whether there were systematic differences between specialties, after controlling for the RVU, yearly volume, region, and year effects, are shown in Models 3 and 6 of Table 2. There were no significant differences in five out of the seven specialties. However, peripheral vascular surgeons earned the most at NZ$1,366 above the average fee per orthopaedic surgery (NZ$1,322 per procedure) and urologists earned on average NZ$494 less than the average per orthopaedic surgery (NZ$466 less per procedure). Peripheral vascular and urology had the two largest mean and median RVUs and were among the lowest in mean and median average yearly volumes (Table 1).
When compared with Christchurch, the average reimbursements were higher in Auckland and Wellingon, and lower in the smaller population areas (Waikato, and other south and north island locations).
Monetary value of the deviations
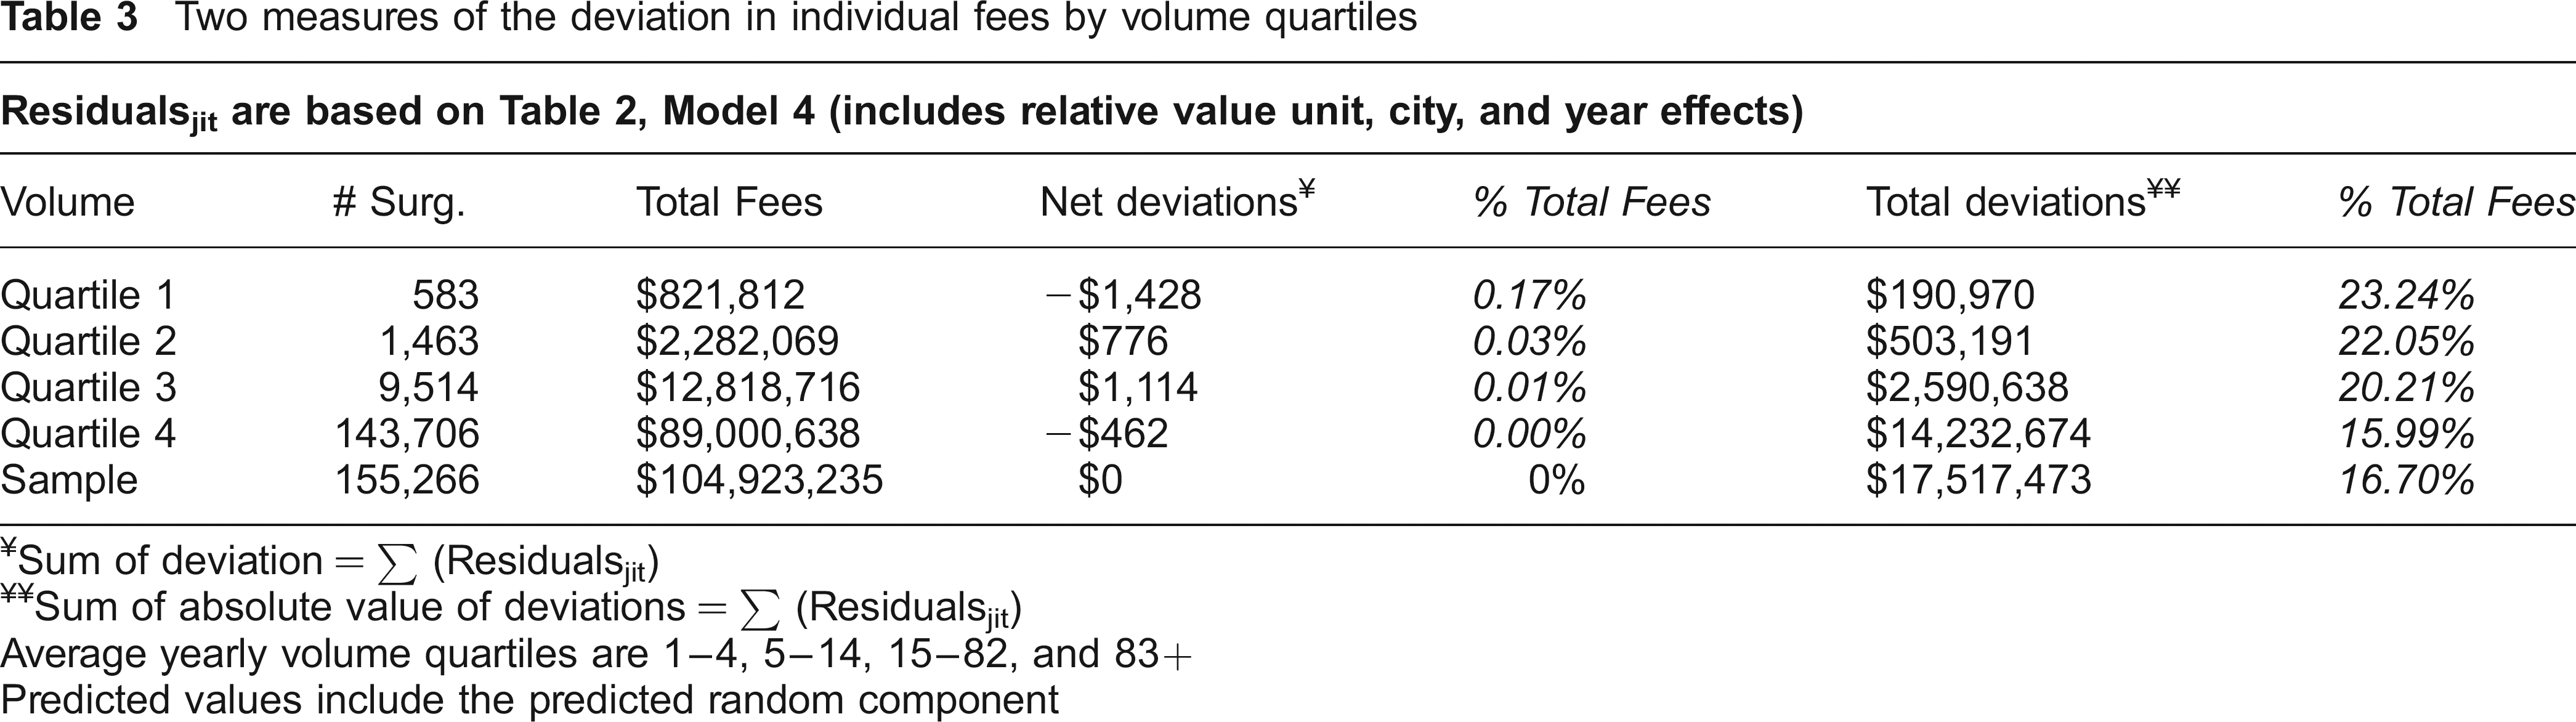
As an indication of the financial impact of switching from the current prices to prices based on RVUs, Table 3 shows the difference between the market fees and fees predicted from an RVU-based statistical model (Model 4, Table 2). The implicit conversion rate for the statistical model set the total value of the predicted fees equal to their actual value (NZ$104.9 million). Table 3 shows the total fees, average net deviation (the sum of the differences between the market fee and the predicted RVU fee), and the total deviation (the sum of the absolute value of deviations) by average yearly volume quartiles (1–4, 5–14, 15–82, 83+). The total absolute value of deviations was NZ$17,517,471, indicating that if the RVU system was adopted, there would be a net change or redistribution of fees equal to approximately 17% of the total value of fees. This change is relatively greater for small volume procedures (23% change) than high volume (16% change), but the total deviations for the bottom three volume quartiles (average yearly volume < 83), were all greater than 20% of the total fees in each quartile. This provides some evidence consistent with Figure 2 that actual fees deviated more from their predicted RVU fees in the lowest versus the highest volume procedures.
Two measures of the deviation in individual fees by volume quartiles
Sum of deviation = σ (Residualsjit)
Sum of absolute value of deviations = σ (Residualsjit)
Average yearly volume quartiles are 1–4, 5–14, 15–82, and 83+
Predicted values include the predicted random component
Discussion
The purpose of this paper was to examine whether surgical fees determined in the New Zealand private market for surgical procedures were consistent with those that would result if a RVS were used. The results indicate that the RVUs developed in Australia, along with region and time effects, explained 79% of the variation in individual surgical fees and 64% at the procedure level. The procedure volume was also found to decrease with fees and there is some evidence that variations were larger for lower volume procedures. There was no statistical difference between five out of the seven specialties, after accounting for the RVU, region and time effects. Overall, the results suggest that the market-generated fees in New Zealand were broadly consistent with those suggested by the Australian RVUs, with some systematic variations.
Finding that fees were broadly consistent could reflect some similarities between the countries’ health systems. There is a significant degree of interaction in the training of specialists, a single college, a steady flow of surgeons between the countries, and significant overlap in the way procedures are performed. It is less clear whether surgeons in New Zealand use the Australian RVUs as a guide to determining fee rates. Although the Australian scale was fully developed and posted on the government's website for a time, it was never widely distributed, promoted, or implemented. There is no evidence that Australian surgeons are reimbursed according to the scale, but it is likely they were aware of its development and may have discussed it with their New Zealand colleagues.
The result that higher volume procedures have relatively lower fees is consistent with an interpretation that competition among surgeons drives down fees. This could also explain the greater variation for low volume procedures, since there would be less competitive information to determine fees. This is not a statement about the competitiveness of the market, but rather that many markets struggle to price low volume services. However, the greater variation could also result from the association between low volume and high RVU procedures in the dataset. Since the private market in New Zealand augments the public sector through largely performing simpler elective surgeries, the case mix of patients who have more complicated surgeries in the private sector is likely to differ from the case mix of the general patient population. This might result in significantly higher (or possibly lower) fees for some procedures than would be expected based on an average fee for a wider mix of patients. Both peripheral vascular and urology have among the highest RVUs and lowest procedure volumes in the sample.
While there are few studies examining private surgical fees in countries with predominately public systems,12,13 there is considerable evidence about surgeons’ responses to the introduction of the resource-based relative value system (RBRVS) in the USA.14–16 The impact differed across specialists. However, the overall impact on incomes was difficult to assess as most specialists had income from both Medicare and private fees. The counterfactual calculation presented here (Table 3) suggests that the net impact on overall fees could be minimal (assuming the conversion rate was determined within sample as in this analysis). However, this calculation also assumes that surgeons would not adjust their private case-mix or their mix between public and private sectors, even though roughly a sixth of the value of their fees would be redistributed.
While it is tempting to draw wider conclusions from these results on the workings of the market for surgical fees in New Zealand, some caveats must be made. First, the analysis does not address whether the overall level of fees, or the conversion rate, is appropriate. In the present analysis, the implicit conversion rate was the estimated coefficient from the regression of RVU on actual fees. Determining whether this implicit level of fee is higher or lower than what would emerge from a market requires a different method than used here.
The second caveat relates to the assumed validity of the RVS. While the Australian MHA led an extensive process to develop RVUs, there is no assurance that the resulting RVUs did in fact reflect the intended economic fundamentals. Since the Australian scale was never implemented, there has not been the validation and adjustments of RVUs that has occurred in the USA over the last 20 years.
Finally, we acknowledge that our estimates may suffer from simultaneous equation and omitted variable biases if the RVU or procedure volume are endogenous variables. This could be possible for the RVU if there were fewer surgeons completing the more complicated procedures, which resulted in less competition between them. The New Zealand government has identified a shortage of senior specialists. 17 In the case of volume, if higher volume procedures tended to have larger numbers of surgeons or greater economies of scale due to lower barriers to surgeon entry, this could partly explain the association between higher volume and simpler procedures with lower RVUs.
Footnotes
Acknowledgements
The authors would like to thank Southern Cross Medical Care Society for providing access to data on fees and for assistance in coding procedures. All opinions stated in this paper and any errors are solely the responsibility of the authors and do not reflect the opinions or views of Southern Cross Medical Care Society. The authors would also like to thank the anonymous reviewers for their helpful comments concerning the estimation. Many of their suggestions were adopted and considerably strengthened the manuscript.