
Abstract

TO THE EDITOR: Predictive models offer a useful means of estimating drug transfer into breast milk when clinical studies are lacking. Larsen et al. 1 recently evaluated the ability of the Atkinson—Begg model 2 to predict the milk to plasma (M/P) concentration ratio of drugs. They found no correlation (r 2 = 0.0001) between the M/P ratio predicted using the model and M/P ratios measured experimentally and concluded, “Atkinson and Begg's model cannot be used in its present form for routine prediction of M/P ratios.” This result contrasts with the good predictive ability found in other studies (r 2 = 0.97, 3 0.81 4 ) that have evaluated the model.
Unfortunately, Larsen et al. used the Atkinson—Begg model incorrectly, so their study is not helpful (actually it is quite destructive). To calculate the M/P ratio for a given drug, the model uses 3 physicochemical parameters: ionization at relevant pH (pKa), plasma protein binding, and an index of lipophilicity (the logarithm of the octanol/water partition coefficient at pH 7.2; logPapp, also known as logD). Larsen et al. erroneously used the logarithm of the octanol/water partition coefficient (logP) as the index of lipophilicity, instead of logPapp at pH 7.2 (the average pH of breast milk), as stated in the model.
The use of the wrong partition coefficient may seem trivial, but the effect can be dramatic. To illustrate this, we have substituted logP for logPapp in the model (Table 1) and applied the model to the subset of basic drugs reported by both Larsen et al. 1 and Atkinson and Begg 2 (acidic drugs could not be investigated as the relevant table was truncated in Larsen et al.'s publication). The use of logP values leads to a poor prediction of the M/P ratio (r 2 = 0.12). In contrast, correctly applying logPapp values leads to good predictability (r 2 = 0.79). The use of logP instead of logPapp may explain the poor correlation between predicted and measured M/P ratios in the Larsen et al. study. We are surprised that such a fundamental error was not identified prior to publication.
Comparison of Experimentally Derived M/P Ratios with Those Predicted Using logP (incorrect) and logPapp at pH 7.2 (correct) a
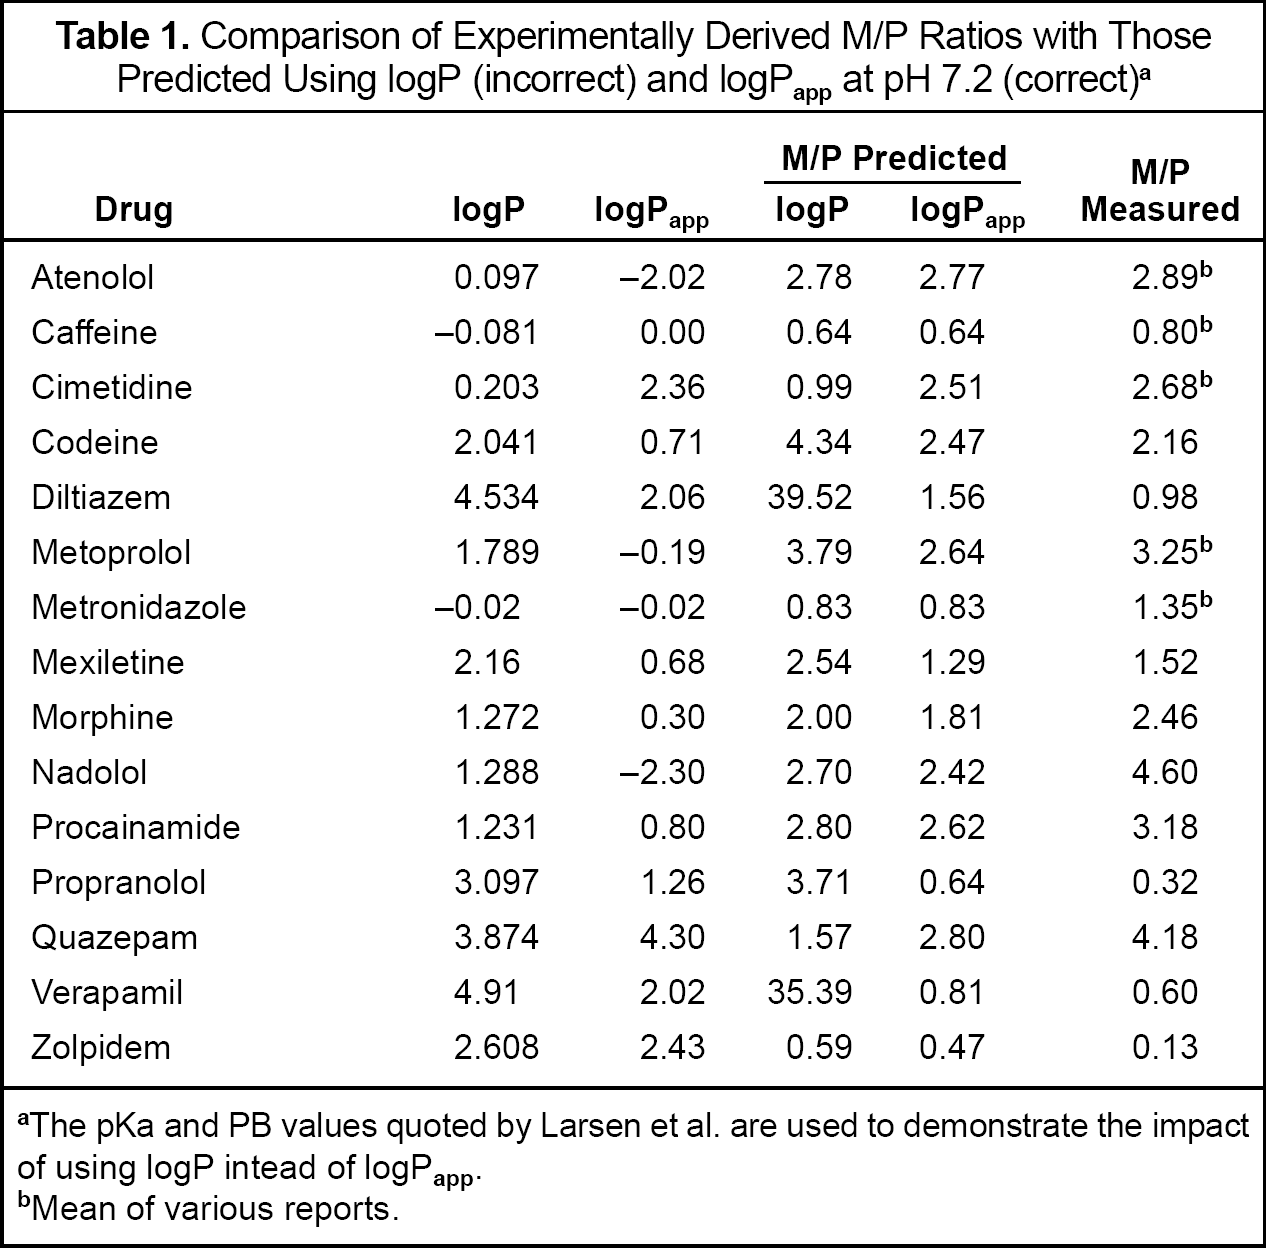
The pKa and PB values quoted by Larsen et al. are used to demonstrate the impact of using logP intead of logPapp.
Mean of various reports.
Another problem with the Larson paper was that it also included drugs used to develop the Atkinson-Begg model. The data used to evaluate any model should be independent of the data used to generate the model.
Comments on articles previously published are submitted to the authors of those articles. When no reply is published, either the author chose not to respond or did not do so in a timely fashion. Comments and replies are not peer reviewed.–ED.
Larsen et al. criticize the work of Atkinson and Begg for not considering active transportation in their model. The model (and all other published models) is based on the assumption of passive transport, as was clearly stated in the original publication. This limitation is, fortunately, not significant for most drugs. Active drug transportation, into or out of milk, is an area of active research, including our own. Indeed, if a measured M/P value differs substantially from the value predicted by the model, an alternative distribution process (such as active transport) should be sought.
There remains a lack of in vivo data of M/P concentrations for many drugs, and we encourage people to collect these data. At this stage, the Atkinson—Begg model remains the most useful method of predicting M/P ratios when the model is correctly applied.