
Abstract
Objective
To review clinical trials with fluoroquinolones and the pharmacokinetic and pharmacodynamic parameters predictive of clinical and microbiologic outcomes and resistance. Data on fluoroquinolones are summarized and the premise that a single AUIC target >125 may be used for all fluoroquinolones against all target organisms is examined.
Data Sources
Primary articles were identified by a MEDLINE search (1966–February 2002) and through secondary sources.
Study Selection And Data Extraction
All of the articles identified from the data sources were evaluated and all information deemed relevant was included.
Data Synthesis
The fluoroquinolones exhibit concentration-dependent killing. This effect clearly depends upon concentrations achieved and outcomes depend upon endpoints established by individual investigators. With AUIC values <60, the actions of fluoroquinolones are essentially bacteriostatic; any observed bacterial killing is the combined effect of low concentrations in relation to minimum inhibitory concentration and the action of host factors such as neutrophils and macrophages. AUIC values >100 but <250 yield bacterial killing at a slow rate, but usually by day 7 of treatment. AUICs >250 produce rapid killing, and bacterial eradication occurs within 24 hours. Disagreements regarding target endpoints are the expected consequences of comparing microbial and clinical outcomes across animal models, in vitro experiments (Part 1), and humans when the endpoints are clearly not equivalent. Careful attention to time-related events such as speed of bacterial killing versus global endpoints such as bacteriologic cure allows optimal break points to be defined.
Conclusions
Evidence from human trials favors the use of AUIC values >250 for rapid bactericidal action, regardless of whether the organism is gram-negative or gram-positive.
Part 1 of this article appears in the September 2003 issue on pages 1287–98, DOI 10.1345/aph.1C199.
Part 1 of this review discussed the relationships between the AUC24 to MIC (minimum inhibitory concentration [MIC] ratio, referred to as AUIC) and bacterial killing rates of fluoroquinolones in vitro and in animal models. 1 These studies advance the concept of 3 AUIC break-point values: 1 essentially bacteriostatic, 1 bactericidal, and 1 rapidly bactericidal. At the low end of the concentration versus bacterial killing spectrum, AUICs of 30–50 describe bacteriostatic actions. Values of AUIC >100 and increasing to 250 are bactericidal and >250 the AUICs progressively approach maximal killing rates. The present review examines the link between AUIC and both efficacy and resistance in human infections.
See also page 1518, DOI 10.1345/aph.1D337.
Resistance selection is inversely related to AUIC. The lower the AUIC below 100 and the longer these AUIC values are maintained, the greater the number of selected organisms that may emerge during therapy. Mutations do occur at both genomic targets of fluoroquinolone action, parC and gyrA, but the usual problem is selection of previously mutated subpopulations. This is particularly a problem with fluoroquinolones having a recommended dose that produces a low AUIC (<100) in the majority of treated patients. Values of AUIC <100 are most likely to select resistance with marginal organisms such as Streptococcus pneumoniae, Staphylococcus aureus, and Pseudomonas aeruginosa.
Dosing practices designed to save money or minimize potential toxicity place the fluoroquinolones at high risk for the development of resistance. Instead of low AUIC dosing for long periods of time (>14 d), doses should be maximized to kill bacteria rapidly. Treatment courses should be ended quickly (≤7 d). This strategy succeeds when the AUIC target of 250 can be achieved against the pathogen in the patient at risk for resistance. The concept of rapid bactericidal action and short duration of treatment applies to infections with pathogens accessible to the central compartment (blood, interstitial fluids, highly perfused tissues such as lung). It does not necessarily apply to the treatment of endocarditis, meningitis, and osteomyelitis, where there is a sequestered bacterial population. Clearly, many of the older fluoroquinolones are unable to reach adequate AUIC target values against higher MIC gram-positive pathogens such as S. pneumoniae and S. aureus. These low-potency analogs will either need to be dosed far more aggressively or replaced by more active newer agents if we plan to preserve this class for use well into the first decade of the new millennium.
Human Models
Clinical trials measure and use MICs as the basis for determination of individual organism susceptibility, even though the antimicrobial activity of fluoroquinolones is concentration-dependent and, by definition, not detected by the fixed concentrations used in MIC testing. The MIC method benefits from being the simplest perspective for analysis of pharmacokinetic/pharmacodynamic effects in humans, and sometimes differentiation of MICs will show statistical differences in outcomes. 2 Overall, the MIC alone does not account for interpatient variations in patients' outcomes. Both MIC and pharmacokinetic factors need to be considered to accurately predict outcomes such as speed of bacterial killing in the patient. When assessing populations of organisms against known antibiotic pharmacokinetics, investigators typically use population pharmacokinetic and population MIC values like the MIC50 and the MIC90. 3 But these population descriptors do not necessarily forecast the outcome of individual patients because the actual MIC values in the treated patient may be either higher or lower than the average isolate from the averages in the laboratory population.
Patient studies assessing pharmacokinetic and pharmacodynamic parameters are difficult to perform in patients participating in clinical trials, and there are few available in the literature. This review focuses on 5 human studies analyzing both pharmacokinetics and pharmacodynamics.2,4–7 In each, the investigators used pharmacokinetic/pharmacodynamic analyses to derive a break point AUIC linked to outcomes for the targeted fluoroquinolones. These studies did not arrive at the same AUIC break points, nor were the outcomes the same. These differences were primarily dependent upon the designated endpoints of the study. Figure 1 illustrates the problems with measuring endpoints only at the end of therapy and suggests that endpoints need to be measured earlier and probably serially to detect differences that occur between agents over time. 8
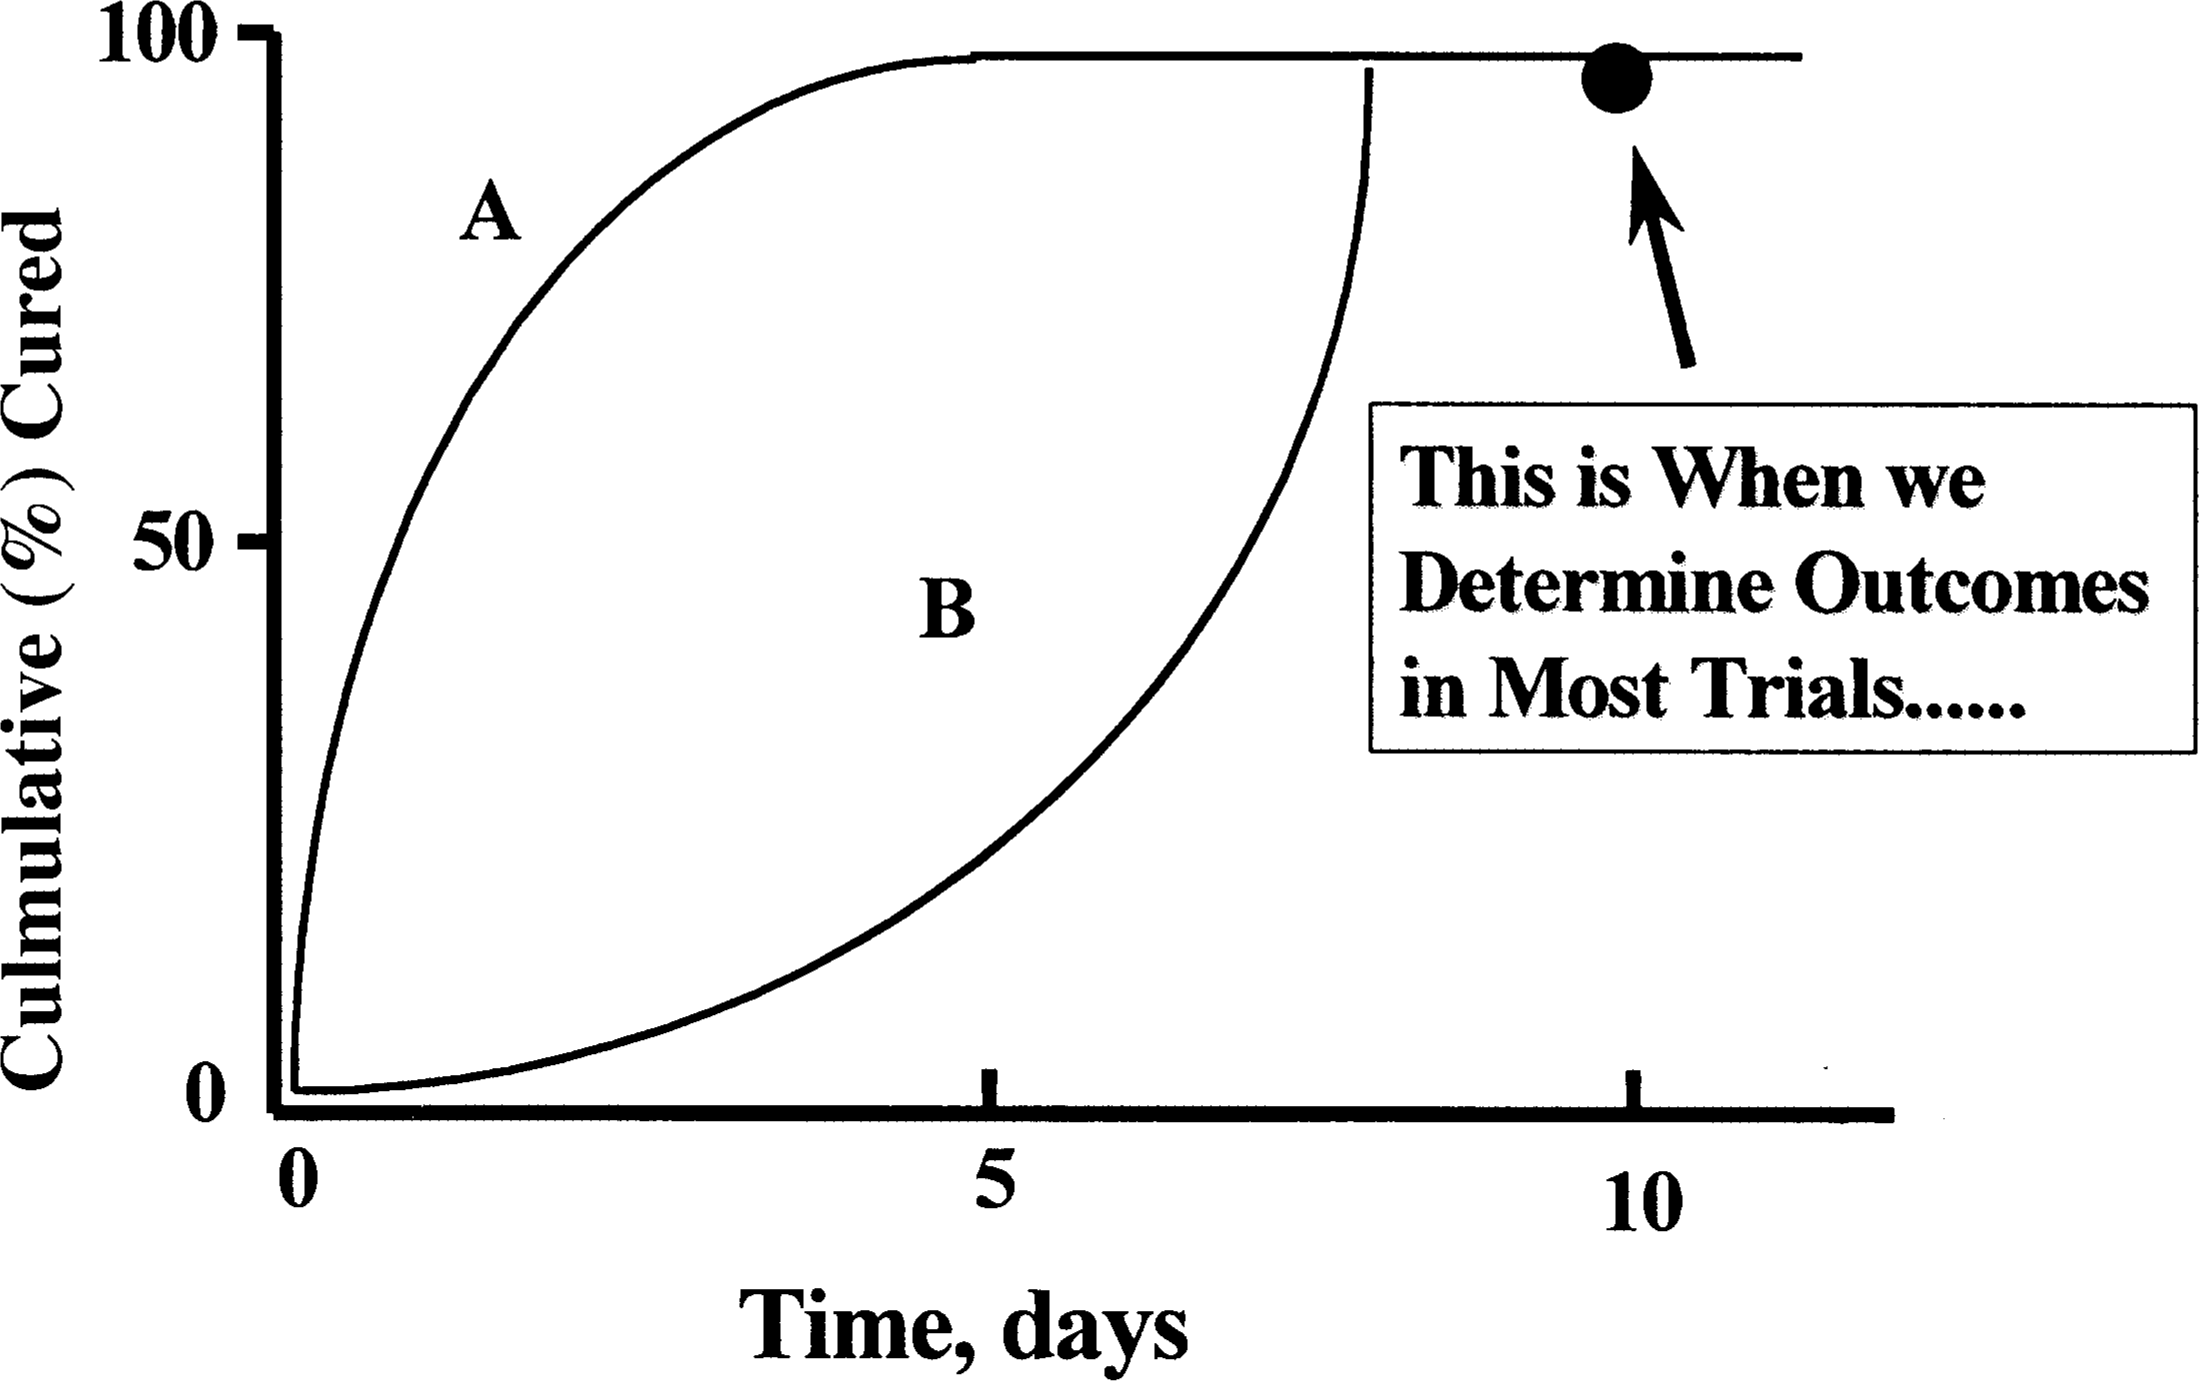
Two antibiotics, A and B, are illustrated to have a different rate of approach to their maximum response of nearly 100%. This could illustrate time to bacterial eradication or time to clinical resolution. In either case, the differences between A and B cannot be differentiated because the only assessment point is day 10. This is a typical endpoint problem in registration trials and forces the conclusion of equivalence in final outcome, even when the rate of improvement differs greatly. 8 (source of original concept: Charles H Nightingale PhD, 1998).
The fluoroquinolone effect on gram-negative bacteria has been more precisely quantified, perhaps because serial cultures are easier to collect in hospitals than in the community. Because gram-negative organisms are more commonly found in hospitals, the concentration-dependent killing actions of fluoroquinolones on gram-negative bacteria are more clearly understood. For gram-negative bacteria, both bacterial killing rates and clinical outcomes correlate well across a range of AUIC values, with the most rapid bacterial eradication associated with higher AUIC values. An AUIC of 125–250 was closely linked to clinical cure and speed of bacterial eradication for gram-negative infections of the respiratory tract. 2 In similar patients, an AUIC >100 was linked with a decreased emergence of bacterial resistance. 9 Data with gram-negative organisms accept a target of 100–125, but the time of eradication results clearly support an AUIC target of ≥250 because bacterial eradication occurs more rapidly as the AUIC increases. 2 The use of speed of organism killing in human clinical trials of fluoroquinolones presents a clear demonstration of concentration-dependent bacterial killing. Only these data validate concentration dependence in humans.
Gram-Negative Organisms
AUICs vs. EFFICACY
The first challenge in resolving the animal versus human model is to deal with the concentration-dependent killing rates of fluoroquinolones. This can be easily accomplished with serial culturing in patients to establish the rate of bacterial eradication. Pneumonia represents a convenient human model for this task since these patients can easily be cultured serially. Frequent sampling of the organism from the site of infection provides sufficient statistical power to detect concentration-dependent killing with the fluoroquinolones in patients. 2
At the time the gram-negative bacterial killing rate studies were done, ciprofloxacin was the only systemically active fluoroquinolone. Population pharmacokinetic/pharmacodynamic analysis was used by Forrest et al.2,10 to study the relationship between measures of ciprofloxacin exposure and both clinical and microbiologic outcomes. The data were pooled from several Phase III clinical efficacy trials. All of these studies used the same enrollment, sampling, and evaluation protocol. Seventy-four acutely ill patients were treated with intravenous ciprofloxacin dosages ranging from 200 mg every 12 hours to 400 mg every 8 hours. Among patients, there were 58 (78%) lower respiratory tract nosocomial infections, 9 (12%) wound-soft tissue infections, 4 (5%) bacteremias, and 3 (4%) complicated urinary tract infections. From 2 to 19 blood samples were obtained from each patient to measure plasma drug concentrations. The combination of frequent culture samples and monitoring of antibiotic dosing allowed careful observation of changes in antimicrobial susceptibility and antibiotic exposure. Pharmacokinetic modeling of the data was used to calculate the AUIC, peak:MIC ratio, and time above MIC.
Sixty-four patients were evaluable for microbiologic response, 66 patients were evaluable for clinical response, and all microbiologically evaluable patients had a measure of the time to bacterial eradication. Twenty-five patients (34%) had P. aeruginosa infections; 36 (49%) were infected with other gram-negative aerobes, and 11 (15%) had S. aureus infections. Baseline ciprofloxacin MICs ranged from 0.008 to 4.0 μg/mL, with almost two-thirds of patients having an MIC <0.25 μg/mL.2,10
Analysis of the time to bacterial eradication was used to discriminate between the outcomes for the different AUIC ranges. The population analysis began with 100% culture-positive patients. For 3 AUIC groups, the percentage of patients remaining culture positive on each day of treatment is plotted in Figure 2. 2 With serial culturing, 3 statistically different (p < 0.001) patterns of eradication were identified. Twenty-one patients had an initial AUIC <125, and only 30% of these patients showed eradication in the observation period (median time to eradication >32 d). At an AUIC between 125 and 250 (n = 15), the median time to eradication was 6.6 days. In contrast, patients with an AUIC >250 (n = 28) had bacterial eradication in 1.9 days of treatment, and by day 6, all but 1 of these patients had negative cultures. AUIC was clearly the most significant variable for probability of both microbiologic and clinical cures. Neither site of infection nor target organism (i.e., gram-negative vs. gram-positive) was found to be significant is this analysis.2,10 These data were the basis for the dosage of ciprofloxacin being increased to 400 mg every 8 hours for the treatment of nosocomial pneumonia.
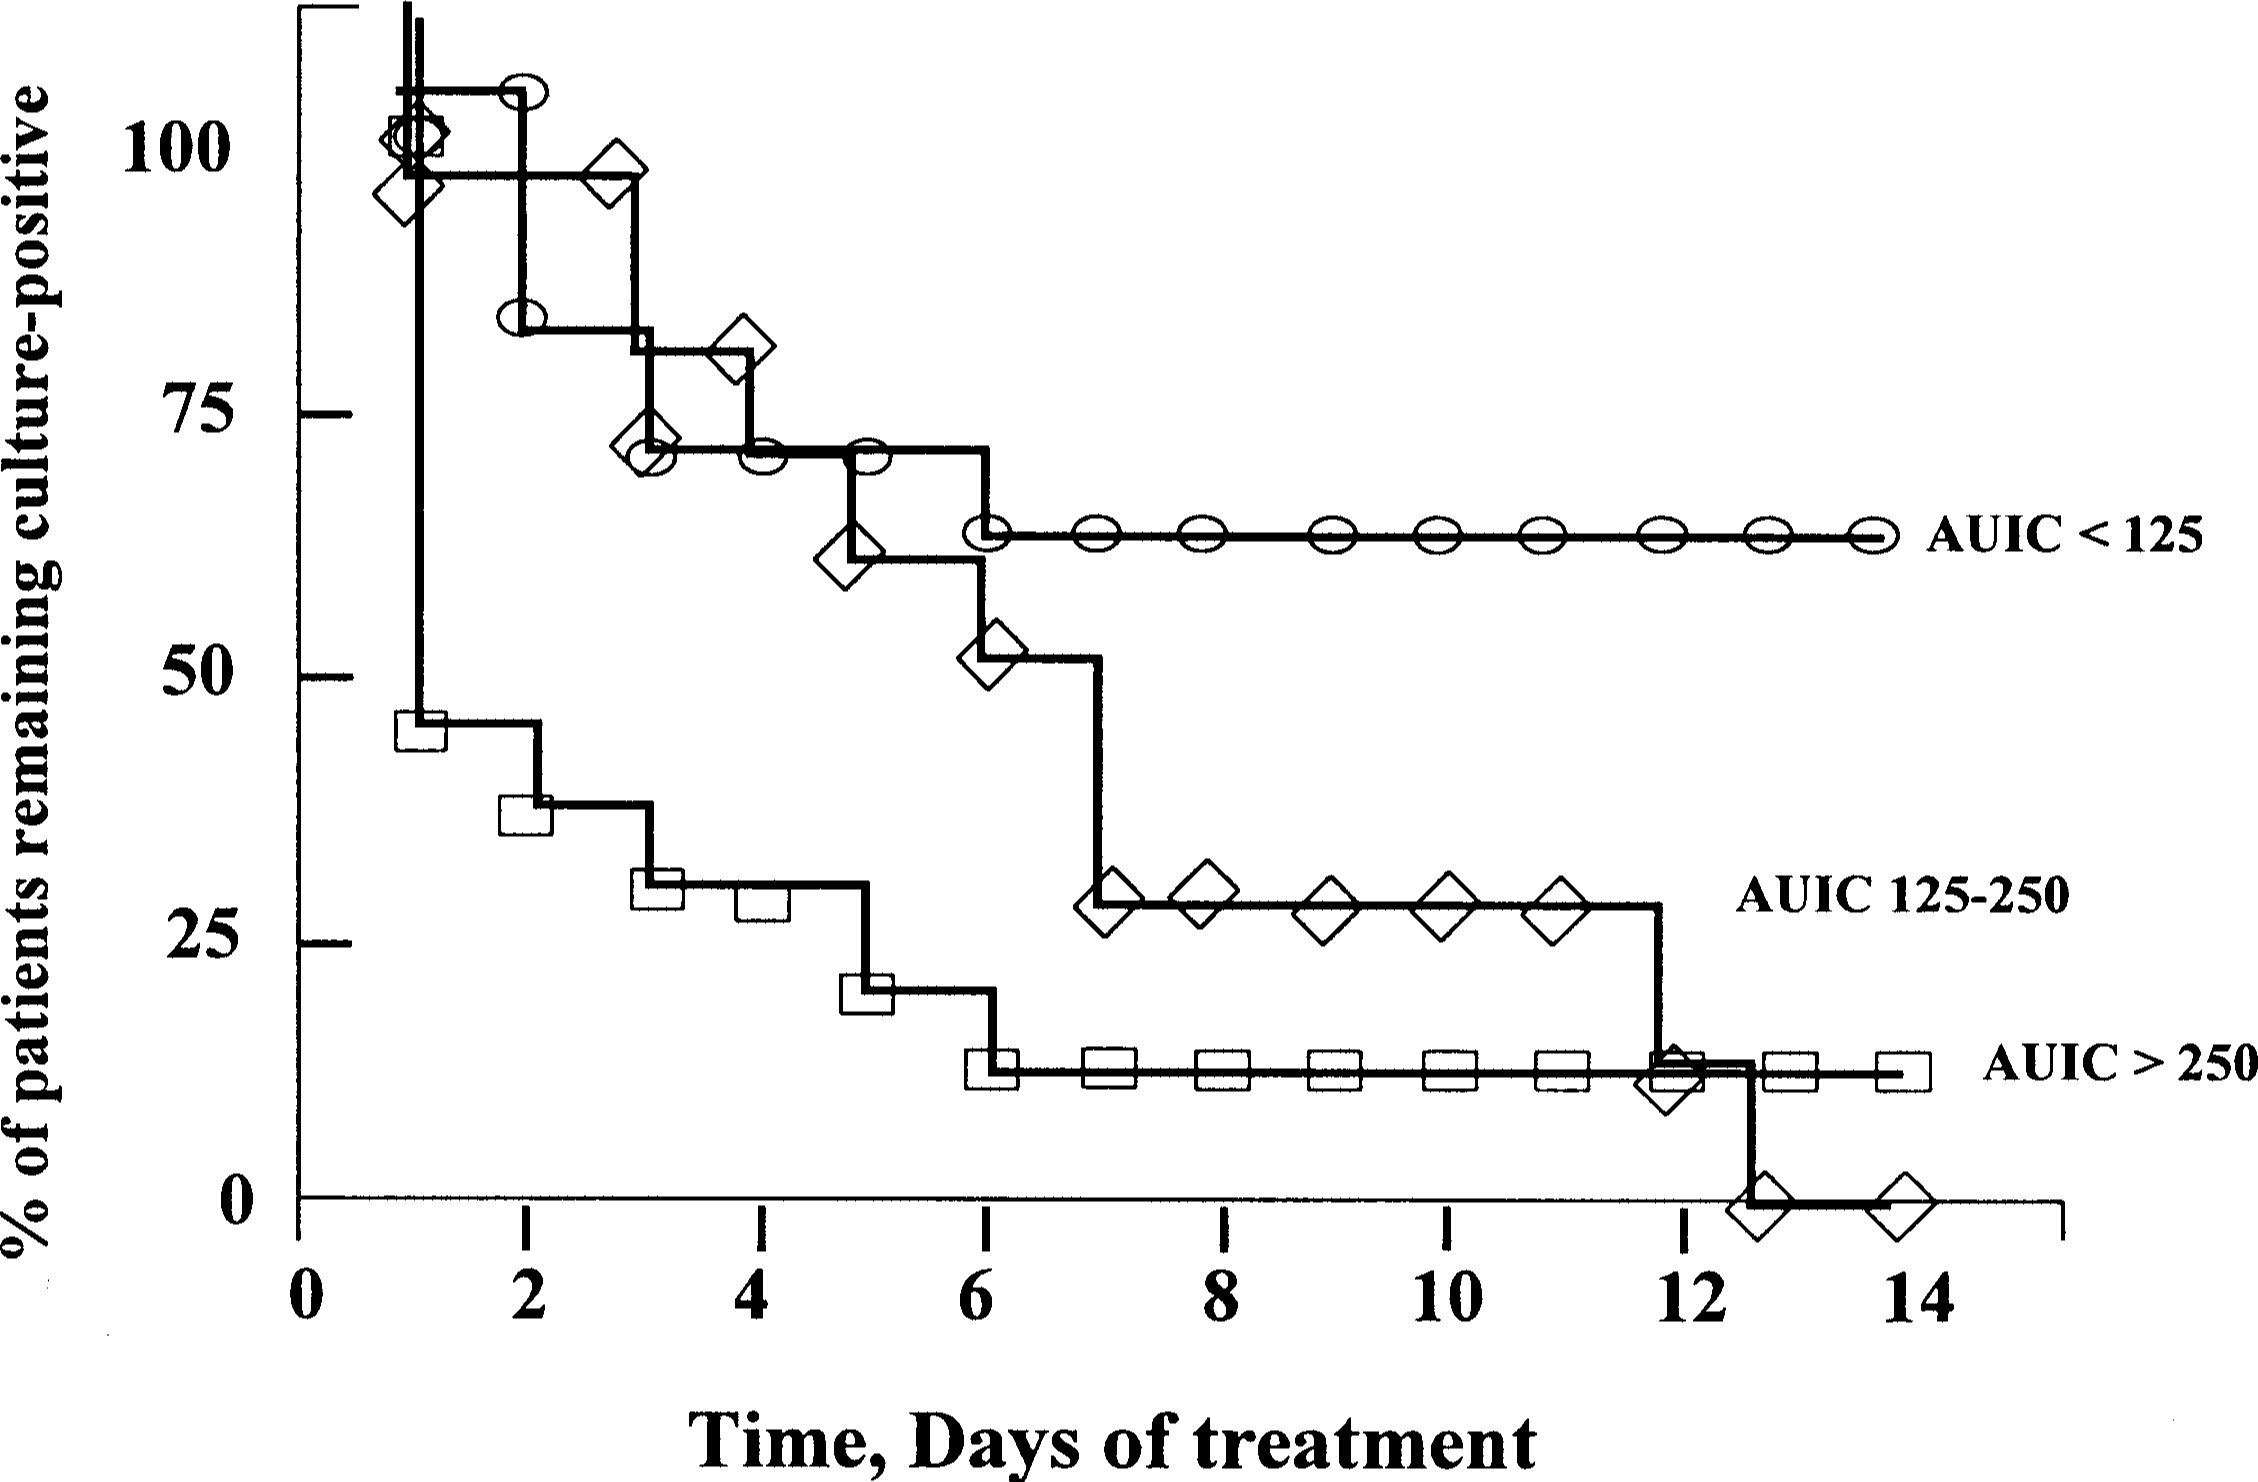
The relationship between the daily cultures and 3 groups of ciprofloxacin AUICs in 74 patients with nosocomial pneumonia. The patients with AUICs <125 (≗) had only 30% of the cultures become negative in 14 days. If the AUIC was 125-249 (⋄), the cultures became negative in all patients, but over half required 6 days to achieve organism eradication. The patients with AUICs >250 (□) had over 60% of their cultures negative after 1 day of therapy. These data establish concentration dependence to the action of ciprofloxacin in patients. 2 Figure modified and reproduced with permission. AUIC = area under the inhibitory concentration–time curve.
Gram-Positive Organisms
Auics vs. Efficacy
Gram-negative organisms tend to predominate in nosocomial pneumonia, and gram-positive organisms are more prevalent in community-acquired pneumonia (CAP). This epidemiologic reality forces the comparison of AUICs in human bacterial killing trials across 2 different manifestations of lower respiratory tract infection (LRTI). The differences between the 2 types of LRTI have impact even beyond the types of pathogens and deserve some commentary. Nosocomial pneumonia is a superior pharmacokinetic/pharmacodynamic model when compared with CAP simply because nosocomial pneumonia is a clear indicator of antimicrobial effect that occurs in the relative absence of host defense considerations.2,11,12 In nosocomial models, either the antibiotic kills the pathogen or the pathogen kills the patient. The situation with CAP and S. pneumoniae is typically reflective of bacterial killing endpoints only when the patient becomes severely ill from S. pneumoniae and is hospitalized. Similarly, outpatient respiratory tract infections, such as acute bacterial exacerbations of chronic bronchitis (ABECB) and acute sinusitis, seldom show a close linkage between the eradication of the bacterial pathogen (the only truly measurable effect of the antibiotic) and clinical improvement.
An article peripherally similar to the ciprofloxacin articles by Forrest et al.2,10 was published by Preston et al. 4 The authors conducted a retrospective analysis of a prospective, multicenter (22 sites), open-label registration study with an add-on pharmacokinetic sampling protocol. After the study was completed, the investigators performed population pharmacokinetic/pharmacodynamic modeling. This analysis included 313 patients with clinical signs and symptoms of bacterial infections of the respiratory tract, skin, or urinary tract. Of the 313 patients, 134 had a pathogen recovered from the primary infection site and had a levofloxacin MIC determined; 116 were evaluable for microbiologic analysis. Twenty-one (15.7%) patients had infections with S. pneumoniae and 15 (11.2%) were infected with S. aureus. None of the 35 species of organisms isolated in this study behaved differently in terms of AUIC versus microbiologic outcome.
This study found that successful clinical and microbiologic outcomes for levofloxacin versus gram-positive organisms were predicted by a peak:MIC ratio of 12.2:1. Although peak:MIC was found to be statistically linked to prediction of outcome, peak:MIC ratio and AUIC were highly correlated (r = 0.942). Because of the concordance between peak serum concentration and AUC (Figure 3), the AUIC and peak:MIC are expected to be interchangeable. 13 The AUIC associated with clinical success and microbiologic eradication in this study was 110, as calculated from a peak:MIC ratio of 12.2:1. 4
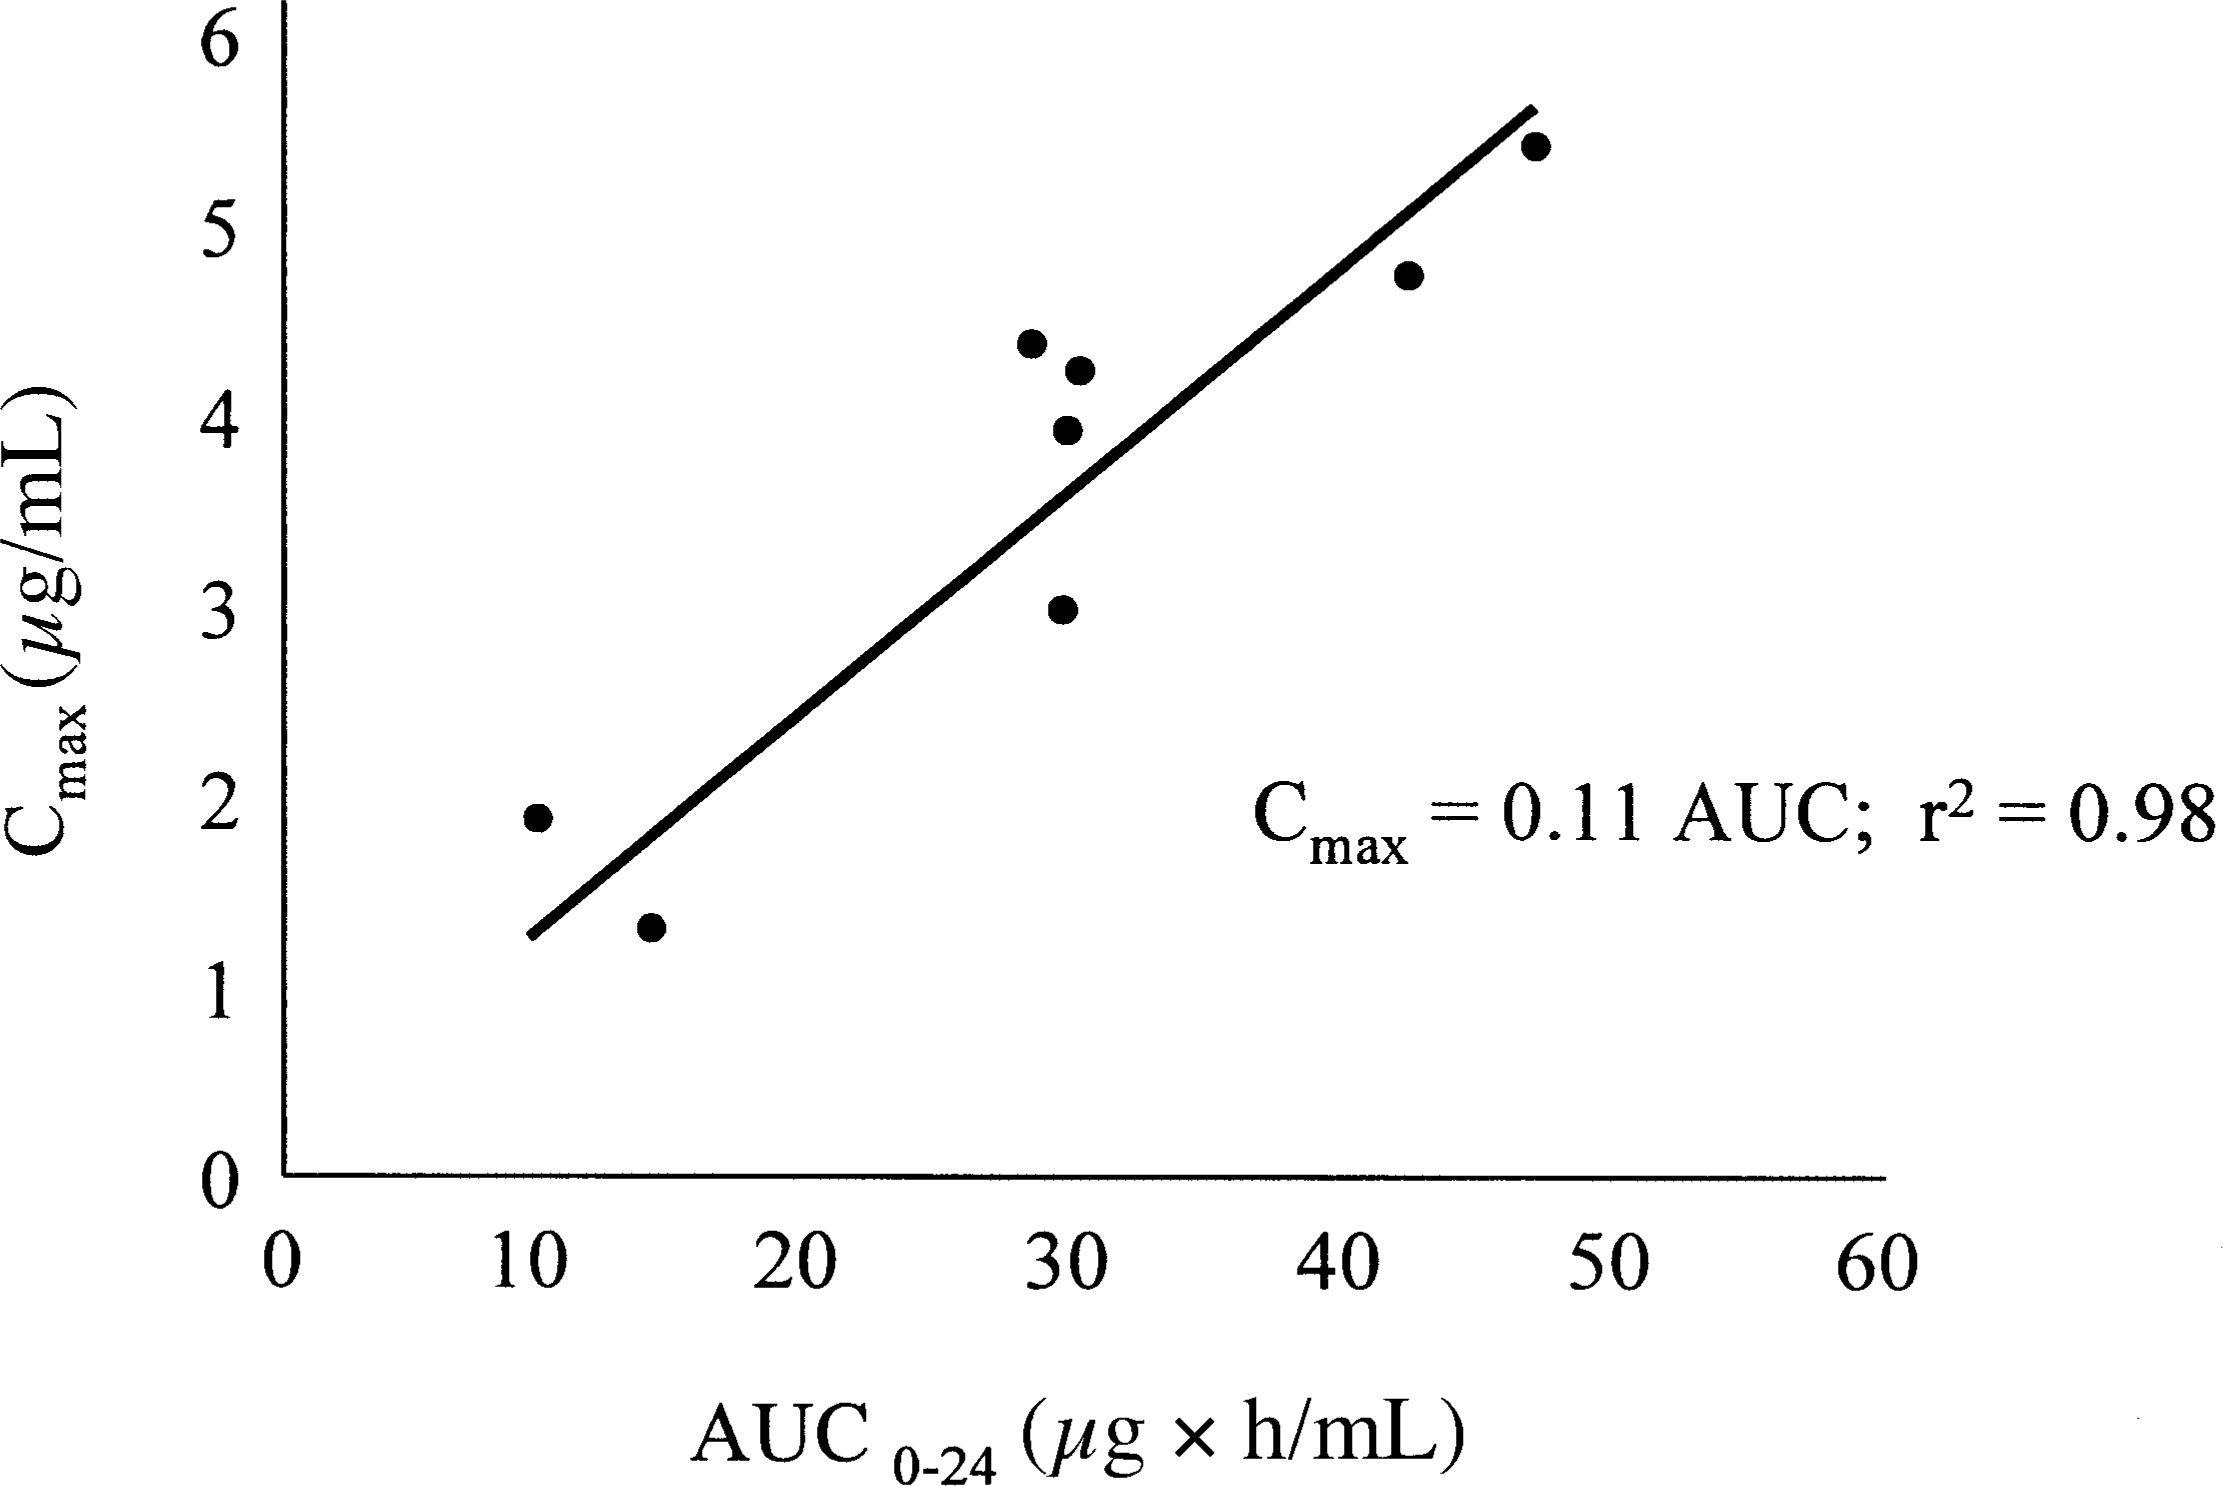
Relationship between AUC24 and peak:MIC for 8 different fluoroquinolones. The regression equation for the line is Cmax:MIC = 0.11 × AUC; r 2 = 0.98. 13 Reproduced with permission. (source of original graphical analysis, Alasdair Macgowan MD, November 2001, personal communication). Cmax = maximum concentration; MIC = minimum inhibitory concentration.
The study design used by Preston et al. 4 was similar to that of Forrest et al. 2 Both modeled data out of prospectively conducted registration studies, all of which had add-on pharmacokinetic sampling. In fact, both Preston et al. 14 and Forrest et al. 10 conducted more detailed companion evaluations dealing with the finer details of population pharmacokinetic modeling. In spite of the similarity in clinical data retrieval and mathematical approach, there were key differences in the patient populations and the efficacy endpoints between these studies. The Forrest et al. 2 database was almost entirely derived from studies of nosocomial LRTIs, where the organism population was 35% pseudomonas, 50% other gram-negative organisms, and 15% staphylococci. AUICs ranged from 6 to 5500. In contrast, Preston et al. 4 evaluated a much more varied and diverse patient population: 100 patients (75%) had pulmonary infections (acute bacterial sinusitis, acute bacterial exacerbation of chronic bronchitis, or CAP), 25 (19%) had complicated or uncomplicated bacterial skin infections, and 9 (6%) had acute pyelonephritis or complicated urinary tract infections. The geometric mean levofloxacin MIC in the microbiologically successful outcome group was 0.25 versus 2.64 in the unsuccessful group. As would be expected from the MIC values, AUICs ranged from 20 to 248. The AUIC range of the Preston et al. study may be too small to conclude much about break points, simply favoring a median value of approximately 50, as would occur with an MIC value of 1.0 μg/mL.
Perhaps more importantly, the principal difference between these 2 studies was found in the definition of the clinical and microbiologic endpoints. In the Preston et al. analysis, clinical success was defined as either cure (resolution of clinically significant signs and symptoms) or improvement (partial resolution of clinical signs and symptoms) of infections. Microbiologic success was defined as either proven or presumed eradication (actual numbers of each not defined). Patients did not undergo serial culturing, which precluded the determination of the day of bacterial eradication in the data analysis. It is not possible to define an AUIC for a drug with a concentration-dependent killing mechanism versus rate of microbiologic eradication in this database. Furthermore, it is not possible to discriminate between the effects of the antibiotic and the effects of the host defense system, which seems so clearly apparent if one examines the differences between neutropenic and non-neutropenic animals. 15 In spite of these difficulties, Preston et al. 4 concluded that a peak:MIC ratio of 12.2:1, associated with an AUIC of 110 (calculated from peak), is the break point for levofloxacin effectiveness. Definitive human evidence supporting a lower break point of 30–50 for levofloxacin versus S. pneumoniae was not found in this study. Such a conclusion might be obtained only from a serial culture trial of patients harboring this organism. The serial culture technique was not applied by either Preston et al. 4 or Ambrose et al., 5 effectively preventing these studies from detecting concentration-dependent killing in their fluoroquinolone modeling.
Forrest et al. 2 were capable of discriminating differences in the rate of bacterial killing in relationship with the achieved AUIC. Other trials using this design have also derived useful AUIC break points in human infections, as was shown by the cefmenoxime studies,16,17 aztreonam versus tobramycin,11,12 and grepafloxacin in acute bacterial exacerbation of chronic bronchitis.6,7
Gatifloxacin Analysis
A composite analysis of human trials comparing gatifloxacin and levofloxacin AUIC has been published. 5 The authors examined the relationship between drug exposure and clinical and microbiologic responses in patients with community-acquired respiratory tract infections involving S. pneumoniae. The study population included 58 patients who were enrolled in either of 2 Phase III studies of levofloxacin versus gatifloxacin for the treatment of CAP or acute exacerbation of chronic bronchitis (AECB). Of 778 patients enrolled in the 2 studies, 376 were microbiologically evaluable but only 58 had either CAP or AECB associated with S. pneumoniae. Unbound drug AUCs were determined using a validated regression equation for levofloxacin and an unpublished equation for gatifloxacin.
The authors determined that an unbound drug AUIC >33.7 was required to produce 100% microbiologic response for both levofloxacin and gatifloxacin. A significant AUIC break point for clinical response was not found. In fact, the mean unbound drug AUIC value in patients who failed to show a clinical response above the 33.7 break point was 472. 5
There are several issues to consider in this analysis. It is interesting that the same break point was found for both drugs, because gatifloxacin appears to be approximately twofold more active than levofloxacin in vitro and yet gatifloxacin AUIC values of 30–50 are proven to be bacteriostatic in the murine model. 18 One of the 2 clinical trials also found better microbial outcomes with gatifloxacin in the treatment of CAP. 19 In these studies, microbiologic efficacy was determined 7–14 days after completion of the study drug and was based on proven or presumed eradication or persistence depending on the ability of the patient to produce sputum at the time of follow-up.
The analysis does not reveal how many patients actually had culture-proven microbiologic success or failure. 19 It is also important to note that drug exposure in these patients was calculated from dose and population pharmacokinetics; actual pharmacokinetic sampling of patients was not employed in this pharmacokinetic/pharmacodynamic analysis. Therefore, serum concentrations for patients who failed clinically were not available, and it is not known whether those failures were associated with levofloxacin or gatifloxacin. More frequent failures in levofloxacin-treated patients might imply that baseline mutants were present in the overall trial population; this may have accounted for the small percentage of failure. 19 Unfortunately, the S. pneumoniae organisms in this trial were not tested for mutations to fluoroquinolones, either at baseline or after treatment failures. Overall, this analysis clearly demonstrates that the typical Phase III clinical trial methodology, where microbiologic cures are presumed and not proven by culture and where there are no serial cultures to establish bacterial killing rates, can neither differentiate 2 antimicrobials nor identify the long-sought evidence of fluoroquinolone concentration-dependent killing against the pneumococci.
Within the limitations of presumed microbiologic cure or use of an endpoint culture long after the last dose, this analysis predicted a break point AUIC of 33.7 for both gatifloxacin and levofloxacin. 5 Although there is some comfort in the observation that the same AUIC describes both antibiotics, the low overall value further illustrates that differentiation between fluoroquinolones is impossible unless one uses serial culture and determines the time to bacterial eradication. While this finding is not surprising, the challenge remains to identify the correct AUIC break point for concentration-dependent killing by levofloxacin and gatifloxacin.
Grepafloxacin Pharmacokinetic/Pharmacodynamic Trial
The break point AUIC question for S. pneumoniae remains a topic of debate, awaiting definitive human data to refine the break point for killing of a gram-positive organism by a fluoroquinolone. Both of the necessary pharmacokinetic/pharmacodynamic procedures of pharmacokinetic sampling and serial cultures have not yet been combined to study ciprofloxacin, levofloxacin, gatifloxacin, or moxifloxacin. There are, however, some data from an older multicenter, Phase II dose-finding study of grepafloxacin against S. pneumoniae, where both pharmacokinetic sampling and serial culturing of the patients were performed to define the day of organism eradication.6,7 This study was originally conducted to define the dose of grepafloxacin for the treatment of AECB. In the final pharmacokinetic/pharmacodynamic analysis, there was a subset of 12 patients with infections due to S. pneumoniae and who also had both pharmacokinetic sampling and microbiologic outcomes via serial cultures. 6 As shown in Figure 4, the relationship between AUICs and speed of bacterial killing was examined, and it was discovered that more rapid killing of S. pneumoniae was associated with AUIC values >100. 7 Bacterial eradication occurred within 48 hours when AUIC values were >100.
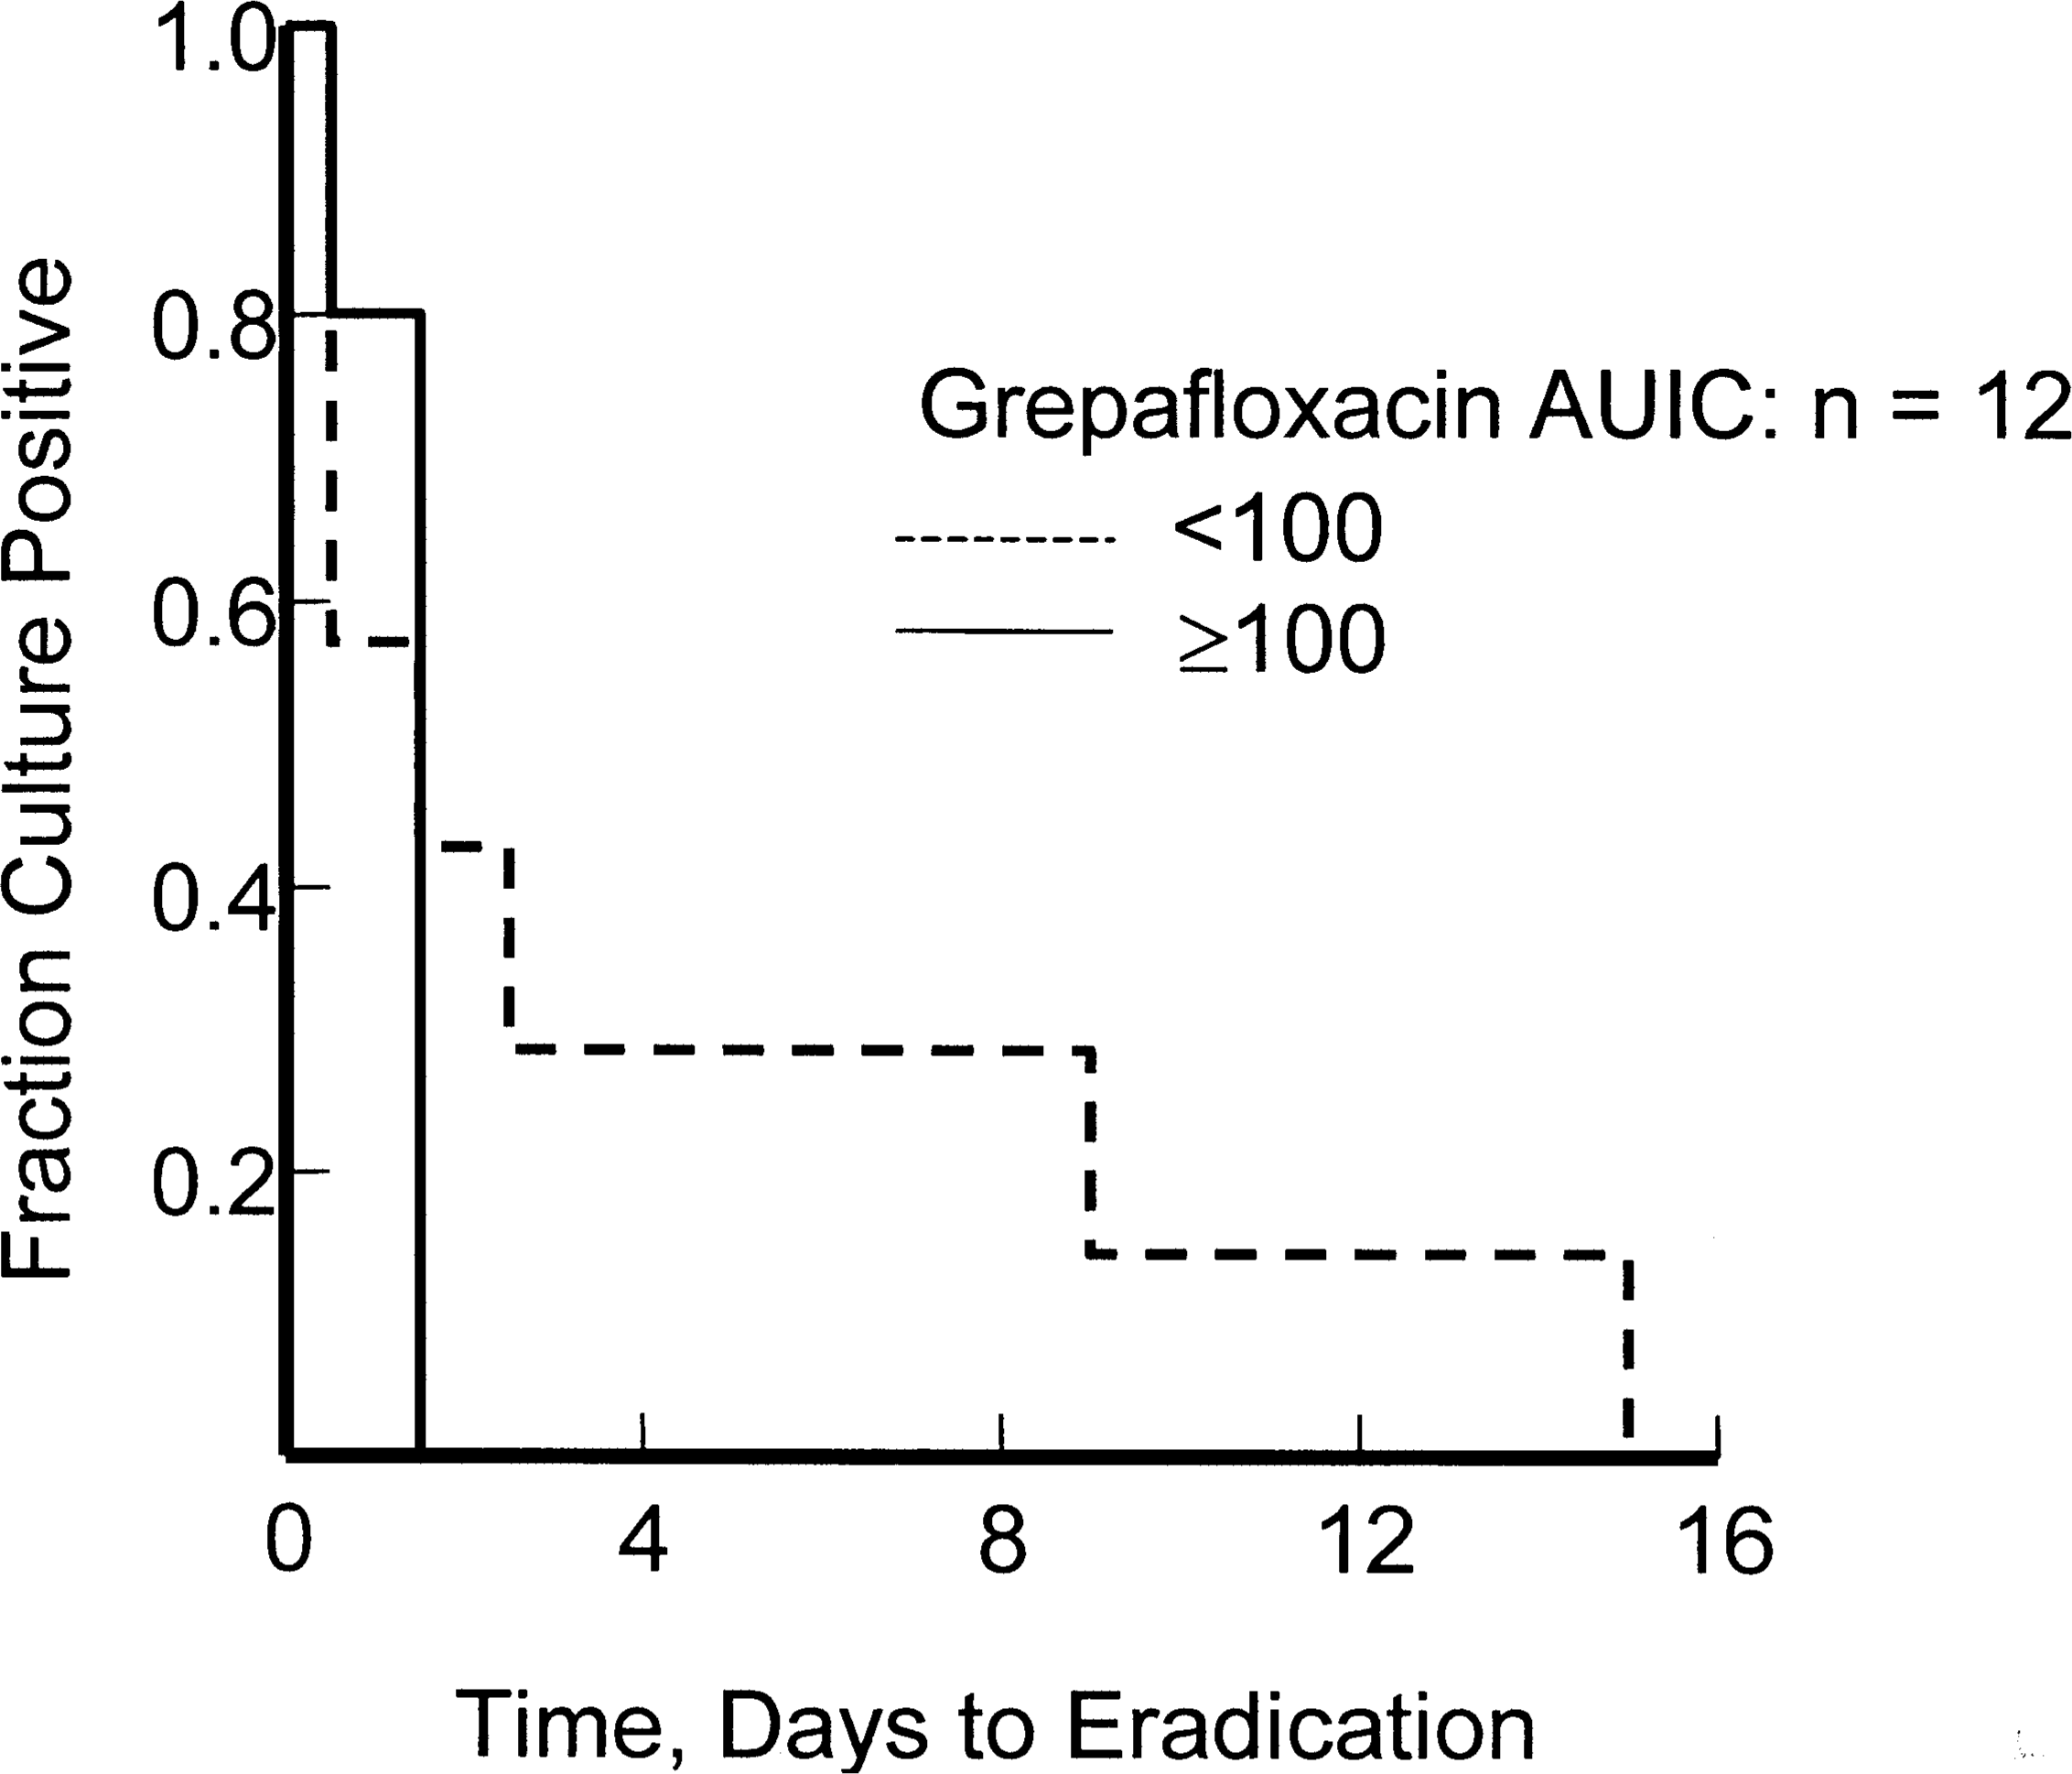
Grepafloxacin versus S. pneumoniae in 12 patients with AECB and the relationship between AUIC24 and culture positivity each day of culturing. The relationship was significant at p < 0.05. All patients with AUIC <100 had persistence of positive cultures beyond treatment day 7. 7 AECB = acute exacerbation of chronic bronchitis; AUIC = area under the inhibitory concentration–time curve.
This break point for grepafloxacin versus S. pneumoniae is consistent with previous human studies that used serial cultures to examine gram-negative organisms. 2 The previously published graph of grepafloxacin AUIC versus time to organism eradication was a composite of all organisms (mostly Hemophilus influenzae). The original composite analysis showed a nearly identical pattern to Figure 4, and the composite break point for rapid eradication by grepafloxacin was also well above an AUIC of 100. 7 Thus, for grepafloxacin, a newer gram-positive fluoroquinolone, it does not appear to matter whether we are discussing the gram-negative organism H. influenzae or the gram-positive organism S. pneumoniae; the break point AUIC of 100 appears useful in either case. Of course, relatively few H. influenzae have quinolone AUICs <100; therefore, overall, these agents are less likely to fail or create resistance in H. influenzae than they are in S. pneumoniae infections. Finally, there were relatively few patients in this analysis, and more studies should be conducted using similar methodologies to test these AUIC break point conclusions versus other fluoroquinolones.
The grepafloxacin database also allowed clinical outcomes to be correlated with the speed of bacterial eradication. 6 Each patient was interviewed and cultured daily. Forty-nine of 76 patients were evaluable for both AUICs and for changes in their infection signs and symptoms. A Cox regression analysis was performed to associate time to clinical success and time to reduction in sputum volume, coughs per day, and sputum neutrophil percentages with factors such as AUIC. The investigators determined that an AUIC <276 (p < 0.03) and/or the presence of mild bronchiectasis (p < 0.01) were associated with longer time to clinical resolution. In addition, a relationship was found between an AUIC >212 (p < 0.01) and AUIC >576 (p < 0.02) and decreasing days to sputum volume reduction and coughs per day, respectively. A diagnosis of mild bronchiectasis prolonged the time to reduce coughs per day (p < 0.03) and neutrophil percentage (p < 0.01). The AUIC was found to be an important pharmacokinetic/pharmacodynamic parameter predictive of successful outcome in AECB, even in subjects with mild bronchiectasis. Unfortunately, grepafloxacin was subsequently withdrawn from worldwide markets. This additional analysis of the database, however, illustrates the relationship between fluoroquinolone pharmacodynamics against gram-positive pathogens and clinical efficacy.
AUICs versus Bacterial Resistance
A review investigating the frequency of bacterial resistance included 173 clinical trials, incorporating 14 000 patients and 7 different antibiotic classes. 20 The authors reported an overall rate of bacterial resistance of 4%, while in LRTIs the incidence was 8.9%. Factors within the intensive care unit (ICU) setting, such as mechanical ventilation and multiple underlying diseases, appeared to contribute to further increases in the frequency of bacterial resistance. There was a slightly lower frequency of resistance with combination therapy than monotherapy. The resistance rate of 7% reported for the ICU population (9% in ventilated patients) was less than the 25% overall rate of resistance reported in many studies, prompting a review of the pharmacokinetic/pharmacodynamic correlates of resistance as a result of selective pressure.
The selection of bacterial resistance was examined in relationship with antibiotic pharmacokinetics and organism MIC in the patients from 4 nosocomial LRTI clinical trials. 9 The evaluable database included 107 acutely ill patients, 128 pathogens, and 5 different antimicrobial regimens. Antimicrobial pharmacokinetics were characterized using serum concentrations. Culture and sensitivity tests were performed daily on tracheal aspirates to determine the rate of resistance in relation to the day the MIC rose above the laboratory-defined break point for resistance. This is considered a measure of time-related selective pressure as applied whenever patients are given doses insufficient to eradicate the organism. Overall, 32 of 128 (25%) initially susceptible cases developed resistance during therapy. The pharmacodynamic parameter predictive of development of resistance was an AUIC value <100 (p < 0.001) (Figure 5).8,9
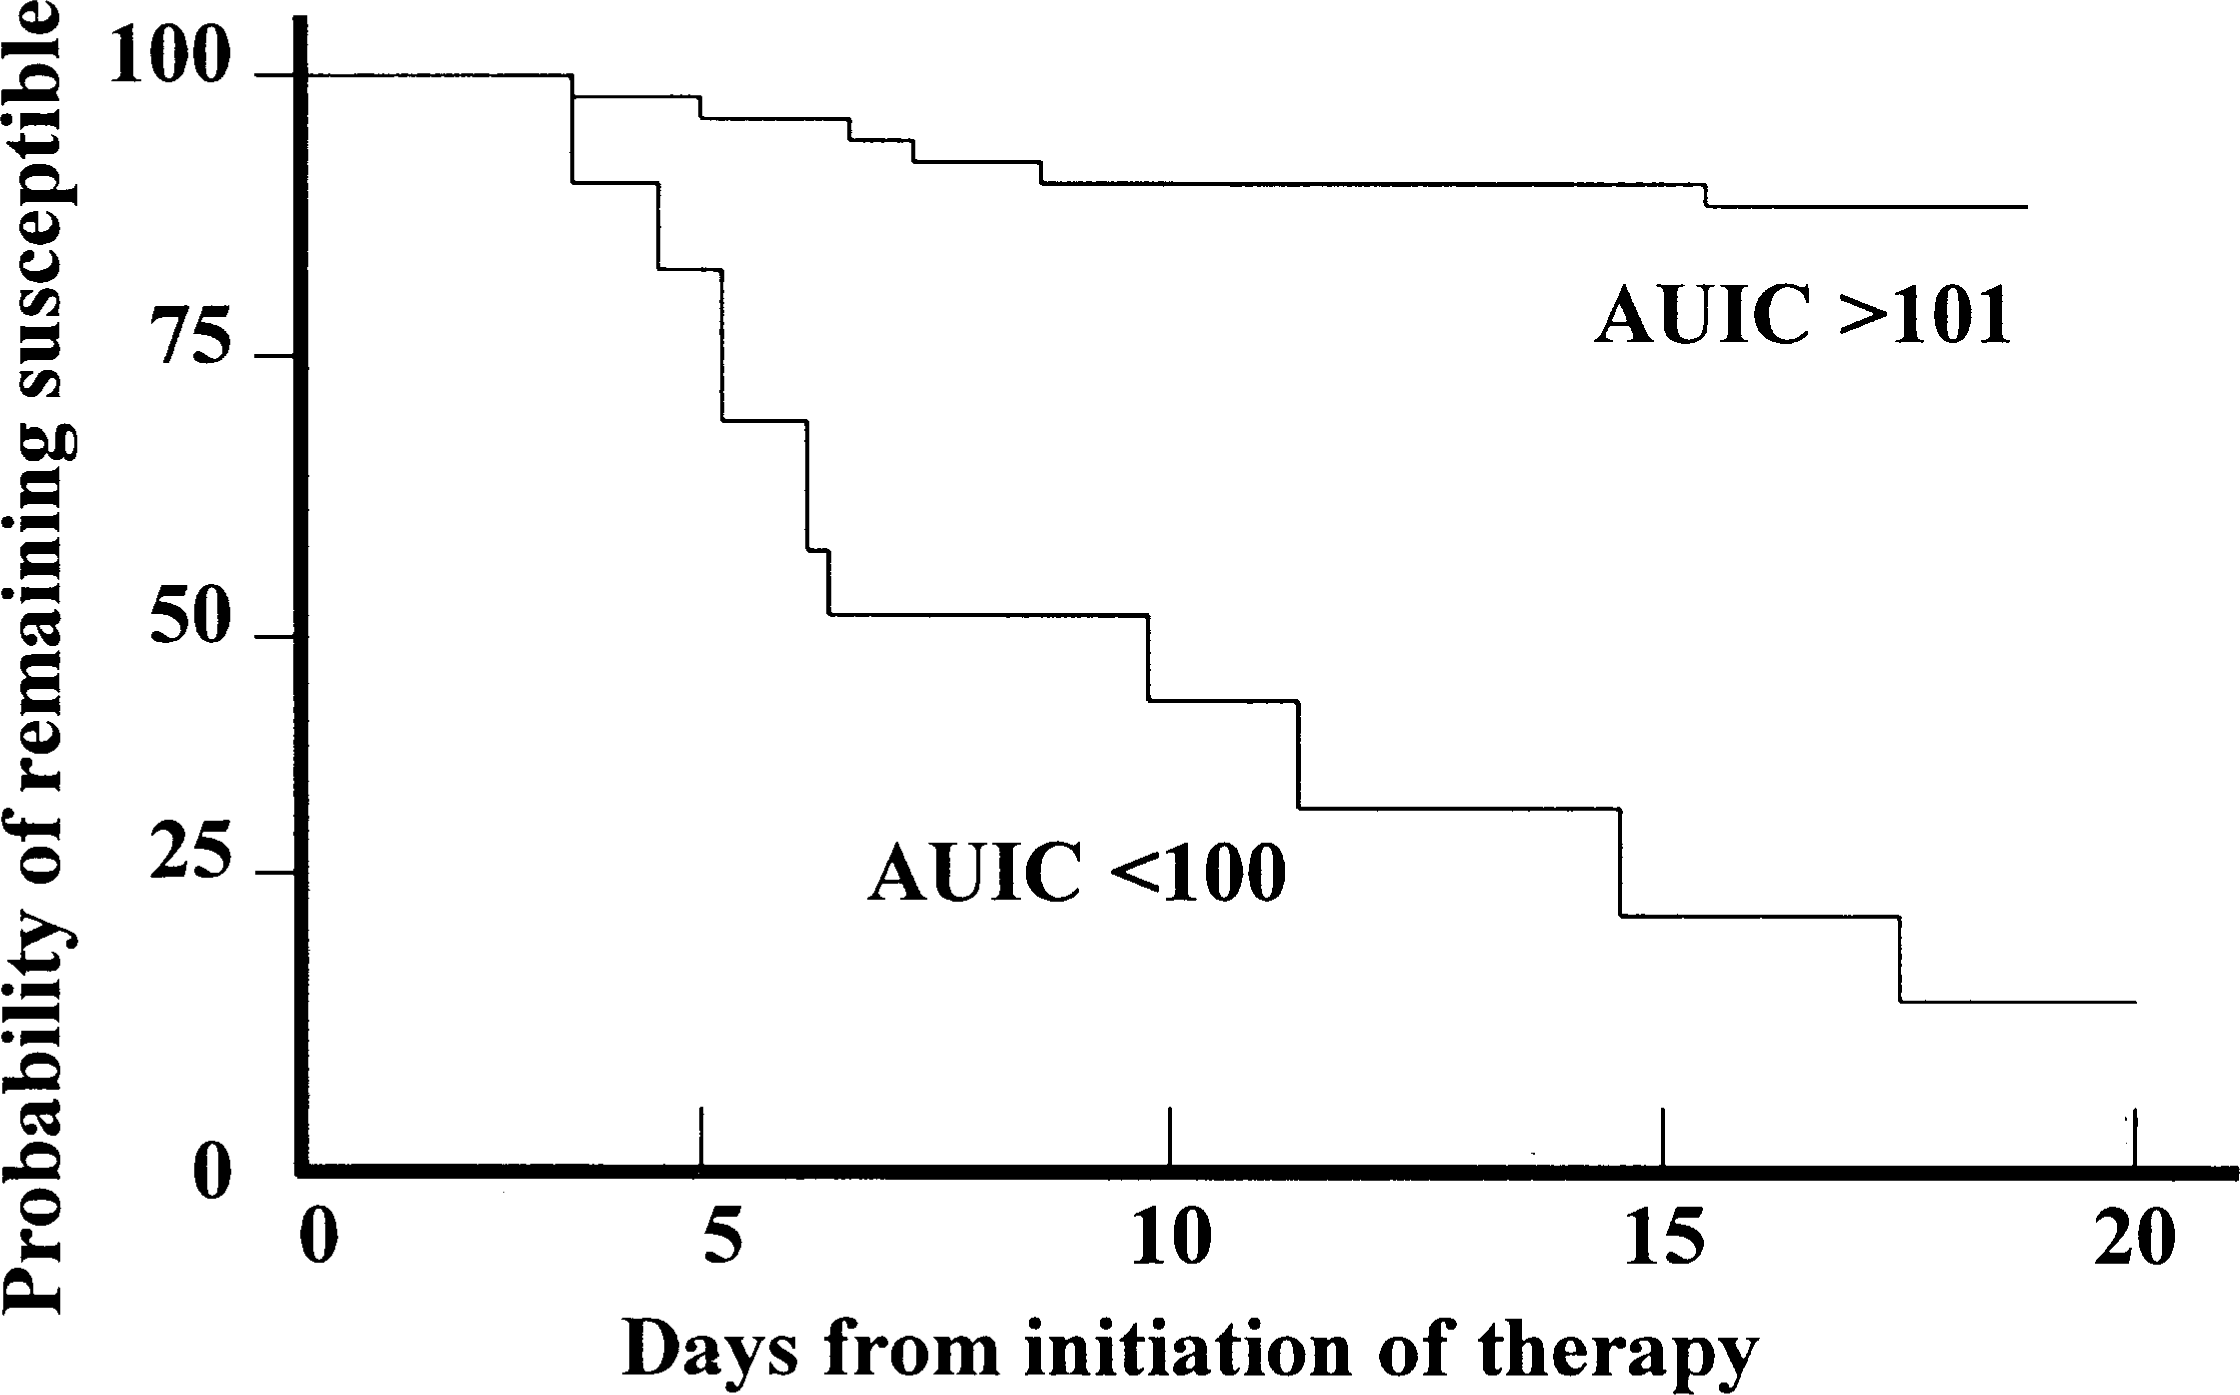
Relationship between the initial AUIC and the time to onset of organisms developing resistance in 127 patients. When the initial AUIC was >100, only 8% of patients developed resistant organisms to the antibiotic responsible for the AUIC >101. When the initial AUIC was <100, 93% of the patients developed resistance to the antibiotic started at that low AUIC value. This analysis employed hospitalized patients with serial cultures of the infection site, receiving a variety of antimicrobial regimens, including fluoroquinolones in many cases alone and in combination.8,9 AUIC = area under the inhibitory concentration–time curve.
Combination therapy had lower rates of resistance compared with monotherapy. This was most likely due to the fact that all combination regimens had a composite AUIC (i.e., the sum of each antibiotic's AUIC) in excess of 100. These data suggest that resistance can be avoided or at least minimized with close attention to dosing and organism MIC to yield an AUIC of at least 100. 9 Another study of ciprofloxacin and development of resistance in P. aeruginosa infection also determined that an AUIC >100 appeared to reduce the rate of resistance in acutely ill patients. 21 In the face of worldwide increases of MICs with S. pneumoniae infection, close attention to appropriate dosing in relation to MICs may delay and potentially prevent resistance in this organism as well.
Creating selective pressure on any antibiotic class by using members at low AUICs may ultimately destroy the entire class. In this case, the class member that is routinely dosed at a low AUIC will be readily implicated. Table 1 details MIC90 values and 24-hour AUIC values for P. aeruginosa and S. pneumoniae against 3 fluoroquinolones (ciprofloxacin, levofloxacin, moxifloxacin) using standard dosing. Levofloxacin, which simultaneously produces low AUICs and extreme selection pressure against both P. aeruginosa, as the indicator gram-negative pathogen, and S. pneumoniae, as the indicator gram-positive pathogen, appears to be a likely contributor to fluoroquinolone resistance with these organisms. Likewise, ciprofloxacin and moxifloxacin may also create selective pressure with S. pneumoniae and P. aeruginosa, respectively. Some of the evidence for this comes from in vitro experiments, but perhaps the most compelling evidence to date is from epidemiologic investigations of P. aeruginosa in hospitals that change their fluoroquinolone formulary. There are strong relationships between increasing use of ofloxacin and levofloxacin and increasing hospital resistance of P. aeruginosa,22,23 while ciprofloxacin at higher AUICs is not associated with the rapid development of this resistance. 22 Furthermore, changing back to more active fluoroquinolones against P. aeruginosa, such as ciprofloxacin, has led to reversal of the fluoroquinolone resistance in at least some cases.24,25
Clinical Failures with Fluoroquinolones
In 1991, Lee et al. 26 were the first to call attention to fluoroquinolone treatment failures in S. pneumoniae infections, with the implicated drug in this case being ciprofloxacin. Details of the 6 cases were published in a letter to the editor, but never in full form. Inspection of these cases of ciprofloxacin failure versus pneumococci reveals that these failures could have been due to low AUCs, since most patients were given 250 mg every 12 hours or were the result of giving ciprofloxacin with antacids, thereby reducing bioavailability. Regrettably, genomic studies were not yet available to determine whether efflux or 1-step mutations were present in the organisms, and even MICs were not always reported. It is doubtful whether the organisms in question had high MICs to explain the failures, since the majority of organisms in the 1980s and early 1990s had ciprofloxacin MICs <0.5 μg/mL.27–32 Furthermore, it seems unlikely that there were fluoroquinolone parC mutations or even active efflux pumps this early in the evolutionary cycle of the pneumococci. Efflux and mutations in parC are both relatively new events, and both appear to have evolved after many years of fluoroquinolone use. Fluoroquinolone failures with mutations as the proven cause were still rather uncommon in most parts of the US even in 1999. 33 The failures here were therefore due to low AUICs from low doses, drug interactions, or both. In this case, ciprofloxacin was then no longer used for treatment of S. pneumoniae. For similar reasons and using similar logic, there are now calls for cessation of use of levofloxacin against S. pneumoniae. 34
Since AUIC is the pharmacokinetic/pharmacodynamic parameter that seems to best predict microbiologic and clinical efficacy for the fluoroquinolones, a low AUC or a high MIC could produce a treatment failure. Either factor could explain failures that are being reported now for levofloxacin against S. pneumoniae.35–38 The number of these accounts may be predicted to increase as the population of wild-type S. pneumoniae shifts to 2-step mutants. The levofloxacin failures involving double mutants would have AUICs <20 with current dosing recommendations and MICs ≥4. 39 Recent experiences in Toronto provide some insight into this dilemma, with a report of 2 cases of levofloxacin clinical failure. 37 Both of these patients lacked prior exposure to fluoroquinolones, and both apparently acquired their baseline organisms in the community surrounding Toronto. Low AUIC was contributory to development of resistance to levofloxacin in both of these patients. The AUICs achieved (20–50) were in the range advocated for this drug by others.5,40,41 Some of these AUICs were <20 and would not be expected to achieve even a bacteriostatic effect in animal models. 15
Host Defense, Resistance, and Use of Low AUIC Fluoroquinolones
In order to ensure clinical success in patients, extensive reliance on host defense is not desirable if the goal is to produce rapid killing of the bacteria in a concentration-dependent manner. It is even more problematic if there is no real evidence that its killing is enhanced by the immune system, as may be the case for some fluoroquinolones under at least some in vitro conditions. 42 Furthermore, an AUIC <100 in a setting of marginal host defense may preclude organism eradication. This also raises the possibility of resistance selection due to low exposure concentrations even when the patient survives and is clinically cured. If clinicians are encouraged to use a low AUIC target such as 33, as recently derived from a clinical trial analysis, 5 further selection pressure on increasing numbers of 1-step mutants occurs in the community. Patients who will most likely manifest this type of resistance first are those with reduced host defenses, the immunocompromised, and the elderly. These populations were at the highest risk of developing resistance in a case–control analysis. 36 In another population at high risk for resistance, children with otitis media, resistance has been thus far successfully avoided because of strong objections to use of fluoroquinolones from investigators. 43
The question then arises as to how long a community should continue to use lower-potency fluoroquinolones that rely heavily on host defenses. 34 If, for example, a community waits until levofloxacin MICs increase to 8.0 μg/mL, then belated attempts to switch all patients who most likely have infections caused by double mutant strains resistant to gatifloxacin or moxifloxacin will fail. Levofloxacin MICs >8.0 are a clear signal that appreciable numbers of these organisms are already double mutants, and most are likely to have efflux mechanisms.44–46 Organisms with the efflux mechanism are less sensitive to 8-methoxy fluoroquinolones (i.e., moxifloxacin, gatifloxacin). It is not known whether earlier conversion to these more potent fluoroquinolones should be considered, such as at the time that single-step mutants appear in the organism population.
Based on what is currently known about fluoroquinolones and their ability to select bacterial mutations out of mixed-organism populations, it appears that complete replacement of low-potency fluoroquinolones with newer, high-potency fluoroquinolones is unlikely to accelerate the frequency of selected parC resistance in S. pneumoniae and, in fact, may even extinguish the resistance. There are several points to consider, however, with some of the new fluoroquinolones. First, moxifloxacin, assuming it can achieve an AUIC of 125–250 against parC mutants, should kill these organisms within 7 days.47–49 Gatifloxacin dosed at 400 mg once daily often yields an AUIC <100 by Monte Carlo simulation. 34 Precise killing rates with gatifloxacin and moxifloxacin have not yet been determined because the CAP studies used for Food and Drug Administration registration trials have not employed serial culturing.
Second, the 8-methoxy fluoroquinolones moxifloxacin and gatifloxacin are nearly immune to efflux pump extrusions. Without these efflux pumps, the initial AUICs for wild-type strains remain high and reduce the chances for selection pressure and development of a mutant strain. 44
MIC90 Values and 24-hour AUIC Values for Pseudomonas aeruginosa and Streptococcus pneumoniae
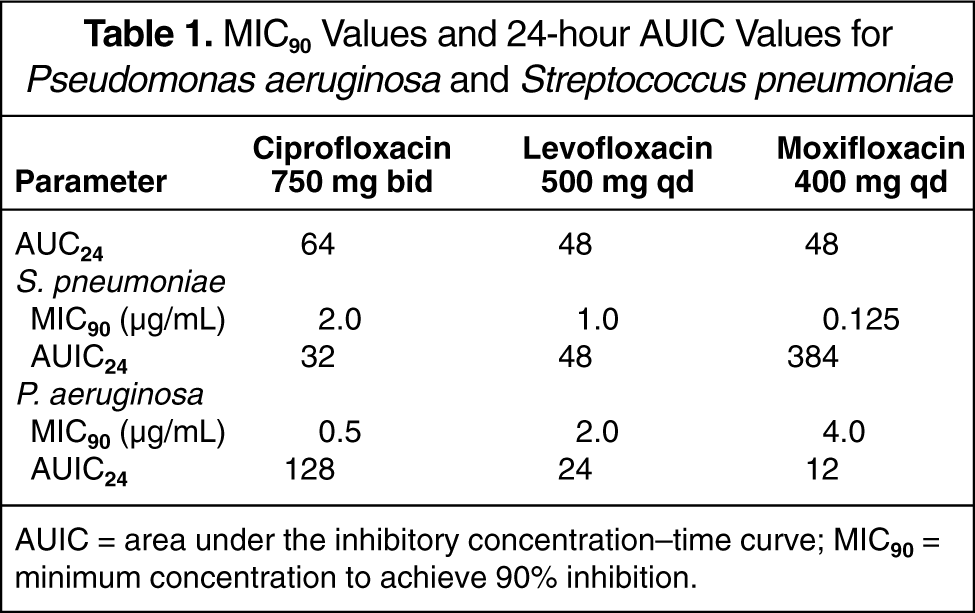
AUIC = area under the inhibitory concentration-time curve; MIC90 = minimum concentration to achieve 90% inhibition.
Third, both moxifloxacin and gatifloxacin select gyrA mutants and, thus far, the mutants selected by gatifloxacin are usually inhibited by levofloxacin. 50 This is probably why gyrA mutants are rare in communities that primarily use levofloxacin, except where the continued selective pressure of low AUICs from levofloxacin has converted parC mutants into double mutants.
In this era of rapidly accelerating fluoroquinolone resistance in S. pneumoniae, there are compelling reasons to quickly replace the older agents with newer, more active fluoroquinolones. 34 This is the position recently outlined in the American Thoracic Society guidelines for the treatment of CAP that might avoid the rapid loss of efficacy of the entire fluoroquinolone class. 51 Unfortunately, we do not have all of the information needed to decide when a community should take this action. 34 It is not known whether parC mutants arising from excessive use of lower-potency fluoroquinolones could be extinguished in a community by using more active fluoroquinolones that do not produce parC mutations. Clinical studies must be done to demonstrate that in vivo killing rates of S. pneumoniae are faster in patients treated with fluoroquinolones at AUICs >250 in comparison to patients treated at AUICs of 30–50. Symptom scoring must be adapted to community infections and must be used to test whether a more rapid clinical response directly follows a higher AUIC and more rapid killing of bacteria. 52
Other Options for Treating Fluoroquinolone Failures
One option for a community faced with increasing fluoroquinolone failures due to resistance may be routine vaccination against S. pneumoniae, since treatment options are limited by virtue of the fact that some of these isolates will also be macrolide and penicillin resistant. 53 Diversification of antibiotic exposure in the community may also be effective.34,54,55 Combination therapy with fluoroquinolones and other antibiotic classes may be useful, although there are no data on its safety and efficacy. Replacement strategies within the fluoroquinolone class have apparent benefit for some mechanisms of resistance. For example, the removal of levofloxacin with a return to ciprofloxacin has restored pseudomonas susceptibility to ciprofloxacin in some hospitals.22,24,25,56 Whether the cycling/replacement strategies will help the problem of S. pneumoniae resistance is an unanswered question, since the reason for pseudomonal resistance is most likely the result of efflux and responds to removal of the offending antibiotic. However, S. pneumoniae resistance to fluoroquinolones starts with efflux, but is followed closely by target mutations and may not be extinguished so readily. 34
New antibiotic classes may help in settings where the environment of selective pressure has been altered. Telithromycin, a ketolide antibiotic, may be useful in the setting of increased S. pneumoniae resistance.57–61 This new antibiotic class is likely to be priced similarly to the macrolides and fluoroquinolones. Telithromycin is already available in Europe, and it may reach the market in the US early in 2004. This agent is available orally and is active against S. pneumoniae that are resistant to penicillins, macrolides, and fluoroquinolones. Vancomycin, linezolid, quinupristin/dalfopristin, and other new gram-positive antibiotics are our remaining lifelines if the current situation rapidly progresses and the entire fluoroquinolone class is compromised by low AUICs. Linezolid has an advantage over quinupristin/dalfopristin by virtue of being indicated against CAP and S. pneumoniae, and is available in both intravenous and oral dosage forms. The in vivo pneumococcal killing rate of these alternatives against single- and double-mutant fluoroquinolone-resistant S. pneumoniae should be prospectively evaluated.
Summary
Using concentration-dependent pharmacokinetic/pharmacodynamic endpoints to interpret data collected across the systems of in vitro, animal, and human clinical trials, it is clear that the rate of bacterial killing is dependent upon drug exposure and organism susceptibility, as defined by AUIC or peak:MIC. The comparisons of fluoroquinolone concentration-dependent killing behavior versus AUIC across these 3 systems can be seen in Table 2 and apply across the entire fluoroquinolone class and bacterial strains. As the AUIC rises, the rate of bacterial killing increases, regardless of organism. At a given AUIC or peak:MIC, the same processes are at work in all 3 models and common bacteriostatic break points can be identified. Any substantial differences between these systems arise from the lack of sufficient data to establish the rate of organism killing rather than as a question as to the applicability of the principle itself.
Rate of Bacterial Eradication Controlled by AUIC
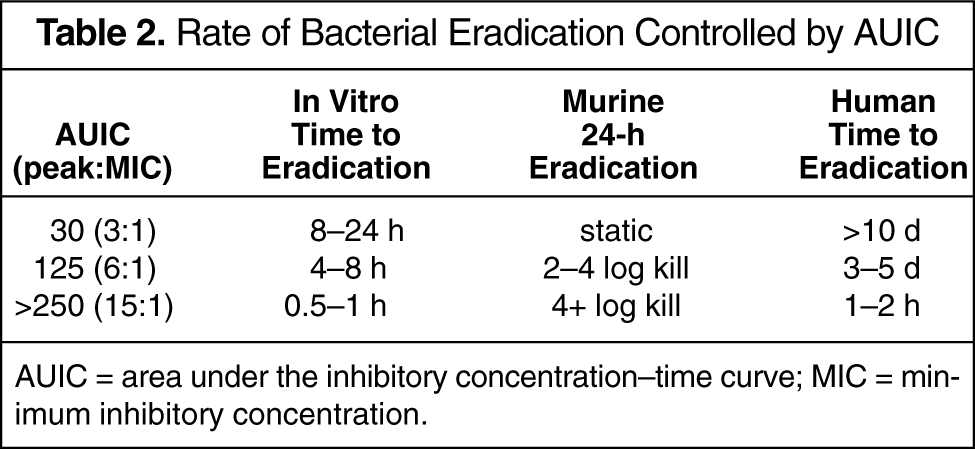
AUIC = area under the inhibitory concentration–time curve; MIC = minimum inhibitory concentration.