
Abstract
BACKGROUND
Although patients are instructed to abstain from food before having blood drawn for lipid analysis, many still drink coffee in the morning. It is unknown whether coffee consumed prior to drawing blood samples will impact fasting serum lipids.
OBJECTIVE
To determine whether a single 6-oz cup of coffee with or without the addition of nondairy creamer and sugar will significantly affect fasting plasma lipid profiles.
METHODS
This was a prospective, open-label, randomized crossover study. At the first of 2 visits, blood was drawn to measure initial fasting lipid panels, and participants were randomized to drink 6 oz of black coffee or coffee with nondairy creamer and sugar. Within 30–60 minutes of coffee consumption, blood was drawn for follow-up lipid panels. The procedure was repeated at the second visit, except the participants were crossed over to receive the alternate coffee preparation.
RESULTS
Forty participants (26 men; age [mean ± SD] 45 ± 15 y) were enrolled. Total cholesterol (TC) increased from 188.2 ± 38.1 to 191.3 ± 39.9 mg/dL (p = 0.019) and high-density lipoprotein cholesterol (HDL-C) increased from 43.2 ± 12.3 to 44.8 ± 12.9 mg/dL (p < 0.001) after consumption of black coffee. Triglycerides decreased from 145.6 ± 123.7 to 136.3 ± 107.1 mg/dL (p = 0.014) after consumption of coffee with nondairy creamer and sugar. Changes in other lipid parameters, such as low-density lipoprotein cholesterol in either group, were not statistically significant.
CONCLUSIONS
A single cup of coffee consumed within one hour before drawing blood resulted in statistically, but not clinically, significant differences in TC and HDL-C (black coffee) and triglycerides (coffee with creamer and sugar).
In the treatment of dyslipidemia, pharmacotherapy focuses primarily on reducing serum lipid levels. Ideally, patients fast for 12 hours prior to having blood drawn for lipid analyses to monitor the efficacy of lipid-lowering medications. The fasting state is needed to obtain accurate triglyceride levels and calculate low-density lipoprotein cholesterol (LDL-C) using the Friedewald equation. 1 Due to cost and labor, many laboratories calculate LDL-C instead of directly measuring levels. However, the equation underestimates LDL-C when triglycerides are elevated, such as in the nonfasting state. 2 Unfortunately, fasting from breakfast may be difficult for patients who drink coffee every morning. Some patients may even feel unable to function without a habitual cup of coffee prior to their activities. Therefore, the objective of this study was to evaluate the effects of coffee on fasting lipid panel results when consumed within one hour of blood analysis.
Prior studies have evaluated the effects of chronic coffee consumption on serum cholesterol. Several Scandinavian studies have shown elevations in serum cholesterol levels in patients drinking boiled, unfiltered coffee over a period of several weeks.3,4 One study found that this effect may be dose dependent, as the difference in serum total cholesterol (TC) correlated with the amount of boiled coffee consumed. 5 The increase in lipids is believed to be attributed to diterpene esters, kahweol and cafestol, which are naturally present in coffee oils.6–8 Kahweol and cafestol have been shown to increase the activity levels of cholesteryl ester transfer protein and phospholipid transfer protein while decreasing the activity level of lecithin:cholesterol acyltransferase, thereby contributing to a rise in LDL-C. 9 The method of coffee preparation may be an important factor in the amount of kahweol and cafestol in coffee because these esters are removed when coffee is brewed through a paper filter.10,11 However, prior studies using filter-brewed coffee have resulted in mixed findings.12–14 As of May 11, 2005, this is the first study, to our knowledge, to evaluate the acute effects of filtered coffee, with and without the addition of nondairy creamer and sugar, on lipid panel results.
Methods
DESIGN
This was a prospective, open-label, randomized crossover study. Subjects were included if they did not start, change, or discontinue any medications in the 4 weeks before enrollment. Potential subjects were excluded if they had contraindications to drinking coffee, such as pregnancy and uncontrolled hypertension. Participants were scheduled for 2 study visits within 7 days and fasted 12 hours before each visit. At the first visit, blood was drawn for an initial fasting lipid panel (TC, LDL-C, high-density lipoprotein cholesterol [HDL-C], triglycerides, non–HDL-C), and the participant was randomized to receive 6 fluid ounces of either black coffee or coffee with nondairy creamer and sugar. Within 30–60 minutes of coffee consumption, a follow-up lipid analysis was performed. At the second visit, the procedure was repeated, except participants were crossed over to the second arm to receive the other coffee preparation.
ENDPOINTS
The primary endpoint of the study was a change in LDL-C from the initial fasting results to the post-coffee consumption results. Secondary endpoints were changes in TC, HDL-C, triglycerides, and non–HDL-C from the initial results to the follow-up results.
STUDY CENTER
The study was performed at the Veterans Affairs San Diego Healthcare System, La Jolla, CA. The protocol was approved by the University of California San Diego Human Research Protections Program and the Veterans Affairs San Diego Research and Development Committee, and each subject gave written informed consent before participation.
COFFEE PREPARATION METHODS
Coffee preparation was performed by the research staff using Folgers Classic Roast Ground Coffee, Medium Roast (Procter & Gamble, Cincinnati, OH). Ground coffee was measured on a balance (TI-64, Denver Instrument Company, Denver, CO). One tablespoon, standardized as 5 g, of ground coffee was used to prepare one serving (6 fluid oz) of coffee, following the manufacturer's directions. Coffee was brewed using 20 g of ground coffee for every 24 fluid oz of water in a Mr. Coffee 24-cup commercial coffeemaker with Mr. Coffee paper filters (Sunbeam Products, Inc., Boca Raton, FL). For coffee with creamer and sugar, 2 packets of powdered nondairy creamer (US Foodservice, Columbia, MD), weighing 4.88 g, and 2 packets of sugar (US Foodservice, Columbia, MD), weighing 5.34 g, were added to 6 oz of coffee. Each packet of nondairy creamer had 2 g of total carbohydrates, 0.5 g of total fat, and no cholesterol.
LABORATORY METHODS
TC, HDL-C, and triglyceride analytes were measured by enzymatic procedures on a CRMLN-certified Synchron LX 20 analyzer (Beckman Coulter, Inc., Fullerton, CA). Direct LDL-C was also measured by enzymatic procedure if triglycerides were >400 mg/dL. If triglycerides were <400 mg/dL, the Friedewald equation was used to calculate LDL-C. 1 Non–HDL-C was calcuated using the equation TC – HDL-C = non–HDL-C.
STATISTICAL ANALYSIS
A sample size of 40 subjects was calculated to achieve 70% power to detect a mean difference of 10.0 mg/dL in LDL-C, assuming a standard deviation of 25.0 mg/dL for the difference in LDL-C, using a 2-sided paired t-test with a significance level of 0.05. Parametric data were analyzed using the Student's t-test, and nonparametric data were analyzed using the Wilcoxon signed-rank test. Statistical analyses were performed using Sigma Stat 2.0 (SPSS Inc., Chicago, IL) and NCSS 2000 (NCSS Statistical Software, Kaysville, UT).
Results
Between June 2003 and July 2004, 40 subjects were enrolled; baseline characteristics are shown in Table 1. A greater number of men participated in the study, reflecting the predominantly male veteran population.
Patient Demographics
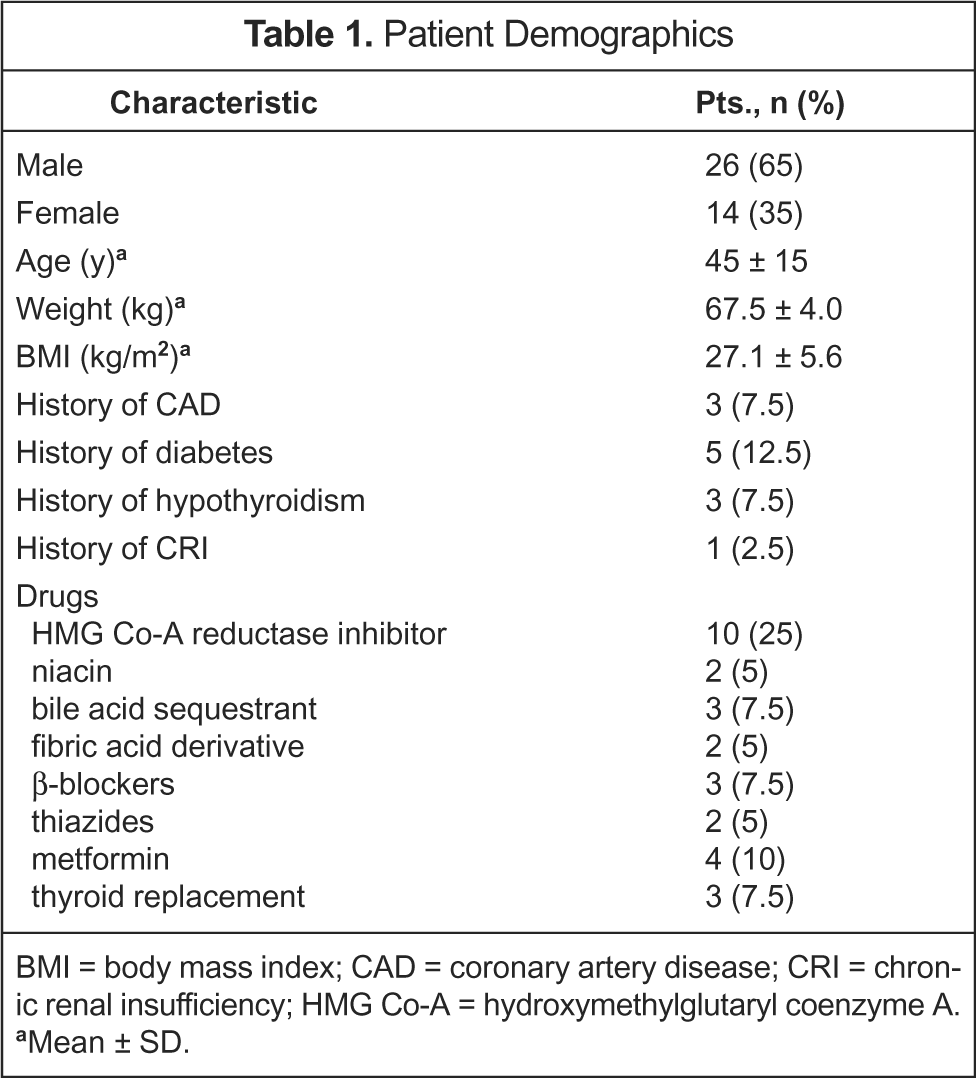
BMI = body mass index; CAD = coronary artery disease; CRI = chronic renal insufficiency; HMG Co-A = hydroxymethylglutaryl coenzyme A.
Mean ± SD.
In the black coffee arm, most lipid indices, with the exception of triglycerides, increased after coffee consumption, as shown in Table 2. The change in the primary endpoint, LDL-C, was not statistically significant, although the increases in TC and HDL-C were significant. The mean TC increased from 188.2 ± 38.1 to 191.3 ± 39.9 mg/dL (p = 0.019), and the mean HDL-C increased from 43.2 ± 12.3 to 44.8 ± 12.9 mg/dL (p < 0.001). The mean elapsed time from the end of coffee consumption to blood drawing was 40.7 ± 14.5 minutes.
Lipid Levels at Baseline and After Black Coffee Consumption
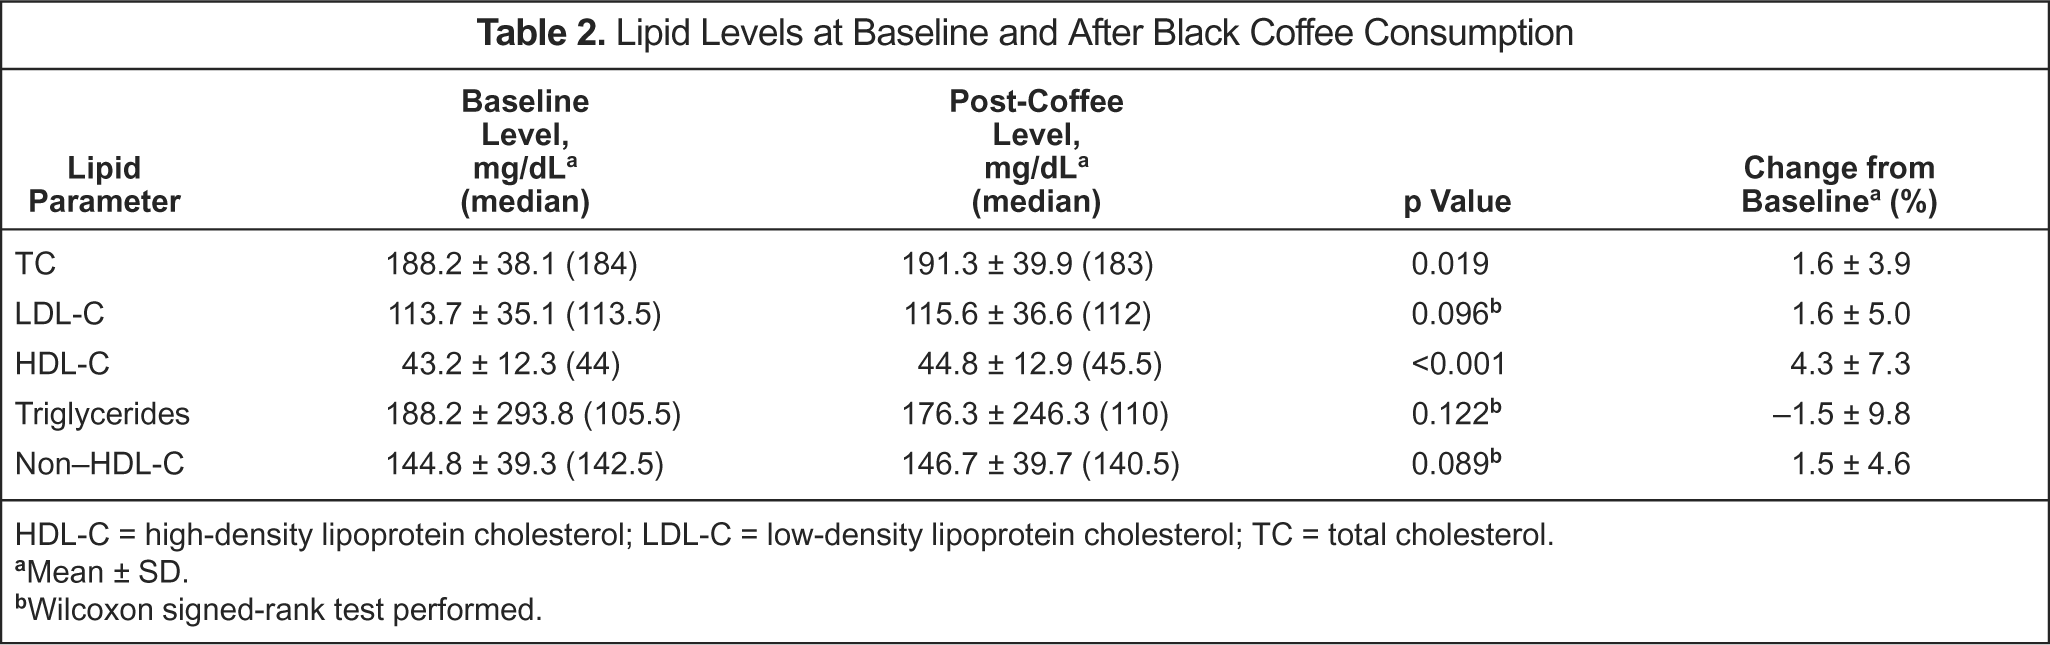
HDL-C = high-density lipoprotein cholesterol; LDL-C = low-density lipoprotein cholesterol; TC = total cholesterol.
Mean ± SD.
Wilcoxon signed-rank test performed.
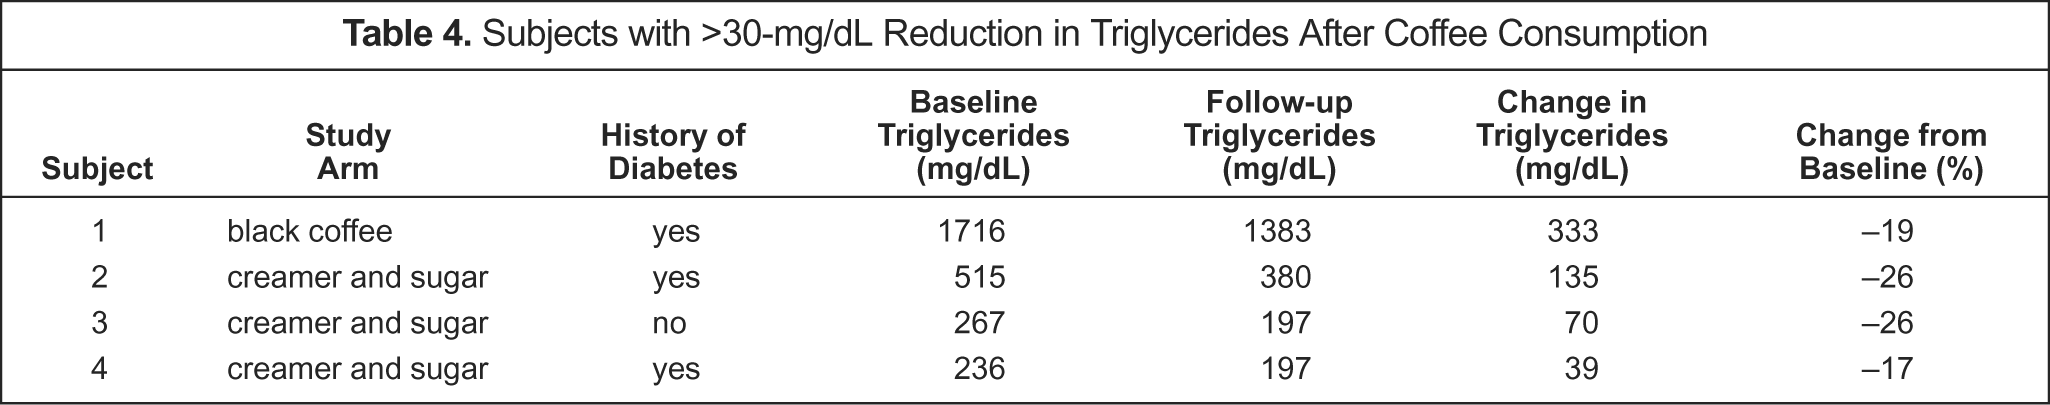
Similar results were obtained from the study arm using coffee with creamer and sugar, as shown in Table 3. Median LDL-C increased from 105.5 to 107 mg/dL after coffee consumption, but the change in this primary endpoint was not statistically significant (p = 0.115). TC and non–HDL-C remained virtually unchanged, while median HDL-C increased by 1.5 mg/dL (p = 0.55). Only the change in median triglycerides, which decreased from 101.5 to 96 mg/dL (p = 0.014), was statistically significant. Table 4 shows the results from 4 subjects with the greatest reduction in triglycerides (>30 mg/dL) after coffee consumption. A mean time of 41 ± 15.3 minutes elapsed from the end of coffee consumption to the time of blood drawing.
Lipid Levels at Baseline and After Consumption of Coffee with Creamer and Sugar
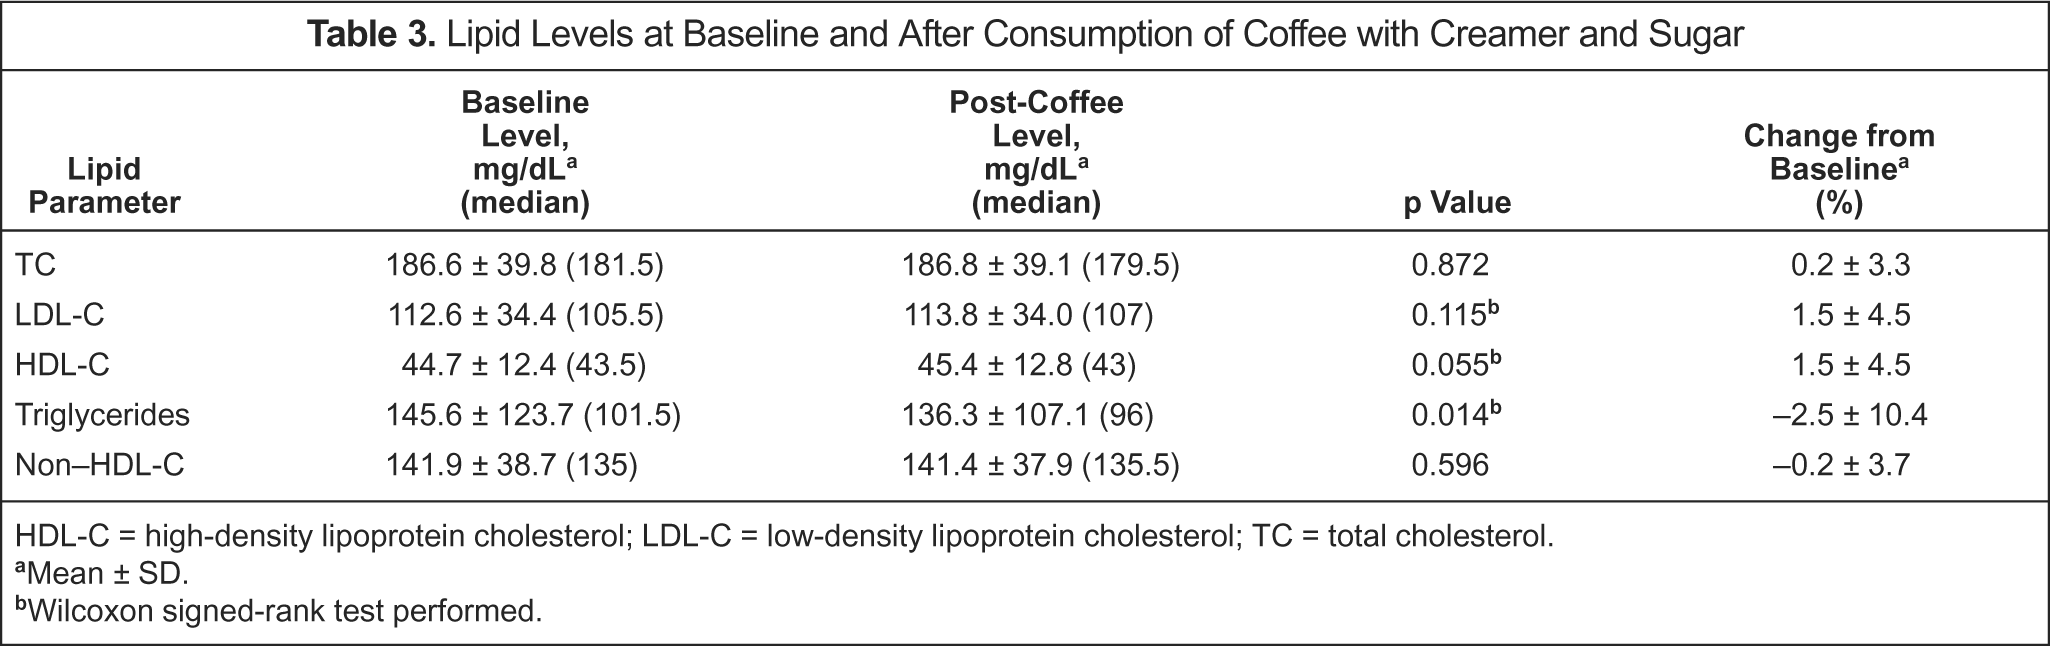
HDL-C = high-density lipoprotein cholesterol; LDL-C = low-density lipoprotein cholesterol; TC = total cholesterol.
Mean ± SD.
Wilcoxon signed-rank test performed.
Subjects with >30-mg/dL Reduction in Triglycerides After Coffee Consumption
Discussion
There were no statistically significant differences in median LDL-C, the primary endpoint, before and after the consumption of coffee with and without nondairy creamer and sugar. LDL-C is the primary therapeutic target, according to the Third Report of the National Cholesterol Education Program Expert Panel on Detection, Evaluation, and Treatment of High Blood Cholesterol in Adults—Adult Treatment Panel III. 15 Clinical decisions to select lipid-lowering medications are dependent on accurate LDL-C results. The mean percent changes in LDL-C from baseline for the black coffee arm and the coffee with creamer and sugar arm were 1.6 ± 5.0% and 1.5 ± 4.5%, respectively, and are unlikely to affect the clinical decisions of primary care providers.
For the secondary endpoints, triglyceride levels decreased after ingestion of coffee in both groups. However, this may not have been caused by coffee consumption, but by other possible causes. The statistical significance achieved in the participants using creamer and sugar may be attributable to 3 subjects with large decreases (>30 mg/dL) in triglyceride levels. When the data were reanalyzed excluding these subjects, the median triglycerides in the creamer and sugar arm decreased, but was no longer statistically significant (data not shown). The 4 subjects shown in Table 4 had elevated baseline triglyceride levels, and 3 had a history of diabetes. Hypertriglyceridemia and postprandial lipemia are known metabolic abnormalities associated with type 2 diabetes mellitus and insulin resistance. 16 Increased hepatic secretion of very-low-density lipoprotein cholesterol (VLDL-C) and impaired hepatic clearance of VLDL and chylomicrons, contribute to hyper-triglyceridemia. 17 Reduced lipoprotein lipase activity also leads to the prolonged retention of triglyceride-rich lipoproteins, such as VLDL-C and chylomicrons in the circulation. 18 In our study, the triglyceride reduction in the subjects mentioned above may be related to their elevated baseline levels and the continued lipoprotein catabolism between the initial and follow-up lipid analyses, even at 12 hours after the last meal. In contrast, subjects with normal lipid metabolism have very low levels of chylomicrons after an overnight fast. 19 In these normolipidemic participants, an additional period of fasting, such as the one in our study between the initial and follow-up blood draws, will not have a large impact on triglyceride levels.
The increase in HDL-C may be related to the concomitant decrease in triglycerides seen in this study. Syvänne et al. 20 showed that diabetic groups had higher postprandial triglyceride levels after a fatty meal and that HDL-C concentration was inversely related to the magnitude of postprandial lipemia. This relationship was slightly stronger with HDL2 compared with total HDL. The authors noted that the triglyceride responses in chylomicron3, VLDL-C1, and VLDL-C2 were responsible for the observed negative relationship. Patsch et al. 21 also demonstrated a strong inverse relationship between the degree of triglyceride increase after a standard-fat meal and the plasma concentration of HDL2 particles in healthy subjects at 2, 4, 6, and 8 hours after ingestion of the meal. These findings help explain why HDL-C levels in our study increased from baseline to post-consumption lipid analysis. It is unlikely that coffee increased HDL-C levels because kahweol and cafestol increase cholesteryl ester transfer protein activity, leading one to expect a decrease in HDL-C. 9 Additionally, many studies,3,4,11,14 including a meta-analysis, demonstrated that drinking multiple cups of coffee daily was not significantly associated with increases in HDL-C levels. 22 Therefore, the finding in our study is more likely related to the catabolism of triglyceride-rich lipoproteins with continued fasting. As triglycerides decreased at the follow-up lipid analysis, HDL-C increased concomitantly in our subject groups.
There were several limitations to this study. The results are applicable to coffee made from commercially prepared grounds brewed in an electric coffeemaker with a paper filter. This method is common in the US, but espresso-based drinks, such as lattes and cappuccinos, are also popular. Espresso machines use high pressure to force very hot water through the coffee beans to extract the flavor and coffee oils. Paper filters, which remove kahweol and cafestol, are not used to make espresso. Additionally, we did not assess the effects of drinking larger quantities of coffee or adding greater amounts of sugar, gourmet flavored syrups, and whole milk. Therefore, the results of the study cannot be extrapolated to people drinking coffee prepared using these methods.
Another limitation to this study was the short time period between coffee consumption and the follow-up lipid analyses. Syvänne et al. 20 demonstrated that postprandial triglyceride and VLDL-C levels peaked 4–6 hours after administration of the high-fat meal. In our study, a mean of 41 minutes elapsed between coffee consumption and blood drawing. This amount of time may have been too short to see the full effects of coffee on triglycerides. It can be conjectured that triglyceride levels could have started to rise after the post-coffee blood samples were taken. Therefore, the study possibly underestimated the degree of postprandial lipemia in these subjects. However, the investigators chose this time frame to measure the follow-up lipid levels for the subjects' convenience and to simulate real-world situations when patients present to the laboratory for early morning fasting blood drawing.
Conclusions
The consumption of coffee with and without nondairy creamer and sugar did not significantly affect LDL-C levels, the primary endpoint. Although TC and HDL-C increased after black coffee consumption and triglycerides decreased after consumption of coffee with creamer and sugar, these changes were statistically significant, but not clinically significant. Although more studies may be needed to measure postprandial lipid levels beyond 60 minutes after coffee consumption, patients may safely drink their habitual morning cup of coffee before having their blood drawn for lipid analysis without significantly affecting the results.