
Abstract
BACKGROUND
Doripenem often is used in the intensive care unit (ICU) to treat serious infections. However, pharmacokinetics in this population often are altered by various physiologic changes. Current pharmacokinetic data in critically ill patients receiving doripenem are limited.
OBJECTIVE
To determine the pharmacokinetics of doripenem in patients treated in the ICU versus outside the ICU.
METHODS
A total of 3–4 serum samples were collected from 25 infected patients receiving doripenem. A 2-compartment model was fit to serum pharmacokinetic data with nonparametric adaptive grid with adaptive γ. In the structural pharmacokinetic model, clearance (Cl) was made proportional to creatinine clearance (CrCl) and an intercept term. Bayesian pharmacokinetic parameters were compared between the 2 populations. A 5000-patient Monte Carlo simulation was performed for various CrCl ranges. The probability of pharmacodynamic target attainment was calculated over a range of minimum inhibitory concentrations (MICs), assuming a target of 35% of the dosing interval that unbound drug concentrations remain above the MIC.
RESULTS
Mean (range) age, body mass index, and CrCl were 61 (31–90) years, 31.2 (15.1–55.5) kg/m2, and 86 (15–221) mL/min, respectively. After the Bayesian step, r2, bias, and precision were 0.97, 0.04, and 1.44 μg/mL, respectively. Mean (SD) parameters for ICU (n = 13) and non-ICU (n = 12) patients were not significantly different (p > 0.05): volume of central compartment (17.3 [11.2] vs 18.5 [11.7] L), Cl (10.1 [10.2] vs 15.5 [16.9] L/h), k12 (4.7 [4.7] vs 4.7 [4.8] h−1), and k21 (7.1 [5.5] vs 5.7 [5.3] h−1), respectively. Optimal target attainments were obtained for patients with normal renal function up to MICs of 2 μg/mL with a dose of 500 mg every 8
CONCLUSIONS
Doripenem pharmacokinetics were similar between ICU and non-ICU patients in this population. Optimal dosing regimens should be selected based on underlying renal function and suspected MIC of the infecting pathogen.
Carbapenems display a broad spectrum of activity and are bactericidal against most gram-negative organisms. 1 Doripenem, the most recently approved carbapenem, has increased in vitro activity against Pseudomonas aeruginosa compared with older carbapenems (imipenem and meropenem). 2 Doripenem is indicated for treatment of complicated intraabdominal and urinary tract infections in the US and is also approved for treatment of nosocomial pneumonia in Europe, Asia-Pacific, and South America. 3 As a result of its broad spectrum of activity, doripenem often is used to treat many infections in the hospital, including severe infections in the intensive care unit (ICU).
Because of the greater severity of illness in ICU patients with infection, it is of utmost importance to prescribe the optimal dosing regimen to maximize outcomes, while minimizing toxicity and selective pressure. The dosing regimens for most approved antibiotics, however, are based on pharmacokinetics in healthy volunteers or non-ICU patients. The current population pharmacokinetic data for doripenem includes studies with healthy volunteers and patients with infection (predominantly complicated urinary tract infections). 4 While a small number of patients with nosocomial pneumonia were included in these studies, it is not known how many were admitted to the ICU. Recently, 2 pharmacokinetic studies in critically ill patients receiving doripenem for the treatment of pneumonia were published. 5,6 Both have provided great insight on the pharmacokinetics of doripenem in this important population; however, direct comparisons between patients treated in the ICU versus outside of the ICU are not available. Critically ill patients may have different and more variable pharmacokinetics compared with healthy volunteers and non-ICU patients. 7–9 Clearance can fluctuate resulting from changes in renal function and hemodynamic instability. Sepsis or the use of vasopressors can alter and sometimes enhance renal blood flow, subsequently affecting clearance. 10 Additionally, alterations in fluid distribution and shifts can affect volume of distribution. In a recent study in patients with ventilator-associated pneumonia, a 7-day course of doripenem was found to have higher clinical failure rates and mortality compared with a 10-day course of imipenem-cilastatin. 11 Therefore, pharmacokinetic data in this population are especially valuable to ensure sufficient drug exposures. For β-lactam antibiotics, including doripenem, the exposure of interest is the percentage of the dosing interval that unbound drug concentrations remain above the minimum inhibitory concentration (f T > MIC). 7
We sought to determine and compare the population pharmacokinetics of patients receiving doripenem while treated within versus outside the ICU at our institution. Additionally, we performed a Monte Carlo simulation to predict the probability of attaining target drug exposures at clinically relevant creatinine clearance (CrCl) thresholds.
Methods
PATIENTS AND SETTING
Adults (aged ≥18 years) admitted to Hartford Hospital, an 867-bed tertiary care hospital in Hartford, CT, were eligible for participation if they had received at least 3 doses of doripenem for any infection between February 2010 and March 2012. Efforts to enroll a similar number of patients from an ICU versus a non-ICU floor were made. The ICUs at our institution include 2 medical ICUs, a neurotrauma ICU, a cardiothoracic ICU, and a surgical ICU. Doripenem is restricted to prescribing by the Infectious Diseases service at our institution, with the exception of protocol use for ventilator-associated pneumonia, and is typically administered as a 4-hour infusion. Patients were excluded if they were deemed poor candidates for blood collection, required hemodialysis or a continuous renal replacement therapy, or were diagnosed with cystic fibrosis. The protocol was reviewed and approved by Hartford Hospital's Institutional Review Board and informed consent was obtained from each patient, the patient's legally authorized representative, or the patient's next of kin.
PHARMACOKINETIC SAMPLING
A sparse blood sampling strategy was used, with 3–4 blood samples collected over the dosing interval from each patient after at least 3 consecutive doses of doripenem (ie, steady-state) were administered. For patients receiving doripenem as a 4-hour infusion, a single sample was collected during the following postdose intervals: 4–5, 5–6, 6–7, and 7–8 hours (for every-8-hour regimens) or 7–12 hours (for every-12-hour regimens). For patients receiving doripenem as a 1-hour infusion, samples were collected at the following intervals: 1–2, 2–4, 4–6, and 6–8 hours (for every-8-hour regimens) or 6–12 hours (for every-12-hour regimens). After collection, blood samples were immediately centrifuged to separate the serum and stored at −80 °C until drug analysis.
CONCENTRATION DETERMINATION
Doripenem concentrations were determined using a validated high-performance liquid chromatography assay. 12 The interday coefficient of variation for high (30 μg/mL) and low (1 μg/mL) check samples were 5.8% and 6.4%, respectively, and intraday coefficients of variation were 3.3% and 4.5%, respectively.
POPULATION PHARMACOKINETIC MODEL
Concentration data were modeled by nonparametric adaptive grid with adaptive γ (BigNPAG). 13 Compartmental models were differentiated by comparing the log likelihood and Akaike information criterion. A 2-compartment model with zero-order input and first-order elimination resulted in the best fit. To assess the effect of kidney function on doripenem clearance, CrCl was incorporated as a covariate into the model with a linear relationship. Total body clearance was defined by the following: Cl = Cli + Cls × CrCl, where Cli is the intercept and Cls is the slope parameter. CrCl was calculated using the Cockcroft-Gault equation: CrCl = (140 − age) × IBW / (serum creatinine × 72) [× 0.85 for females], where ideal body weight (IBW) = 50 kg + 2.3 kg for each centimeter over 152 cm for males and 45.5 kg + 2.3 kg for each centimeter over 152 centimeters for females. If the serum creatinine was less than 0.8 mg/dL it was adjusted to 0.8 mg/dL for calculation of CrCl for incorporation into the model, as that was the methodology used for dosage selection at our hospital. Adjusted BW, used in the calculation of CrCl only for patients weighing 20% or more of their IBW, was calculated by the equation: AdjBW = IBW + 0.4 (actual weight – IBW). 14
Weighting based on interday assay variance was conducted using a plot of the assay standard deviation (SD) versus measured doripenem concentrations, which was best described by the equation SD = γ(0.0184 + 0.0674 × C), where C is the doripenem concentration and γ was identified as 1.97. Mean values were used as the measure of central tendency for population parameter estimates. Bayesian estimates were obtained for each patient using the population-of-1 utility within BigNPAG. The mean weighted error was the estimate of bias. The bias-adjusted mean weighted squared error was used as an estimate of precision.
STATISTICS
The pharmacokinetic parameter estimates from the population pharmacokinetic analysis were compared between ICU patients and non-ICU patients using a t-test (Sigma Stat, SPSS) if data passed tests for equal variance and normality. Statistical significance was determined as p = 0.05.
MONTE CARLO SIMULATION
A 5000-patient Monte Carlo (Crystal Ball, Decisioneering Inc.) simulation was performed as previously described. 15 Briefly, doripenem steady-state concentration-time profiles for potential dosing regimens were simulated using the mean pharmacokinetic parameter estimates derived from the 2-compartment population pharmacokinetic model described above. Simulations were run over 3 CrCl ranges: 51–144, 30–50, and 11–29 mL/min, coinciding with the package insert–recommended dose modification thresholds. All input variables were assumed to follow log-normal distributions except for a fixed fraction unbound (assumed to be 91.9%) and CrCl ranges from 30 to 50 mL/min and from 11 to 29 mL/min. A uniform distribution was used for these CrCl ranges so that the probability of a specific CrCl value during simulation was equal throughout the range.
Using the simulated concentration-time profiles, the probability of pharmacodynamic target attainment (PTA) was calculated over a range of doubling MICs from 0.008 to 64 μg/mL, assuming a pharmacodynamic target of 35% f T > MIC. 16,17 Regimens with PTAs of 90% or more were considered optimal. The median (IQR 25%, 75%) area under the concentration-time curve profile (AUC24) over 24 hours at steady-state was calculated for different doses for each of the renal function ranges to ensure that there was no significant accumulation for simulated patients with renal dysfunction.
Lastly, we simulated and compared the median time (in minutes) it takes for the initial doripenem 1000-mg dose to achieve concentrations above 2 μg/mL and 4 μg/mL using a standard 1-hour infusion versus the prolonged 4-hour infusion.
Results
PATIENT POPULATION
Ninety-eight samples were collected from 25 patients (Table 1). Of these, 13 patients were treated in an ICU and 12 were from non-ICU medicine or oncology wards. Of the 13 patients located in the ICU, 3 were receiving vasopressors and 7 were mechanically ventilated on the day of doripenem sampling. Most patients received 1000 mg every 8 hours as a 4-hour infusion for the treatment of nosocomial pneumonia, contributed largely by the ICU population. However, several other infections also were treated including neutropenic fever, cellulitis, bacteremia, necrotizing pancreatitis, urinary tract infections, and a ventriculoperitoneal shunt infection.
Characteristics of Patients Receiving Doripenem
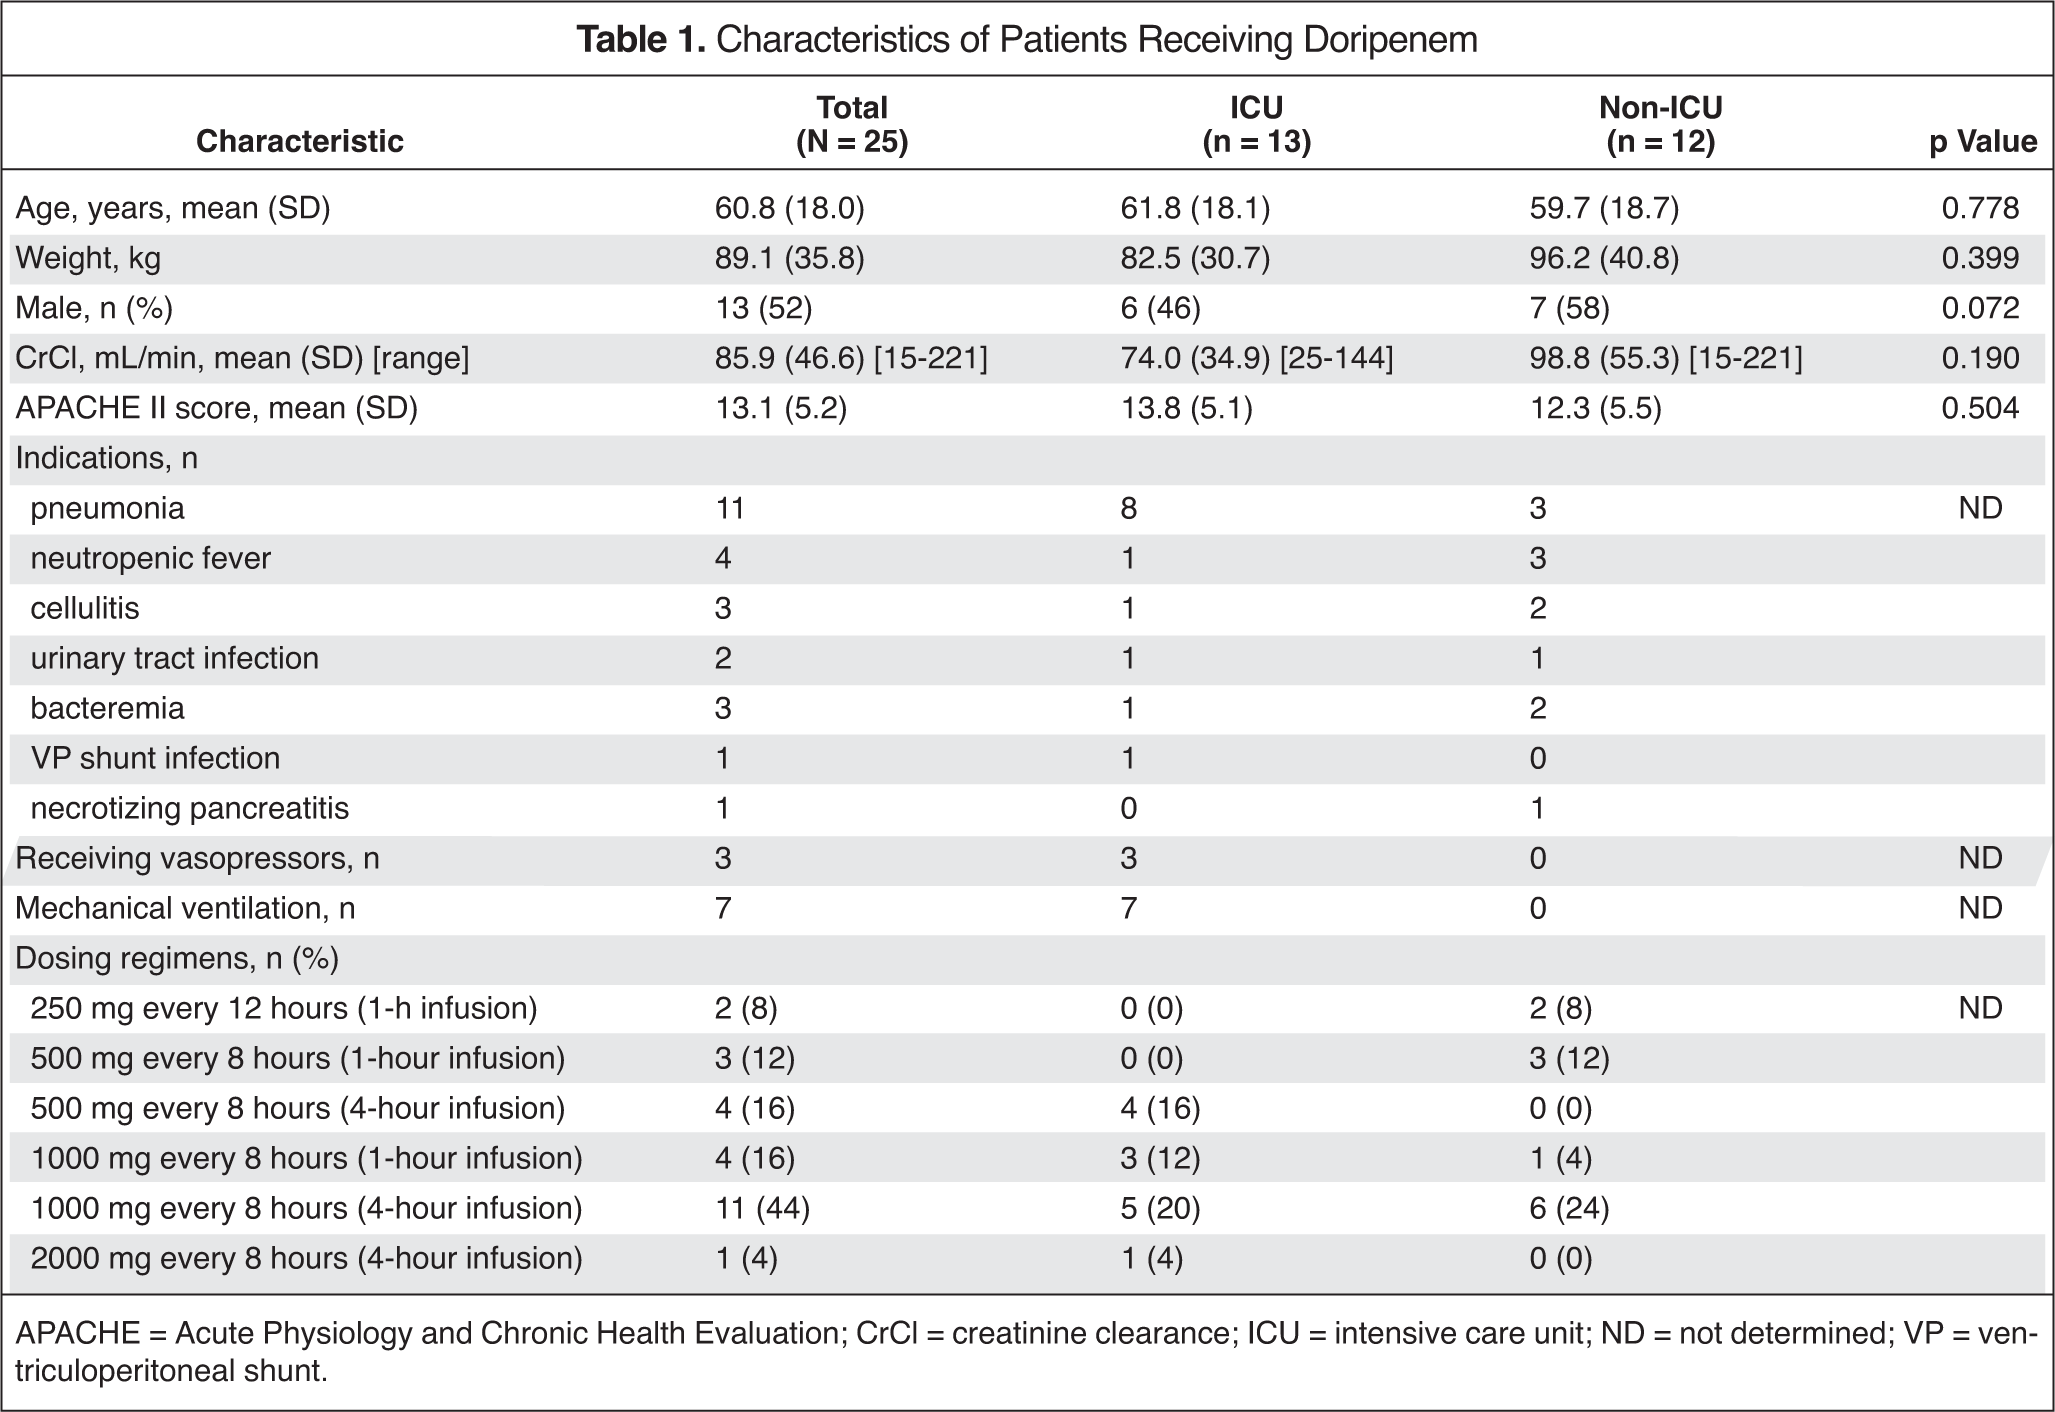
APACHE = Acute Physiology and Chronic Health Evaluation; CrCl = creatinine clearance; ICU = intensive care unit; ND = not determined; VP = ventriculoperitoneal shunt.
POPULATION PHARMACOKINETIC MODELING
The pharmacokinetic parameters for the ICU and non-ICU populations were similar when modeled separately (Table 2). Therefore, we combined the 2 populations and the final population pharmacokinetic parameters derived for the total population are listed in Table 3. The observed versus population predicted (pre-Bayesian) plot for the model was reasonable for a patient population with variable pharmacokinetics (Figure 1); r2, bias and precision values of 0.21, 2.01, and 120.2 μg/mL, respectively. The observed versus individual predicted maximum a posteriori (MAP) Bayesian concentration plot (Figure 2) was excellent with r2, bias, and precision values of 0.97, 0.04, and 1.44 μg/mL, respectively.
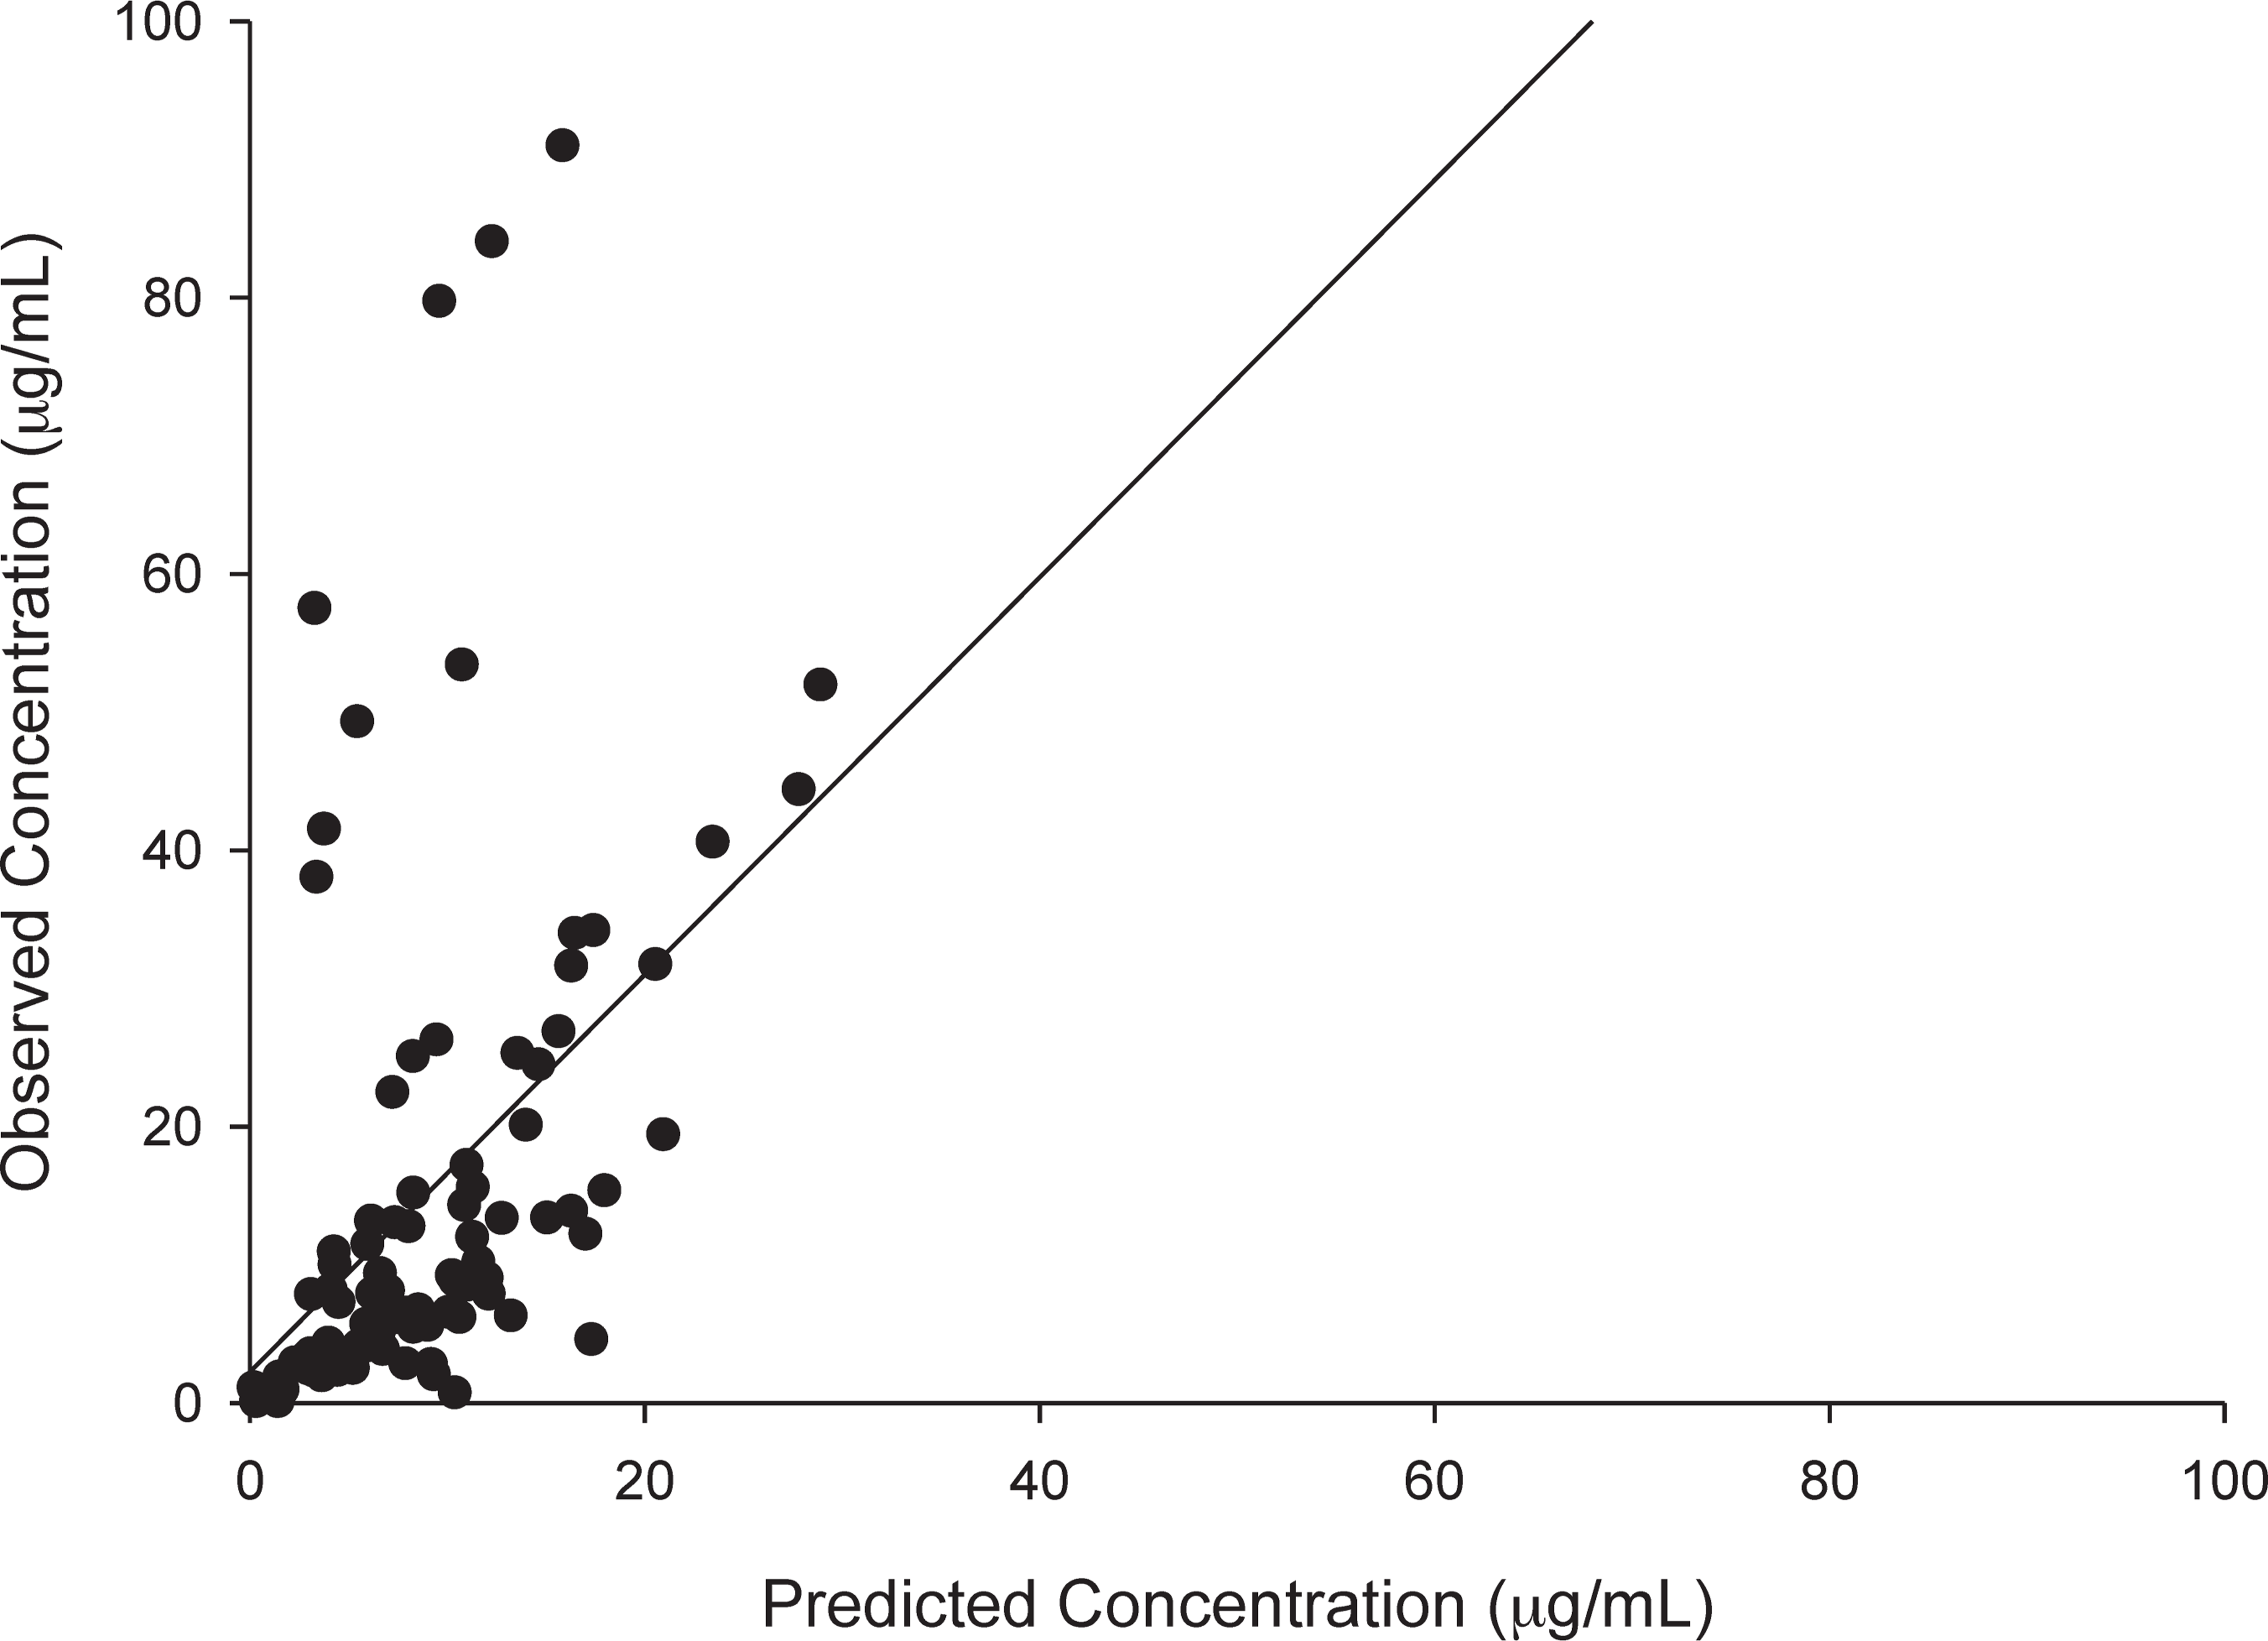
Observed concentrations versus population predicted concentrations using the mean parameter estimates from the population pharmacokinetic model. The r2, bias, and precision were 0.21, 2.01, and 120.2 μg/mL, respectively.
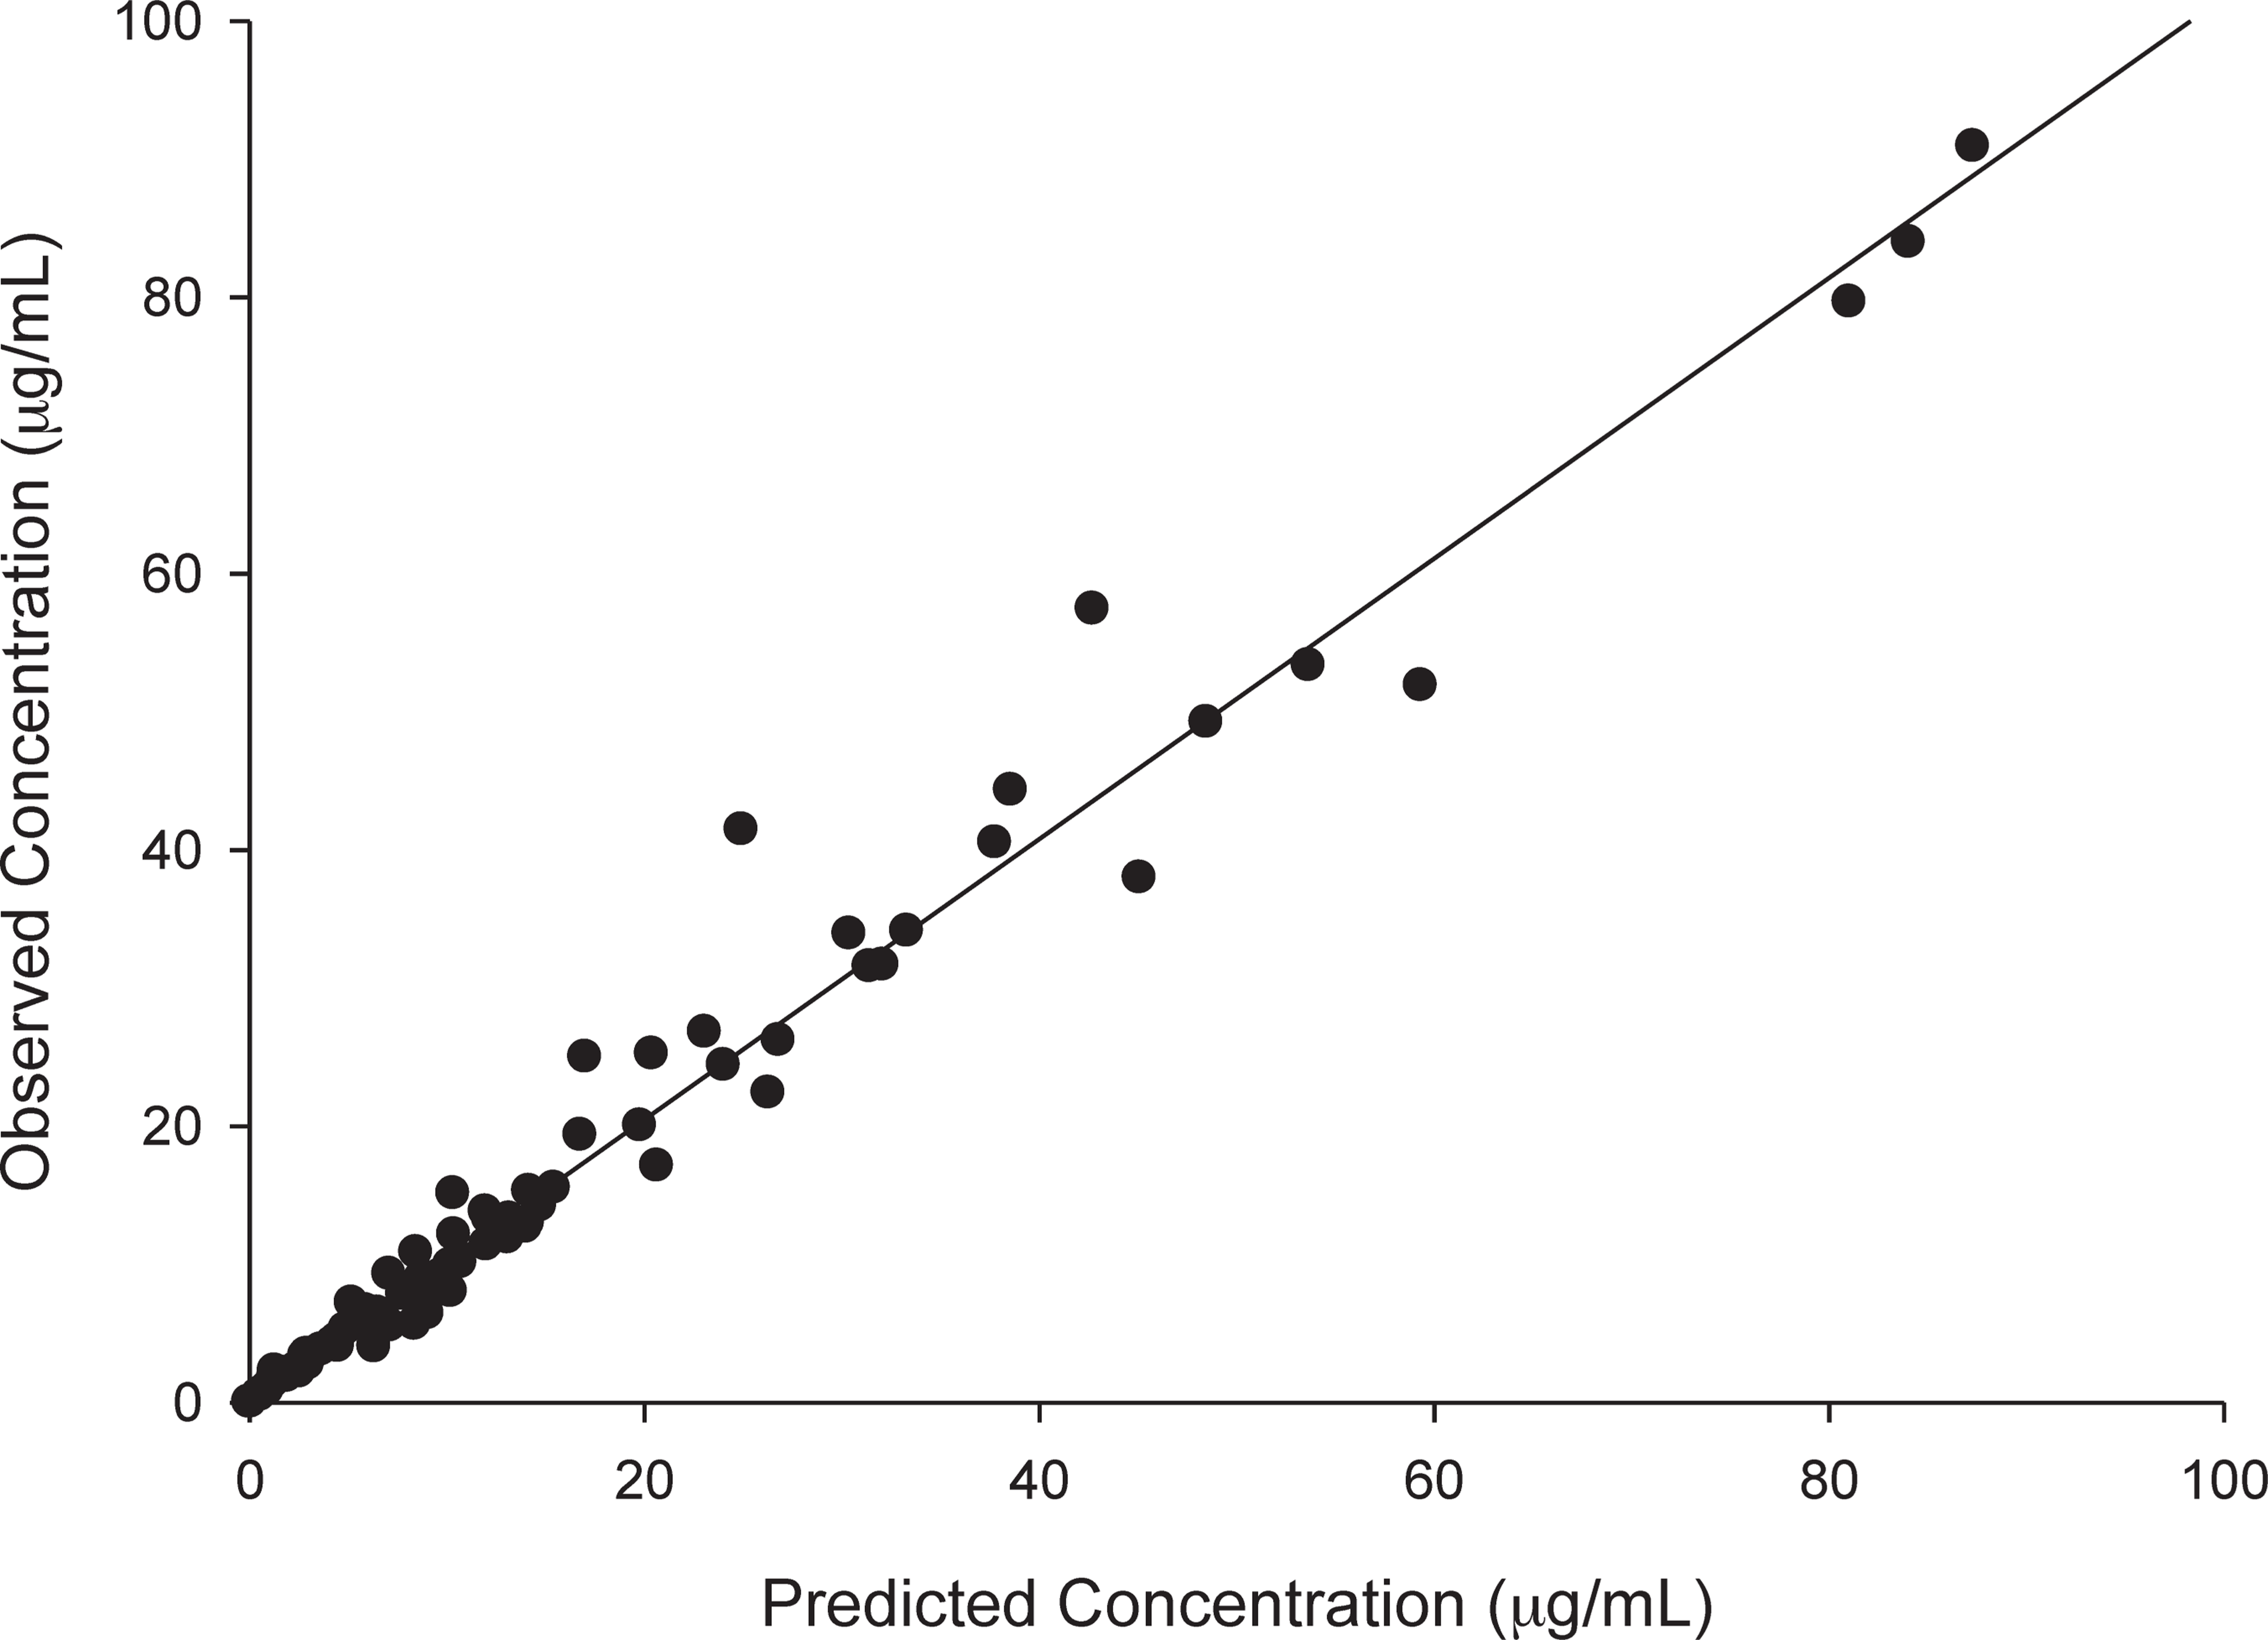
Observed concentrations versus individual predicted concentrations with mean population parameters as the maximum a posteriori Bayesian estimates. The r2, bias, and precision were 0.97, 0.04, and 1.44 μg/mL, respectively.
Population Pharmacokinetic Parameter Estimates and Statistical Results from ICU and Non-ICU Populations a
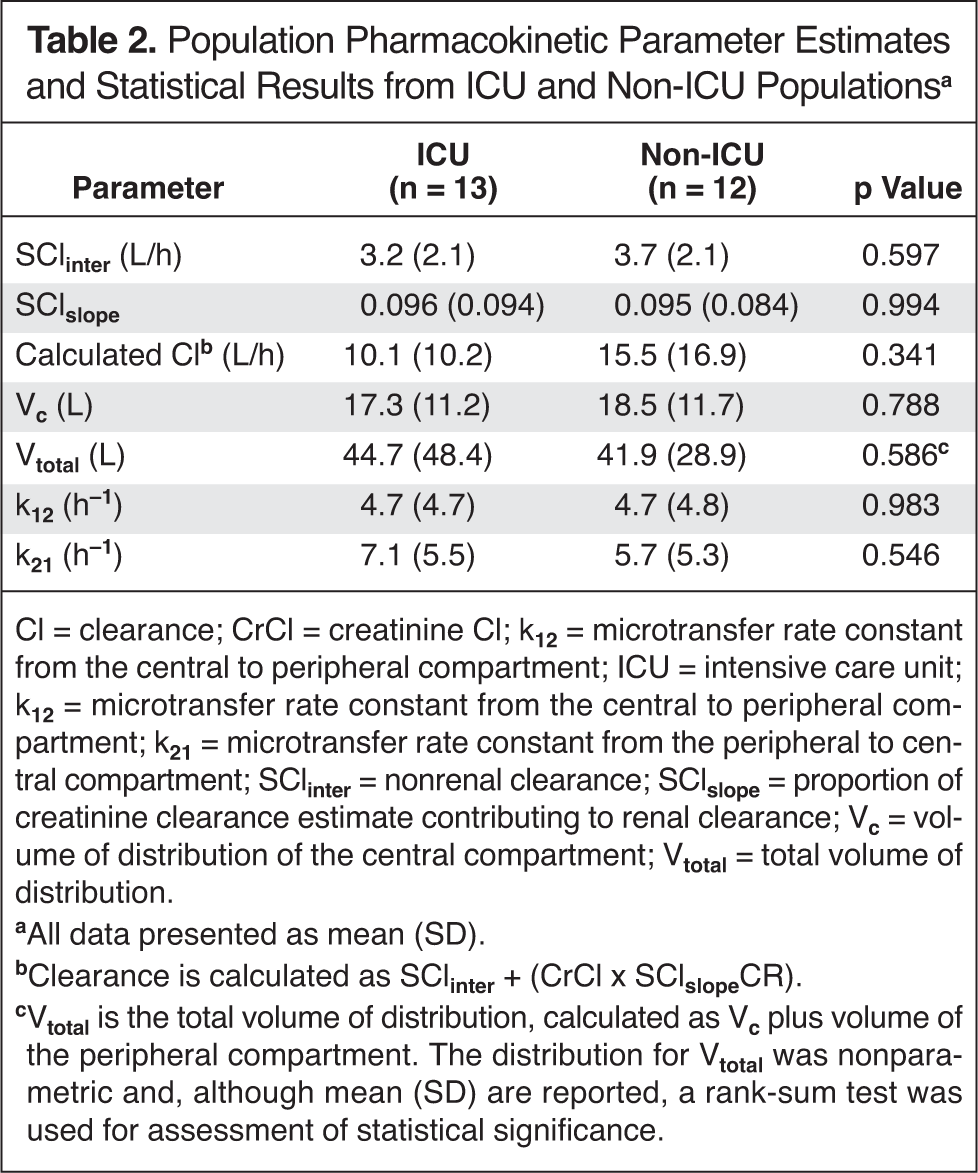
Cl = clearance; CrCl = creatinine Cl; k12 = microtransfer rate constant from the central to peripheral compartment; ICU = intensive care unit; k12 = microtransfer rate constant from the central to peripheral compartment; k21 = microtransfer rate constant from the peripheral to central compartment; SClinter = nonrenal clearance; SClslope = proportion of creatinine clearance estimate contributing to renal clearance; Vc = volume of distribution of the central compartment; Vtotal = total volume of distribution.
All data presented as mean (SD).
Clearance is calculated as SClinter + (CrCl × SClslopeCR).
Vtotal is the total volume of distribution, calculated as Vc plus volume of the peripheral compartment. The distribution for Vtotal was nonparametric and, although mean (SD) are reported, a rank-sum test was used for assessment of statistical significance.
Population Pharmacokinetic Parameter Estimates and Covariance for the Final Model Describing Doripenem Serum Concentrations Derived Using BigNPAG
BigNPAG = nonparametric adaptive grid; k12 = microtransfer rate constant from the central to peripheral compartment; k21 = microtransfer rate constant from the peripheral to central compartment; SClinter = nonrenal clearance; SClslope = proportion of creatinine clearance estimate contributing to renal clearance; Vc = volume of distribution of the central compartment.
MONTE CARLO SIMULATION
Because pharmacokinetics were not significantly different between the 2 populations, the total population estimates (Table 3) were used for all Monte Carlo simulations. The PTA results for each CrCl group across the range of MICs are provided in Figure 3A–C. For patients with normal renal function, optimal PTAs were obtained at MICs of 2 μg/mL, the doripenem susceptibility breakpoint for P. aeruginosa, with a dose of 500 mg every 8 hours as standard 1-hour and prolonged 4-hour infusion. The observed PTAs for this dose as a standard infusion were 90.4%, 71.0%, and 29.5% at MICs of 2, 4, and 8 μg/mL, respectively. For comparison, the prolonged infusion for this dose provided PTAs of 97.6%, 84.4%, and 40.6% at the same MICs. A higher dosage of 1000 mg every 8 hours (as 1- or 4-hour infusions) was required to achieve optimal exposure at MICs of 4 μg/mL (Figure 3A). For patients with CrCl between 30 and 50 mL/min, the PTAs for a dose of 250 mg every 8 hours as a standard 1-hour infusion were 93.3%, 65.5%, and 12.8% at MICs of 2, 4, and 8 μg/mL, respectively. With a prolonged infusion, PTAs improved to 97.5%, 73.0%, and 14.3% at the same MICs. Lastly, patients with CrCl between 11 and 29 mL/min, a dose of 250 mg every 12 hours as a standard infusion provided PTAs of 89.8%, 57.6%, and 9.1% for these MICs with improved PTAs of 97.1%, 65.4%, and 9.6% obtained by the prolonged infusion.
Probability of doripenem regimens achieving 35% of the dosing interval that unbound drug concentrations remain above the minimum inhibitory concentration at creatinine clearance ranges of (A) 51–144 mL/min and (B) 30–50 mL/min, respectively. Probability of doripenem regimens achieving 35% of the dosing interval that unbound drug concentrations remain above the minimum inhibitory concentration at creatinine clearance range of (C) 11–29 mL/min.
Table 4 provides the median (IQR 25%, 75%) steady-state area under the concentration-time curve profile in a 24-hour period (AUC24) attained by each of the doses from the Monte Carlo simulations. Appropriate dose reductions for decreases in renal function allowed for similar PTAs at an MIC of 2 μg/mL while maintaining a decline in AUC24 exposures.
Comparative AUC24 Over 24 Hours for Simulated Doses and Renal Function Ranges
AUC24 = steady-state area under the curve; CrCl = creatinine clearance.
Reported as median (25%, 75% quartile).
Figure 4 shows the concentration-time profile after the first dose of doripenem 1000 mg every 8 hours, the most frequent dose used in our population, as a 1-hour and 4-hour infusion. The median times for concentrations to reach 2 μg/mL were approximately 2 minutes and 8 minutes for 1-hour and 4-hour infusions, respectively. For concentrations to reach 4 μg/mL, it was approximately 4 minutes and 20 minutes for 1-hour and 4-hour infusions, respectively. When re-simulated for a population with a CrCl of 144 mL/min, the median times were unchanged at each MIC.

Mean simulated concentrations in patients with normal renal function after the first dose of doripenem 1000 mg every 8 hours administered as a 1-hour infusion (solid line) and 4-hour infusion (dashed line).
Discussion
The pharmacokinetics of critically ill patients often are very different from those of healthy volunteers. 18 The volume of distribution in critically ill patients can be increased as a result of physiologic changes such as fluid shifts. Cl also can be increased, reducing the amount of time that concentrations of the antibiotic remain above the MIC of the pathogen. These physiologic changes between healthy volunteers and critically ill patients make it important to determine the pharmacokinetics in the population of interest and select an optimal dose. Additionally, bacteria often have higher antibiotic MICs in the ICU because of increased resistance, thus making selection of an optimal dose more important. By better understanding the pharmacokinetics in these populations, the pharmacodynamics of the regimen can be optimized to improve clinical outcomes. In this study, we determined the pharmacokinetics of patients with infection receiving doripenem within and outside the ICU. Our data demonstrated no significant differences in the pharmacokinetic parameters between the 2 populations; however, changes in renal function would substantially affect the exposures needed to provide adequate time above the MIC.
While doripenem population pharmacokinetics in patients have been reported, direct comparisons between ICU and non-ICU patients have not been made. 4–6 Compared with these previous studies, the mean volume of the central compartment in our population (17.87 L) was greater than that in the population of predominantly urinary tract infection patients studied by Nandy and colleagues (11.6 L), and the calculated total body Cl was slightly lower at 12.7 L/h compared with 13.6 L/h. 4 We attribute the slightly lower Cl in our population to the underlying renal function of the populations; the median (range) CrCl of patients included in our study was lower (76 [15–221] mL/min vs 97.6 [15.6–215.6] mL/min) than that of the population of Nandy and colleagues. A separate population pharmacokinetic study of doripenem in patients with infection was conducted by Ikawa and colleagues. 19 That study included 18 infected individuals; all were Japanese patients with urinary tract infections or prostatitis, and none was admitted to the ICU. Both the reported mean volume of the central compartment (8.29 L) and total body Cl (8.99 L/h) were lower than observed in our patient population. The mean CrCl of their population was 48.9 ± 19.4 mL/min, which is lower than that of the population in our study. Ikawa and colleagues also studied doripenem population pharmacokinetics in 11 patients with no infection undergoing an intraabdominal laparotomy; they observed a mean volume of the central compartment of 3.65 L, a mean total body Cl of 9.84 L, and the population had a mean CrCl of 95.1 ± 22 mL/min. 20 The substantial differences between populations for these latter studies make comparison with our population data difficult.
More recent pharmacokinetic data in 31 critically ill patients receiving doripenem demonstrated a higher volume of the central compartment (24.4 L) and a faster total body clearance (20.4 L/h) compared with our data. 5 This again can be largely explained by the range of renal function in the populations. The average CrCl in the Roberts and Lipman study was 137 mL/min and 17 of the 31 patients had augmented renal function (ie, CrCl >130 mL/min). Notably, our total volume of distribution in our ICU population (44.7 [48.4] L) was similar to that reported by Roberts and Lipman (45.9 ± 36.3 L). Another study in 11 critically ill patients with ventilator-associated pneumonia reported a total body Cl of 24.9 L/h, and the mean CrCl of these patients was 120 mL/min, with 5 patients having CrCl in the range defined by augmented renal function. 6 In general, a greater volume of distribution and total body Cl could contribute toward lower serum concentrations. A previous study analyzing trough concentrations of β-lactams demonstrated that an augmented CrCl leading to increased total body clearance was predictive of low trough concentrations, specifically in patients in the ICU. 21 Since doripenem is primarily eliminated via glomerular filtration, we included CrCl as a covariate in our model building process, whereby increases in CrCl resulted in linear increases in total body clearance. This strategy improved the model substantially (data not shown); moreover, previous population pharmacokinetic studies have also included CrCl as a covariate to renal clearance in the final models. 4,5,19 Unfortunately, only 2 ICU patients among our cohort had estimated CrCl values in the range suggestive of augmented renal clearance (ie, >130–140 mL/min); furthermore, the CrCl and calculated total body Cl for these patients were 133 mL/min and 42 L/h, and 144 mL/min and 2.7 L/h, respectively. 10,21 Therefore, it is possible that if more patients with augmented renal function had been included in our ICU population, observed mean population estimates for Cl could be higher, but this might also hold true for the non-ICU population.
When we compared the data between ICU and non-ICU patients, the pharmacokinetics of the 2 populations in our study were similar (Table 2). Notably, mean volume of distribution (18.5 L) and Cl (15.5 L/h) in our non-ICU population was also greater than that observed in other studies of non-ICU patients, which may have affected our ability to discern differences between our ICU and non-ICU groups. 4,19,20 The slope and intercept of Cl were the same for both the ICU and non-ICU population in our study. The higher mean total body Cl in our non-ICU population was largely the result of inclusion of a single obese (207 kg) male whose estimated CrCl was 221 mL/min and total body Cl was 65 L/h. Exclusion of this single patient from the non-ICU group resulted in a mean clearance of 10.9 L/h for the population, which is numerically in line with our mean value for the ICU population. Although the total population studied here was significantly ill, with an average APACHE (Acute Physiology and Chronic Health Evaluation) II score of 13.1, which equates to a mortality rate of approximately 15%, the severity of illness for our non-ICU population was very similar to that of our ICU population. 22 While a higher APACHE II score might be expected among ICU patients, we calculated this severity of illness on the day of doripenem blood sampling, so patients may have been clinically stabilized compared with the day of admission to the ICU. Likewise, the chronic illness point contribution from a few cases of neutropenic fever in the non-ICU population increased the mean APACHE II score for this group. Therefore, it is possible that the similarities in the pharmacokinetics between both groups could be explained by these factors. Considering the observed variability in our population of patients, a larger sample might be required to detect true differences between ICU and non-ICU patients while controlling for underlying renal function.
Because no significant differences in pharmacokinetics were observed between ICU and non-ICU patients, we used the total population estimates (Table 2) to analyze dosing regimens in the Monte Carlo simulation. Figure 3 demonstrates that in patients with normal renal function (CrCl >50 mL/min), a dosage of 500 mg every 8 hours as a 1-hour infusion, which is the approved dosing regimen in the US, provides a 90.4% probability of achieving optimal pharmacodynamic exposure at the susceptibility breakpoint for P. aeruginosa (2 μg/mL). Administering the same dose as a 4-hour infusion increases the PTA to 97.6%. Furthermore, doubling the dose to 1000 mg every 8 hours as a 4-hour infusion provided a PTA of 99.8% at the susceptibility breakpoint, 97.6% at a doripenem MIC of 4 μg/mL (ie, intermediate resistant), and 84.4% at a doripenem MIC of 8 μg/mL (ie, resistant). Given that recent surveillance data found the doripenem MIC90 for P. aeruginosa in the ICU was 8 μg/mL, consideration of aggressive doripenem dosing regimens such as 1000 mg every 8 hours as a 4-hour infusion should be considered. 23,24
We also simulated dosing regimens for populations of patients with reduced renal function using the package insert–defined CrCl ranges for doripenem. 3 Based on Figure 3B and C and Table 4, cutting the normal renal function dose in half while maintaining the same dosing interval for CrCl rates of 30–50 mL/min results in similar PTA and 24-hour AUC. For patients with a CrCl of 11–29 mL/min, cutting the normal renal function dose in half and administering it every 12 hours instead of every 8 hours resulted in similar PTA and 24-hour AUC. While it is possible to obtain high PTA results simply by combining large doses with reduced renal function, the increased risk for accumulation and toxicity should be considered. The AUC analysis provided in Table 4 demonstrates that optimal PTAs can be achieved by the above-mentioned dose reductions without 24-hour AUC exposures above that of patients with normal renal function receiving a standard dose.
Finally, to address concerns that prolonged infusion of the first dose results in a substantially longer time to reach concentrations above the MIC (and thus would lead to poorer outcomes), we calculated the median time for a single 1000-mg dose to reach 2 and 4 μg/mL when administered as the standard 1-hour versus 4-hour infusion. As depicted in Figure 4, the times to reach a concentration above 2 μg/mL were approximately 2 minutes and 8 minutes for a 1-hour and 4-hour infusion, respectively. The times were approximately 4 minutes and 20 minutes to obtain a concentration above 4 μg/mL, respectively. Although these times are longer with the prolonged infusion, we speculate that the differences are minimal and not expected to affect clinical outcomes. We are not aware of any pharmacodynamic studies that compared differences in inoculum reduction after a course of antibiotics when the first dose is administered as a short versus prolonged infusion. Our conclusion is further supported by clinical trial data in patients with ventilator-associated pneumonia demonstrating noninferiority of prolonged infusion doripenem compared with standard-infusion imipenem-cilastatin. 25 As a result, if prolonged infusion doripenem is required based on renal function and MIC, using this dosing strategy from the very first dose is unlikely to contribute negatively to overall f T > MIC exposure.
Doripenem pharmacokinetics in patients treated within versus outside the ICU did not differ significantly in our population; underlying renal function will be the most important predictor of doripenem exposure in ICU as well as non-ICU patients. The population pharmacokinetic model presented here accurately predicted doripenem concentrations and provides dosing regimen recommendations based on underlying renal function and the suspected MIC of the infecting pathogen.
Footnotes
Acknowledgments
We thank Christina Sutherland BS for her assistance with the analytical determination of doripenem and Dora Wiskirchen PharmD for her assistance with collection of pharmacokinetic samples.