






Abstract
This study was designed to assess the potential of transferring a calibration model from pharmaceutical powder mixtures to compacts of identical compositions using prediction augmented classical least squares (PACLS). A 2-factor, 5-level, full-factorial design was used to generate powder mixtures and compacts with a variety of formulation compositions. Spectra representative of powder mixtures were used for calibration, while spectra collected on both unrelaxed and relaxed compacts were used as the prediction dataset. The CLS augmentation strategy was to add empirically determined spectral shapes representative of the density differences between powder mixtures and compacts to the original K matrix. The performance of PACLS was compared to other commonly used modeling techniques, including classical least squares (CLS) and partial least squares (PLS) with and without spectral pretreatments and standardization. Significantly improved prediction performance (p < 0.05) was demonstrated by PACLS approaches compared to other techniques. This work demonstrated a technique to orthogonalize the spectral differences between powder and compact samples, allowing the prediction of chemical properties in compacts. Specific precautions for applying PACLS in a calibration transfer from powder mixtures to compacts are also discussed.
Keywords
INTRODUCTION
The number of near-infrared spectroscopy (NIRS) applications in pharmaceutical analysis has increased significantly over the last decade. It has permeated multiple research and development activities in the pharmaceutical industry, including raw material characterization, powder blend monitoring, granulation process control, tablet manufacture, and finished product characterization.1,2 The majority of applications typically utilize separate calibration samples/models for in-process materials and end-products (e.g., powder mixtures and compacts), which can consume extensive resources and time. In an effort to increase calibration efficiency, robust model development and maintenance, this study was designed to assess the potential to transfer an NIR calibration model from pharmaceutical powder mixtures to its corresponding (compositionally identical) compacts.
Pharmaceutical compacts constitute the most popular dosage form and account for almost 50% of all solid dosage forms currently available on the market. 3 Compacts are often made from powder mixtures after undergoing one or more unit operations, such as blending, granulation, milling, compression, etc. The number and the complexity of each unit operation depend on the intrinsic properties of the formulation components and the intended purpose of the dosage form. The main difference between a powder mixture and a compact of the same composition is in the physical properties of the compact (e.g., density). This difference is a result of the compaction process involved with particle rearrangement, fragmentation, plastic, and elastic deformations. 4 Because of that, it leads to significant changes in the optical properties of compacts compared to powder samples.
Density is a superficial representation of the differences between powder and compact samples from a spectroscopic perspective. Considering compacts alone, it is reported that spectroscopic observations of samples of increasing density demonstrate increased effective photon path length and scattering when impinged upon by NIR light. 5 Thus, density interferences in compacts tend to exert a more dramatic effect on NIR spectra than those in powder mixtures. This increases the complexity of creating and maintaining calibration models for compacts.
The present work seeks to investigate methods to transfer spectral information from powdered samples to compacts in an attempt to simplify traditional calibration model development on intermediate and finished products. This approach presents the hypothesis that a calibration developed on powdered samples can be transferred to compacts by employing the spectral differences between them. Adequate representation of the spectral differences can be achieved using a substantially reduced number of samples when compared to developing a calibration based only on compacts. Specifically, this approach takes advantage of the NIR spectral representation of the density differences between these two sample forms (powder mixtures versus compacts) and reduces the typical effort necessary in calibration development for compacts. To the best of the authors' knowledge, this is the first study to investigate the feasibility of transferring a calibration model from powder mixtures to pharmaceutical compacts.
This study provides the groundwork to ultimately streamline the development of calibration models across different sample forms. This approach is an effort to find synergy in the number of different analytical development efforts for different sample forms as process analytical technology (PAT) is deployed through a manufacturing process. It is common that a pharmaceutical manufacturing process will typically develop NIR-based monitoring methods for both blending and compaction. Thus, utilization of data collected during blending development can be applied to subsequent unit operations (e.g., compaction) and thereby facilitate the PAT implementation in the pharmaceutical industry.
Traditionally, a calibration transfer method is used to standardize a calibration model across multiple NIRS instruments, where a model is developed on a primary instrument and transferred to secondary units.6,–10 In this case, the calibration transfer from powder mixtures to compacts focuses on the transfer across two different sample forms that share underlying chemical similarity but have varying physical characteristics (e.g., density). Also, this study considers the two sample forms analyzed by the same or different instruments. Another aspect that makes this transfer unique is that a spectrum collected on a specific powder mixture sample cannot be matched with a corresponding compact spectrum. Instead, spectral data from a particular blend are paired with multiple compact spectra of the same chemical identity. Together, these differences present unique challenges for the prediction of active pharmaceutical ingredient (API) concentration in compacts from a calibration model developed on powder mixtures.
Prediction augmented classical least squares (PACLS) is an algorithm that augments a classical least squares (CLS) calibration model with spectral shapes of known interferences (e.g., changes in density) present only at the prediction step. This augmentation allows for orthogonality between the interference and the prediction of the analyte of interest. 11 Prediction augmented classical least squares is the first among a series of algorithms published by Dave Haaland et al.12,–15 that focused on augmenting the original model calibration using empirically derived signals from either concentration or spectral information. This study aims to explore the potential of PACLS for calibration transfer from pharmaceutical powder mixtures to compacts by augmenting the original model calibration with spectral representations of the density difference between the two sample forms.
EXPERIMENTAL
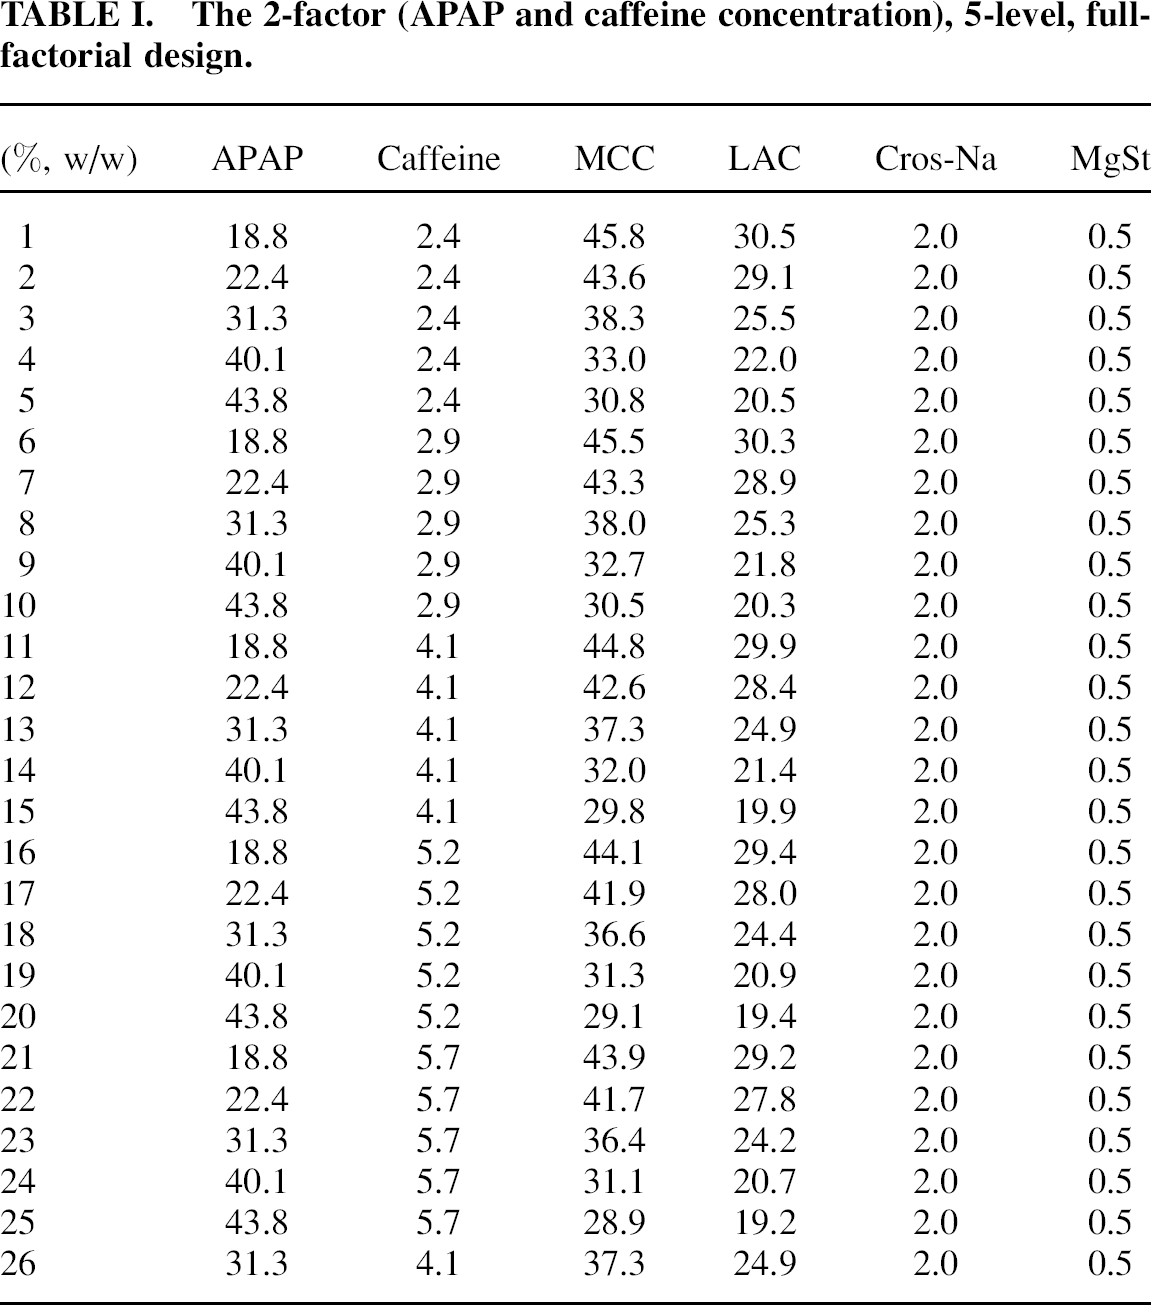
The 2-factor (APAP and caffeine concentration), 5-level, full-factorial design.
Materials for each design point were dispensed by weight and transferred to 25 mL glass scintillation vials. In total, 6 g of material was weighed for each design point. The vials were tumbled on a rotating Jar Mill (United States Stoneware, East Palestine, OH, USA) at 10 rpm. The mixing was stopped every 15 s to collect an NIR reflectance spectrum through the bottom of the vial on an Antaris Target Blend Analyzer with a 10 mm spot size (Thermo Fisher Scientific, Madison, WI, USA). The wavelength range of the spectrometer is 1350-1799 nm with 959 wavelength channels in total and spectral resolution of 1 nm.
The end point of mixing for individual powder samples was determined using an efficient calibration model approach.16,17 This was based on the spectra of pure components and the formulation composition at the central design point. Efficient calibration is a general term 16 that describes a chemometric approach aimed at building a calibration model using only pure component raw materials and samples representative of the target formulation composition, compared to the traditional model calibration approach requiring a variety of formulation compositions around the target formulation. The pure component spectra and spectra representative of a homogeneous mixture of the central formulation point were collected separately. The model was used to track the concentrations of APAP, MCC, and LAC during the powder mixing for each design point. Mixing was terminated once the pooled relative standard deviation 18 of the predicted concentrations of APAP, MCC, and LAC across three consecutive data points was below 3%. Equal weight was given to each constituent when pooled relative standard deviation was calculated.
Blended powder mixtures were transferred to an Instron Universal Testing System (Model 5569, Instron Corp., Norwood, MA, USA) to produce compacts with a target mass of 770 mg. The compaction force was 5 kN with a compression speed of 90 mms−1. Six replicate compacts were produced for each design point. Immediately after compaction, unrelaxed compacts were scanned using the Antaris Target Blend Analyzer. After 10 days, 19 the relaxed compacts were scanned on a FOSS NIR Systems 5000 attached to a Rapid Content Analyzer (FOSS NIRSystems, Inc., Laurel, MD, USA). The spectral resolution was 20 cm−1 and the wavelength range was 1100-2498 nm with 2-nm step-size across 700 wavelength channels.

where Averaged powder mixture (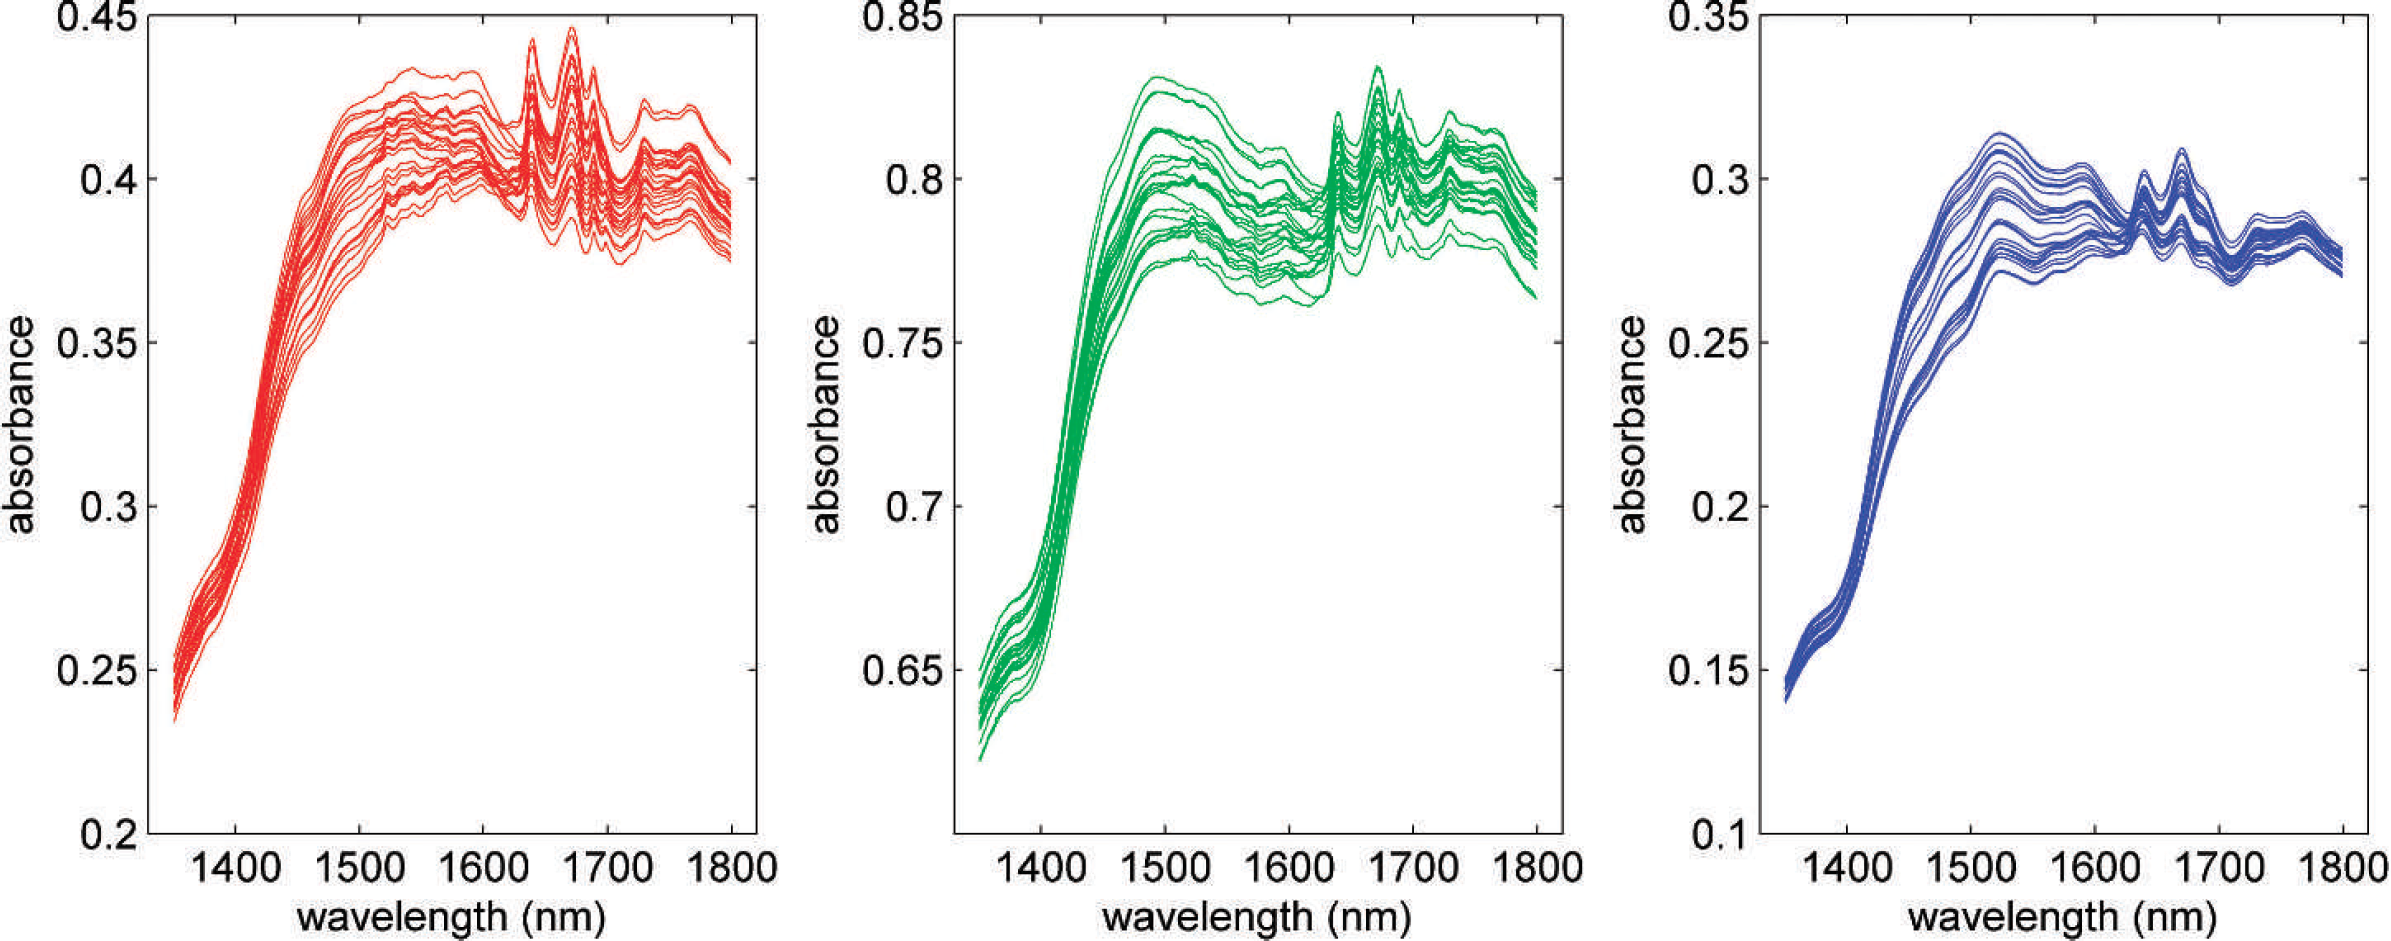

Considering the purpose of the study and the nature of this application on pharmaceutical samples, three out of six compact spectra per design point were randomly selected to form a transfer sample set. This set of sample data was used to derive spectral shapes and augment the original CLS model with spectral shapes representative of powder-compact density difference. The remaining three compact spectra per design point were used to form a test dataset. Therefore, the test data matrices for the Antaris Target Blend Analyzer and the FOSS bench spectrometers were 78×969 and 78×700, respectively (Fig. 1, middle and right panels).
Two calibration transfers were performed. The first (intra-spectrometer) transfer was from powder mixtures to unrelaxed compacts both scanned on the Antaris Target Blend Analyzer. The second (inter-spectrometer) transfer was from powder mixtures scanned on the Antaris Target Blend Analyzer to relaxed compacts scanned on the FOSS benchtop spectrometer. Due to the difference in number of wavelength channels and wavelength range of the two spectrometers, cubic spline interpolation was performed on the overlapping wavelength range for the second transfer.
Concentration predictions using PACLS are performed by

where  represents the augmented matrix with spectral shapes representative of density differences added as rows to the original
  matrix. The augmentation step here served to correct the estimated predicted concentrations for changes in the signal due to compaction. The
  term represents the CLS-estimated concentrations after augmentation for each compact in the matrix of prediction set spectra
For the PACLS method, three approaches were used to obtain the augmented spectral shapes:
PACLS Approach I: For each design point, a differential spectrum was calculated using the average powder spectrum in the calibration dataset and the average compact spectrum in the transfer sample set (Fig. 2). This resulting spectral shape per design point was then used to augment the CLS calibration for each compact in the prediction dataset according to its target formulation composition, resulting in 26 unique K matrices of size 4×969. The extra row in each K represented the averaged spectral difference between powder mixtures and compacts corresponding to that particular design point.
PACLS Approach II: For each design point, the spectral difference between the averaged powder spectrum in the calibration dataset and each individual compact spectrum in the prediction dataset was calculated. In this case, a unique differential spectrum was calculated for each tablet in the prediction dataset, resulting in 78 K matrices, each with dimensions of 4×969. The extra row in K represented the individual spectral difference per compact compared to its corresponding averaged powder spectrum.
PACLS Approach III: Principal component analysis (PCA) was performed on a differential spectral matrix between the averaged powder spectrum (calibration) and the average compact spectrum (transfer set) at each design point. Data were mean-centered prior to PCA. In total, five loadings that were not characteristic of random, high-frequency noise and the average spectrum of the matrix were augmented to the original CLS calibration. This resulted in one  matrix with nine rows. The extra rows in
  represented the overall spectral difference between compacts and powder mixtures across all the formulation design points.
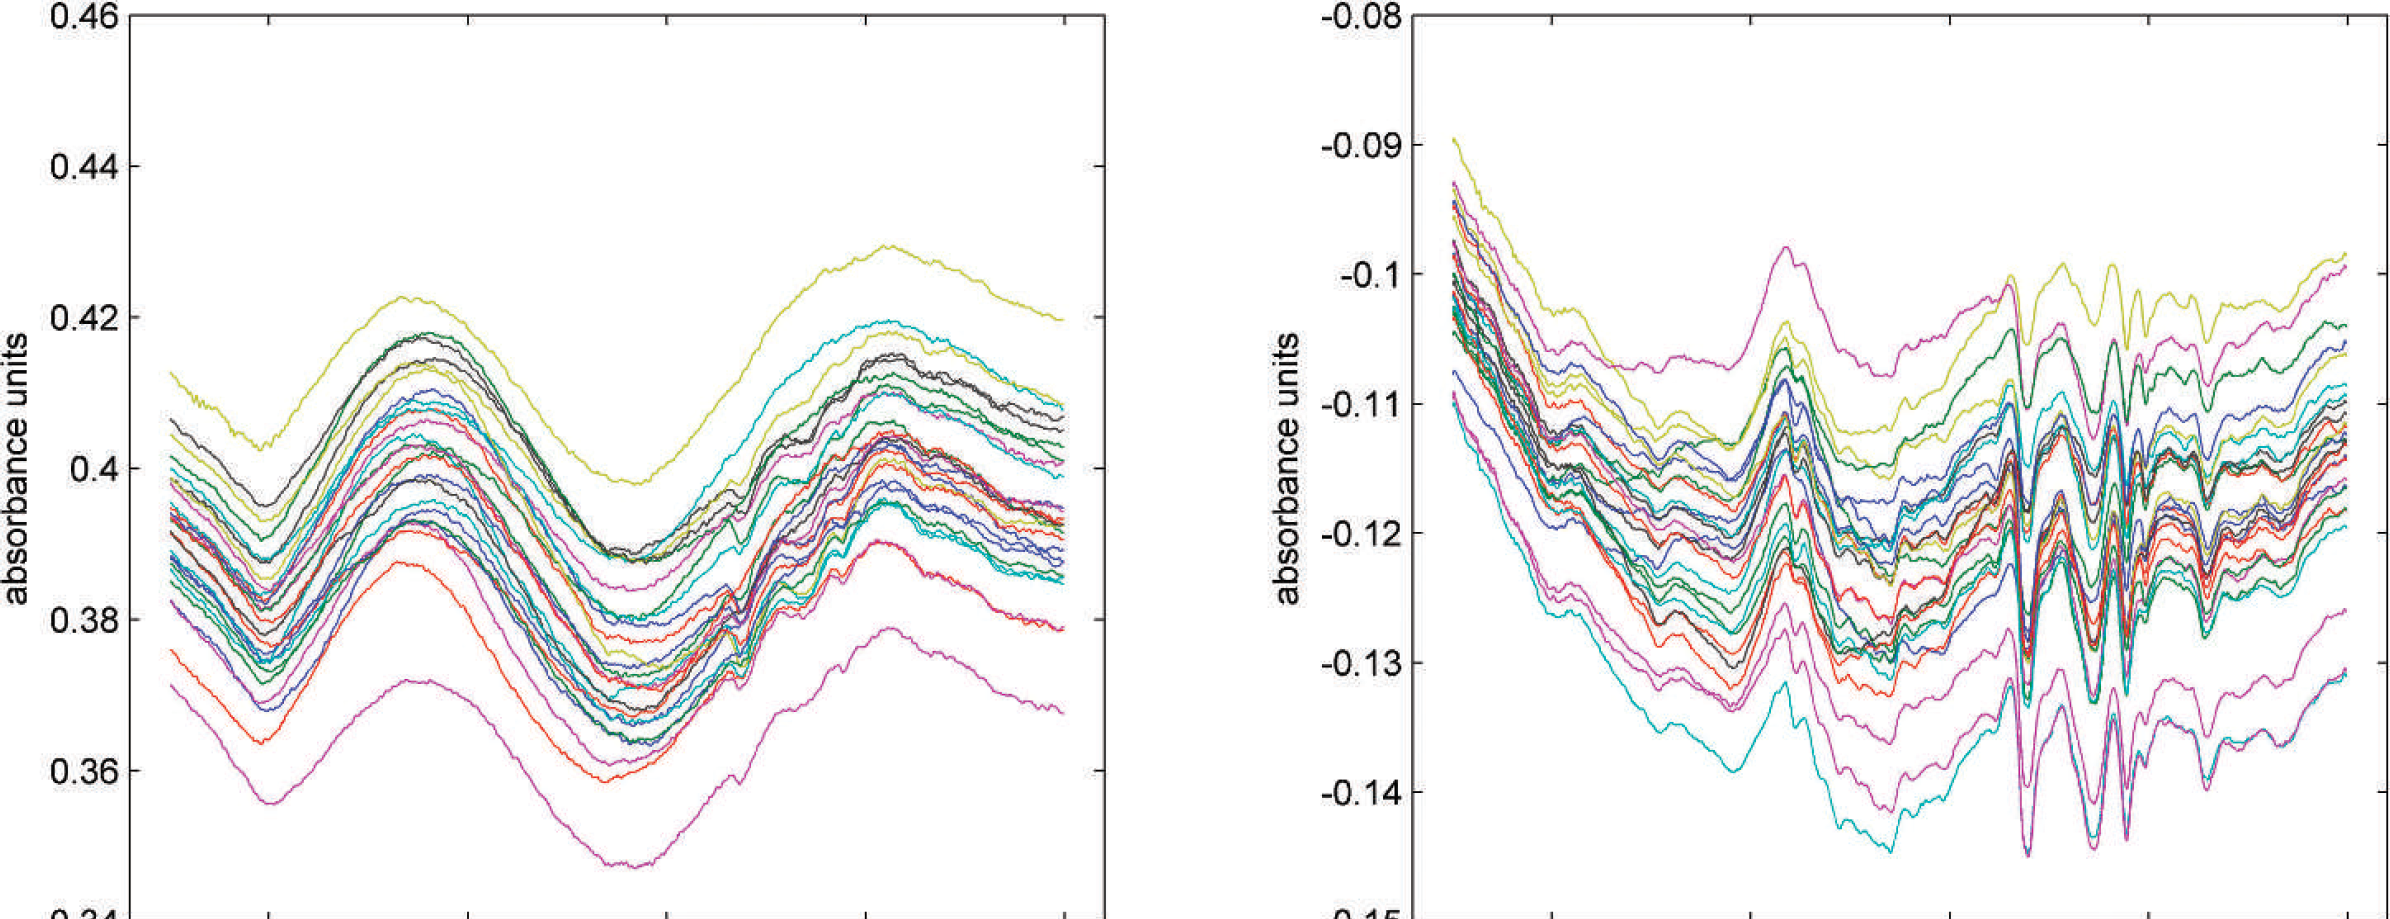
Differential spectrum per design point between an averaged powder mixture spectrum in the calibration set and an averaged compact spectrum in the transfer set for intra-spectrometer transfer (
The root mean square errors of calibration (RMSEC) and prediction (RMSEP) between predicted and nominal values were used as criteria to compare the calibration and prediction performance among the different techniques. Further, a significance test 21 on the difference between two prediction errors from two separate methods was performed to determine the significant differences in terms of bias and standard deviation (α = 0.05). According to the test, a significant difference for either bias or standard deviation was considered to be a statistically significant difference between two methods with respect to prediction error.
Preliminary data analysis indicated poor model performance for caffeine (data not shown). The poor performance was probably due to the relatively low caffeine concentration (Table I) and significant overlap in spectral features compared to the other three main components (data not shown). Thus, results will only be presented and discussed for calibration/prediction performance of APAP.
RESULTS AND DISCUSSION
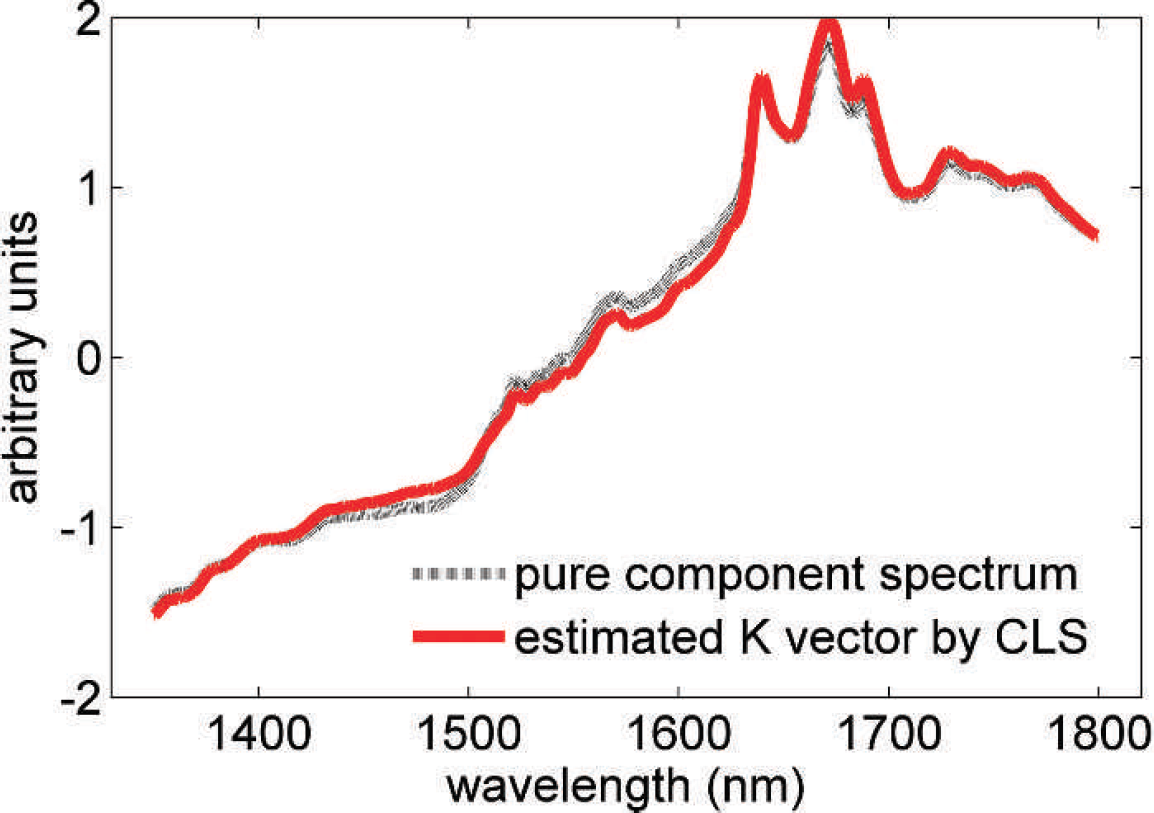
Spectral comparison of pure component spectrum of APAP (dashed line) and the estimated
The CLS and PLS calibration and prediction of APAP concentration for both transfers (i.e., powder mixtures to unrelaxed and relaxed compacts on the same instrument and across different instruments, respectively) are shown in Table II. Considering the concentration variation in the full-factorial design, it was expected that CLS and PLS would generate suitable calibration models, as indicated by the low RMSEC values. The inflated test results (RMSEP) clearly demonstrated the adverse effect of the external interferences (i.e., differences in density) on the APAP concentration prediction in compacts. Similar results were observed when either CLS or PLS was applied. In addition, the use of either MSC or SNV as spectral preprocessing was found to be the best generic pretreatment to mitigate spectral variance due to physical interferences (i.e., density change) and reduce prediction error. Only results corresponding to MSC pretreatment are presented here.
Comparison of RMSEC and RMSEP on APAP concentration across multiple algorithms for both steps of transfer.
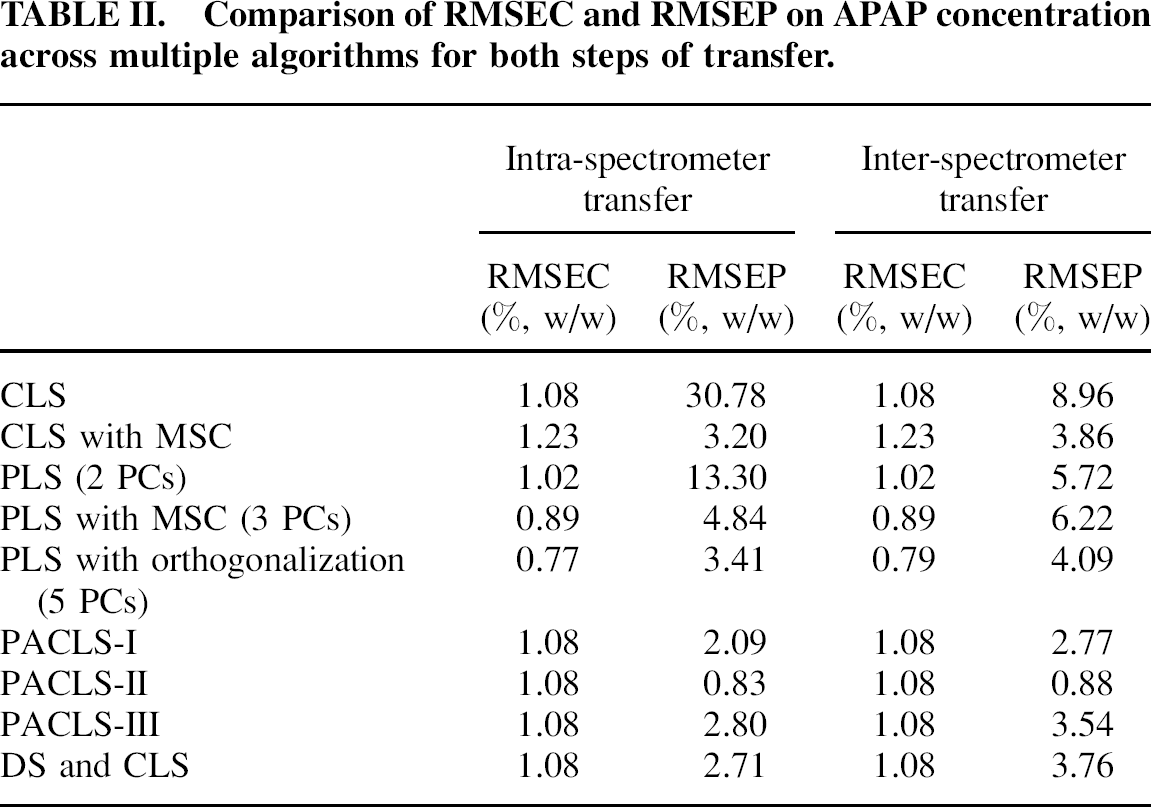
The improvements in prediction error of the three PACLS approaches over MSC pretreatment followed by either CLS or PLS for both calibration transfers are presented in Table II. The significance of this difference was confirmed between PACLS Approach I or II and other techniques in terms of both bias and standard deviation (p < 0.05). 21 Again, PACLS Approach III only showed significantly improved prediction bias compared to other techniques (p < 0.05). This indicated that the augmentation step in PACLS was more effective than MSC in reducing the physical interference by updating the original model with information that was specific to the density difference between sample forms.
Although both PACLS and orthogonalization followed by PLS similarly addressed the physical interference introduced by the density change, all PACLS approaches on both transfers outperformed the orthogonalization followed by PLS, especially PACLS Approaches I and II. The standard deviation of prediction error was significant between PACLS Approach I or II and orthogonalization followed by PLS (p < 0.05), while no significant difference on the bias of prediction on the test set was evident between any of the PACLS approaches and the orthogonalization followed by PLS. In addition, considering the fact that orthogonalization needed to be conducted at both calibration and prediction steps, the advantage of PACLS is that it did not require alteration of the original calibration model; augmentation only took place at the prediction step.
The prediction performance of CLS following the implementation of PDS improved as the wavelength window increased (data not shown). This was due to the fact that PDS was initially designed to handle the transfer problem involving wavelength shift across instruments. However, the powder-compact density differences studied here often induce slope and baseline differences across the entire wavelength range. Therefore, the entire wavelength range was used to perform the standardization. After using CLS with DS on the transfer samples, the prediction performances of PACLS Approaches I and II on both transfers were found to outperform that of CLS with DS, where a significant difference in the prediction error was found in terms of standard deviation but not bias of prediction error (p < 0.05). This indicated that PACLS was better suited to handle the unique calibration transfer presented in this case compared to traditional calibration transfer approaches.
In addition, the superior prediction performance of three PACLS approaches relative to other modeling techniques was demonstrated for both intra- and inter-spectrometer calibration transfers. This confirmed the capability of PACLS to handle such a combinational transfer problem involving both sample and spectrometer changes. This also illustrated the efficiency of utilizing and orthogonalizing against spectral differences as an empirical and direct approach to address both sample and spectrometer differences. This is expected to facilitate calibration model development and maintenance under practical situations.
Approach II generated the lowest prediction error (RMSEP) among all PACLS approaches tested for both transfers (Table II). Moreover, this approach presented a lower RMSEP than the calibration error of the original CLS model. Low RMSEP was expected based on the fact that the information of the differential spectrum used during the augmentation step was not independent of the prediction step. Although this approach violated the traditional independent relationship between calibration and prediction datasets, it did not use the concentration information of the prediction dataset (i.e., the APAP concentration of compacts). Instead, only spectral information was used for augmentation. In addition, because a differential spectrum for each compact was used for augmentation, the potential pitfall of this approach is the possibility that chemical concentration differences among replicate tablets was inadvertently removed. It is commonly acknowledged in the pharmaceutical industry that every replicate tablet does not contain the exact same API concentration compared to the target concentration in the powder blend. During the augmentation step, any potential inter-tablet concentration differences were orthogonalized and removed from the concentration prediction, in addition to the orthogonalization against the physical difference. Therefore, orthogonalization against physical interferences while minimizing orthogonalization against chemical differences is required for optimum utilization of PACLS. Further evaluation of PACLS Approach II using reference values obtained by wet chemistry methods is necessary for rigorous assessment of its advantages and potential issues with orthogonalization against concentration differences.
When considering the application of such methods, one must not forget that only one level of active ingredient would actually be targeted. Thus, practitioners would augment the original K matrix with the shape only associated with the concentration level of interest. That is also why the augmentation steps in PACLS Approaches I and II were performed by adding only differential spectra to the original K matrix that were of the API level of interest. The reason for multiple derived spectral shapes across the entire design of experiments (DOE) reported here was to allow formulation-dependent differential spectral to update the original CLS model in order to evaluate prediction performance on sufficient samples and concentration levels. In addition, another consideration is that the differential spectra at other API concentration levels would not be available under practical situations when the goal of a successful calibration model is to predict the target API in the compacts. Thus, considering the practicality of a successful calibration transfer from powder mixtures to compacts by PACLS, augmentation by differential spectra exclusively representative of nominal API contents is a recommended practice.
CONCLUSIONS AND PERSPECTIVES
PACLS was demonstrated to be a potentially useful tool for achieving a successful calibration transfer for intra- and inter-spectrometer transfers of pharmaceutical powder mixtures to compacts. The augmentation by the differential spectra/spectrum between powder mixtures and compacts for a given formulation composition was demonstrated to be advantageous over common modeling approaches with necessary spectral pretreatments and standardization. Future studies utilizing industrial data, including comparisons between PACLS prediction and reference values as determined by wet chemistry methods will be necessary to further investigate the potential advantages and limitations of this approach.