
Abstract
As one of the important thiazole derivatives, 2-aminobenzothiazole (2-ABT) has been widely used as a structural unit in the synthesis of antioxidants, anti-inflammatories, herbicides, antibiotics, and thermoplastic polymers. In this study, the interaction of 2-ABT with human serum albumin (HSA) was investigated in vitro under simulated physiological conditions, using multi-spectroscopic techniques and a molecular modeling study. The binding constant and binding sites were determined through fluorescence quenching spectra. The site-competitive replacement experiments revealed that the precise binding site of 2-ABT on HSA was site II (subdomain IIIA). Moreover, molecular docking results illustrated the electrostatic interaction between Glu 450 and 2-ABT, in accordance with the conclusions from the calculated thermodynamic parameters and the effect of ionic strength. The effect of 2-ABT on the conformational changes of HSA were evaluated by ultraviolet–visible (UV-Vis) absorption, three-dimensional (3D) fluorescence, synchronous fluorescence, and circular dichroism (CD) spectroscopy. This work facilitates comprehensive understanding of the binding of 2-ABT with HSA, contributing to evaluate the molecular transportation mechanism and biotoxicity of 2-aminobenzothiazole derivatives in vivo.
INTRODUCTION
As a well-known model protein and the most abundant protein in the plasma (about 7.0 × 10⁻⁴ mol L−1), 1 serum albumin serves as a carrier for many endogenous and exogenous compounds, including fatty acids, amino acids, vitamins, drugs, and contaminants.2,3 Composed of a single polypeptide chain consisting of 585 amino acid residues, 4 human serum albumin (HSA) is characterized by high α-helical content and many disulfide bonds. 5
The compounds containing a thiazole ring have shown useful biological properties. For instance, one of these important thiazole derivatives, 2-aminobenzothiazole (2-ABT, Scheme 1) has been widely used as a structural unit in the synthesis of anti-oxidants, anti-inflammatories, herbicides, antibiotics, and thermoplastic polymers. 6 The biotoxicity of 2-aminobenzothiazole derivatives, in other words, whether they can affect the structure and function of biomacromolecules, should be considered. In our previous research, we found that 2-ABT can interact with DNA in minor groove binding mode. 7 There have been some other studies carried out in this field. Joanne Patman et al. synthesized a series of substituted 2-aminobenzothiazole compounds and evaluated them as nitric oxide synthase (NOS) inhibitors. 8 Farukh Arjmand et al. indicated the strong binding between calf thymus DNA and the Cu (II) complex of a new ligand derived from the reaction of the Schiff base of 2-aminobenzothiazole and salicylaldehyde with KBH4. 9
Many studies on the interaction between organic materials and HSA at the molecular level have been reported, especially using optical spectroscopic methods.10–14 In order to demonstrate the precise binding site of 2-ABT with HSA, molecular modeling studies were employed along with multi-spectroscopic technology. This combination of spectroscopic and molecular modeling study can be applied to investigate the interaction mechanism between small pollutants and biomacromolecules.2,5,15
MATERIALS AND METHODS
HSA (Sigma) was dissolved to form a 5 × 10⁻⁵ mol L−1 solution then preserved at 0–4 °C. This solution was further diluted as required.
We prepared a stock solution of 2-ABT (2.0 × 10⁻³ mol L−1) by dissolving 0.03 g of 2-ABT purchased from TCI in 100 mL of water.
NaCl solution (0.5 mol L−1) was prepared by dissolving 2.922 g of NaCl (Tianjin Damao Chemical Reagent Factory) into 100 mL of water.
Phosphate buffer (0.2 mol L−1, mixture of NaH2PO4·2H2O and Na2HPO4·12H2O, pH 7.4) was used to control the acidity. NaH2PO4·2H2O and Na2 HPO4·12H2O were purchased from Tianjin Damao Chemical Reagent Factory.
Structure of 2-aminobenzothiazole (2-ABT).
Ultraviolet spectra were measured on a UV-2450 spectrophotometer (Shimadzu, Kyoto, Japan) equipped with a conventional quartz cell of 1.0 cm path length. The wavelength range of HSA was from 300 to 200 nm.
Circular dichroism (CD) measurements were made on a J-810 Spectropolarimeter (Jasco, Tokyo, Japan) in a 1.0 cm cell from 190 to 260 nm at room temperature and subtracted from the spectrum of buffer alone. Bandwidth was 1 nm and scanning speed was 200 nm/min. The content of the α-helix was calculated and compared at different molar ratios of 2-ABT/HSA.
All pH measurements were made with a pHs-3C acidity meter (Pen shun, Shanghai, China).
The crystal structure of HSA was available in the Protein Data Bank (PDB ID: 1BJ5). Water was removed from the PDB file. Essential hydrogen atoms and Gasteiger charges were added with the aid of AutoDock tools (ADT). After enclosing in the grid defined by AutoGrid, which had 0.375 Å spacing, the grid map was calculated using the AutoGrid program. Maximum number of iterations was 300 and maximum number of successes/failures in a row was 4. Docking simulations were performed according to a local search. The output from AutoDock was rendered with RasMOL.
RESULTS AND DISCUSSION
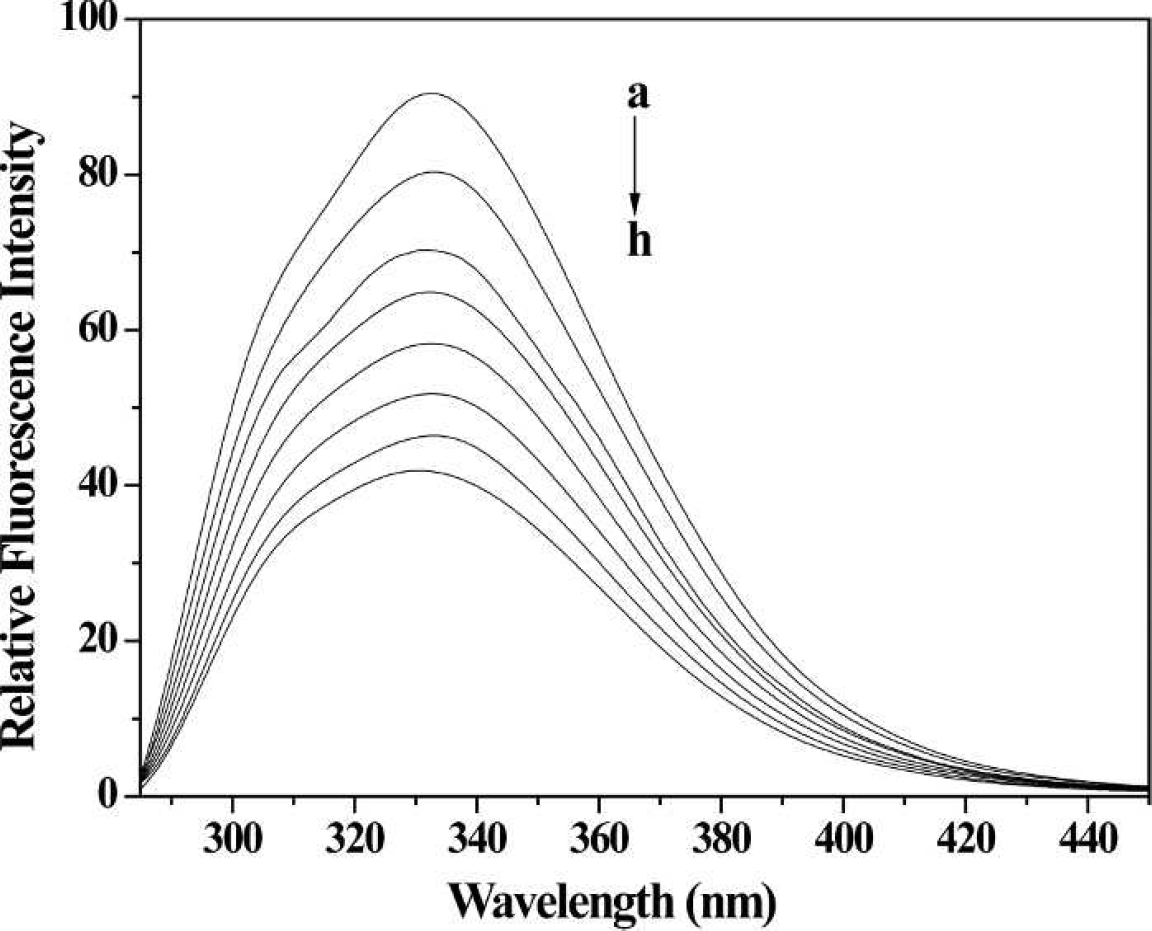
Fluorescence spectra of HSA with different concentrations of 2-ABT. Conditions: HSA: 5×10⁻⁶ mol L−1; 2-ABT / (10−5 mol L−1): (

where τ0 is the average life expectancy of the fluorescent molecule, and F and F0 are the fluorescence intensity of HSA with and without 2-ABT, respectively. Kq and Ksv are the quenching rate constant and Stern–Volmer quenching constant, respectively.
In this paper, Kq and Ksv at two different temperatures are listed in Table I. The fluorescence quenching of HSA by 2-ABT showed a linear relationship with its concentration. Generally, the fluorescent lifetime of biological macromolecules is approximately 10−8 s. 18 At 297 K, the quenching constant Kq was then calculated to be 1.06×10¹² L mol−1 s−1 (Ksv was 1.06×10⁴ L mol−1). This Kq is much bigger than the biggest diffusion control collision constant between the small molecular compound and biological macromolecule (2×10¹⁰ L mol−1 s−1). 19 Therefore, the quenching type of HSA by 2-ABT should be static quenching from the formation of the ABT-HSA complex, rather than dynamic quenching.
Stern–Volmer quenching constants for the interaction of 2-ABT with HSA at 297 K and 313 K.
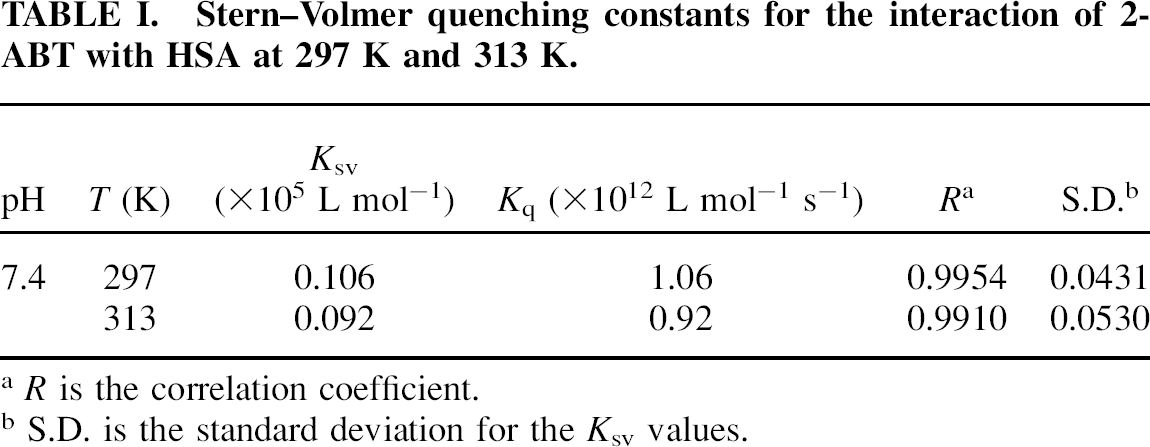
R is the correlation coefficient.
S.D. is the standard deviation for the Ksv values.
Moreover, fluorescence spectra at two different temperatures were measured because static quenching is different from dynamic quenching by the temperature effects. As shown in Fig. 2, the quenching rate constant decreased as the temperature increased, confirming the static quenching mode. 20 The main reason was that increasing temperature adversely affected the stability of the ABT-HSA complex. 21 On the contrary, Kq would increase because higher temperature leads to larger diffusion coefficients, which is characteristic of dynamic quenching.
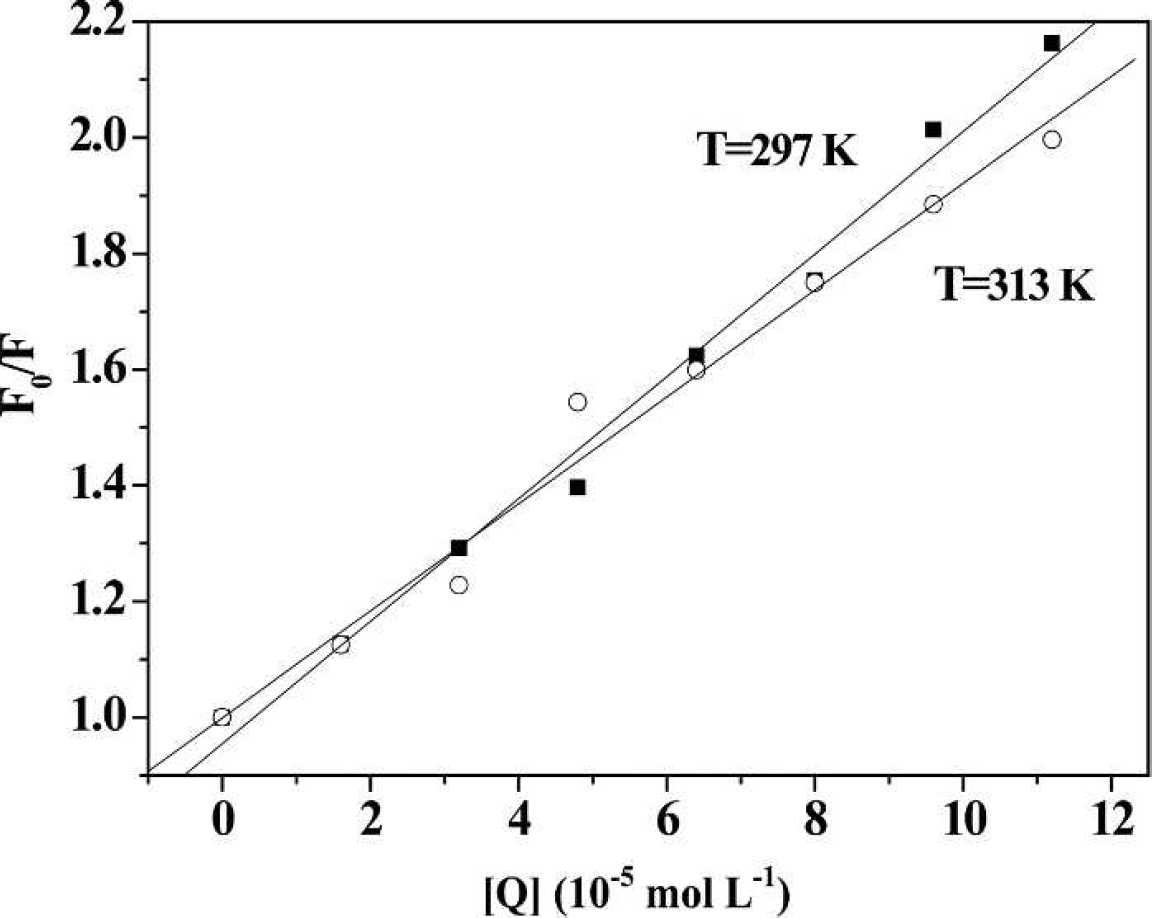
Stern–Volmer plot of the fluorescence quenching of HSA by 2-ABT at 297 K and 313 K.

KA and n, calculated from the double-logarithm curve (Fig. 3), are shown in Table II. The number of binding sites (n) was close to 1, indicating that 2-ABT interacted with HSA in the molar ratio of 1 : 1.
Binding parameters and relative thermodynamic parameters of the ABT-HSA system.
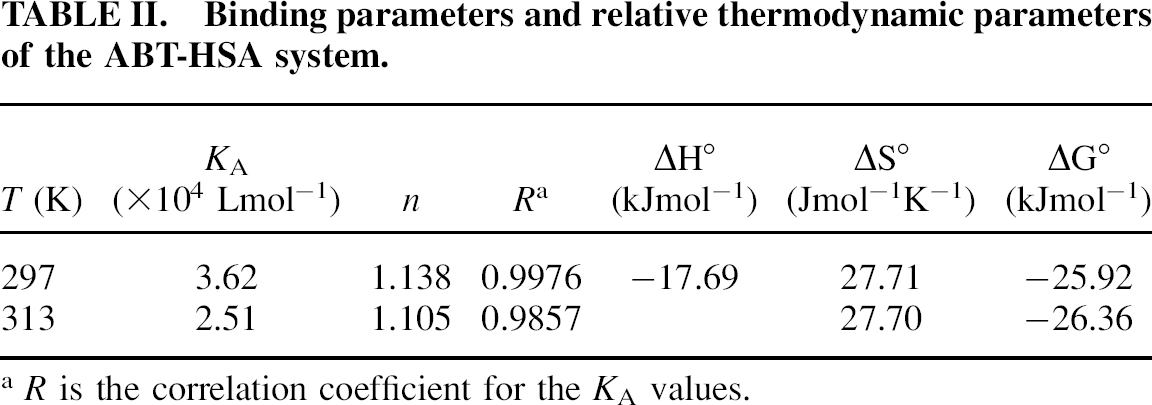
R is the correlation coefficient for the KA values.
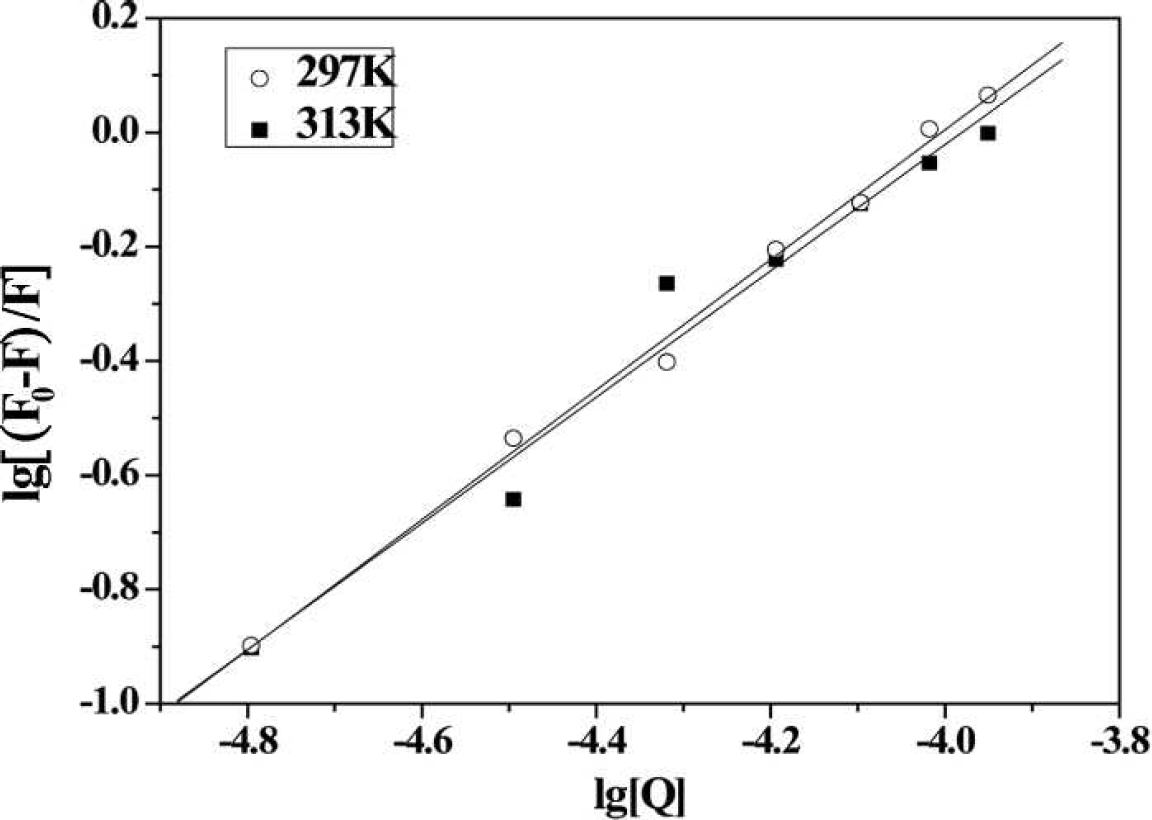
Plot of lg [(F0 – F)/F)] versus lg [Q] for adding various amount of 2-ABT to HSA.
Non-covalent interactions between small molecules and biomacromolecules involve four modes of binding forces: hydrogen bonds, hydrophobic force, electrostatic force, and van der Waals' interactions. The thermodynamic parameters, such as the enthalpy (ΔH°) and entropy (ΔS°), are important in confirming the binding mode. If ΔH° > 0, ΔS° > 0, hydrophobic interaction plays a major role in the reaction; if ΔH° ≈ 0, ΔS°> 0, the main force is the electrostatic effect; if ΔH° < 0, ΔS° < 0, the main forces are van der Waals and hydrogen bond interactions. 23
Since the change of temperature has no significant effect, ΔH° can be considered a constant and can be approximated from Eq. 3. The free-energy change (ΔG°) and the entropy change (ΔS°) of the binding reaction follow Eqs. 4 and 5, respectively:
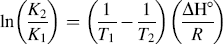


where K1 and K2 are the binding constants (analogous to KA in Eq. 2) at T1 and T2, and R is the universal gas constant.
The values of the thermodynamic parameters were ΔH° = −17.69 kJ mol−1, ΔG° =–25.92 kJ mol−1, and ΔS° = 27.71 J mol−1 K−1 at 297 K (shown in Table II). The negative sign for ΔG° and ΔH° means that the binding process was spontaneous and enthalpy-driven, respectively. Furthermore, the negative ΔH° and positive ΔS° indicate that electrostatic force played the major role during their interaction.
Effects of site probe on the binding constant of 2-ABT to HSA.

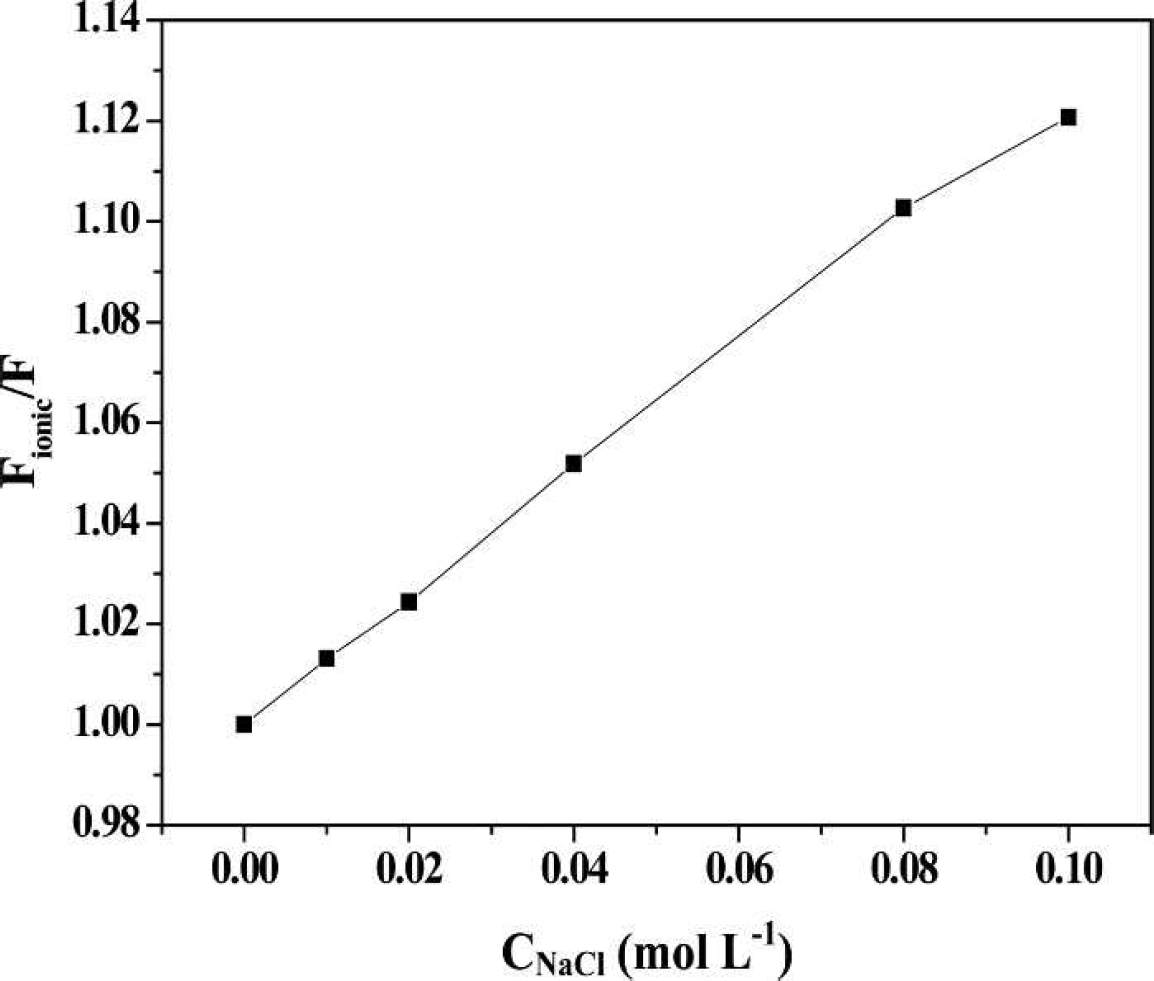
Effect of ionic strength on fluorescence quenching. Conditions: 2-ABT: 5.0 × 10⁻⁶ mol L−1; HSA: 5 × 10⁻⁶ mol L−1.
When pH = 7.4, 2-ABT takes on a positive charge through protonation. There is competition between it and Na+ for the residues, which are negatively charged. As a consequence, the electrostatic force of the ABT-HSA system was gradually weakened by Na+. More and more free 2-ABT exists in the solution, leading to the increasing fluorescence intensity.
The changes in KA after adding the site markers are shown in Table III. There is little difference in the absence and presence of phenylbutazone or digitoxin, suggesting 2-ABT was not displayed by these two drugs. Nevertheless, flufenamic acid gave a significant displacement of 2-ABT, indicating the binding site of 2-ABT on HSA was site II (subdomain IIIA).
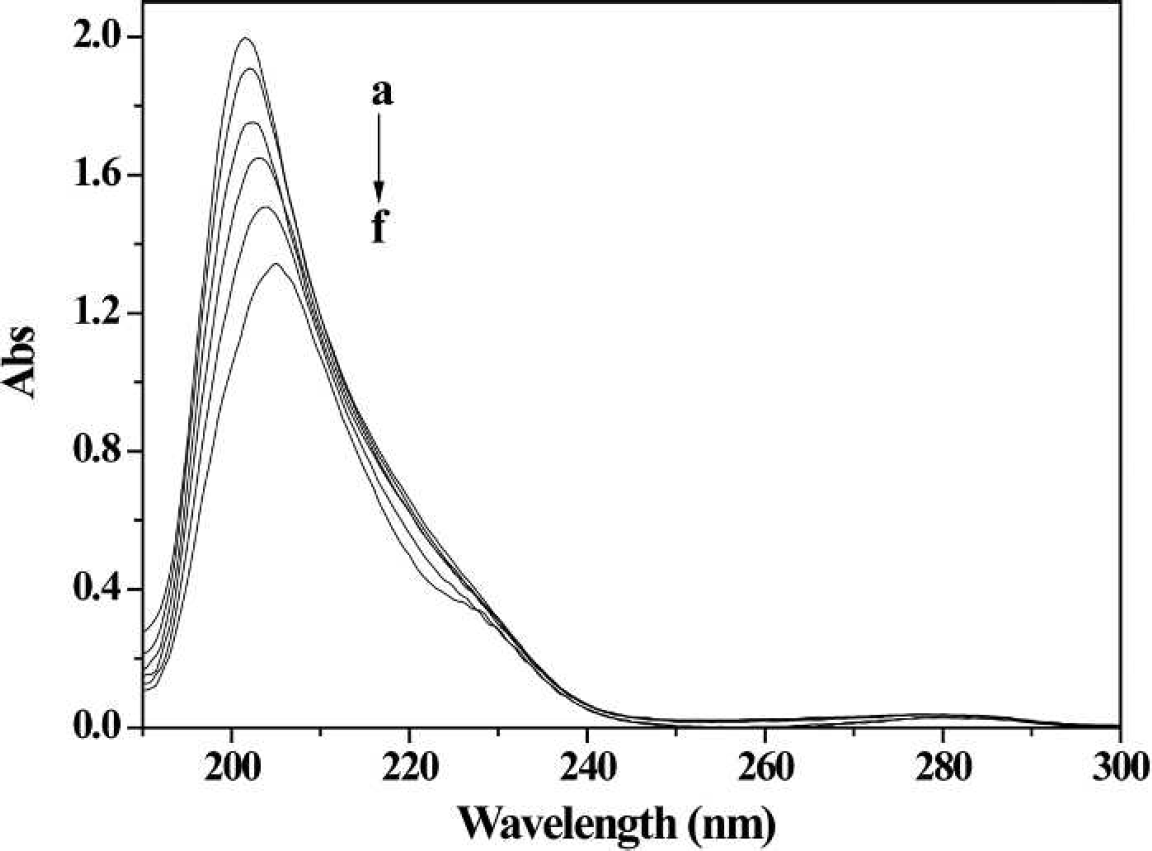
UV absorption spectra of HSA in the presence of different concentrations of 2-ABT (2-ABT in corresponding concentration was used as the reference solution). Conditions: HSA: 1×10⁻⁶ mol L−1; 2-ABT / (10−5 mol L−1): (
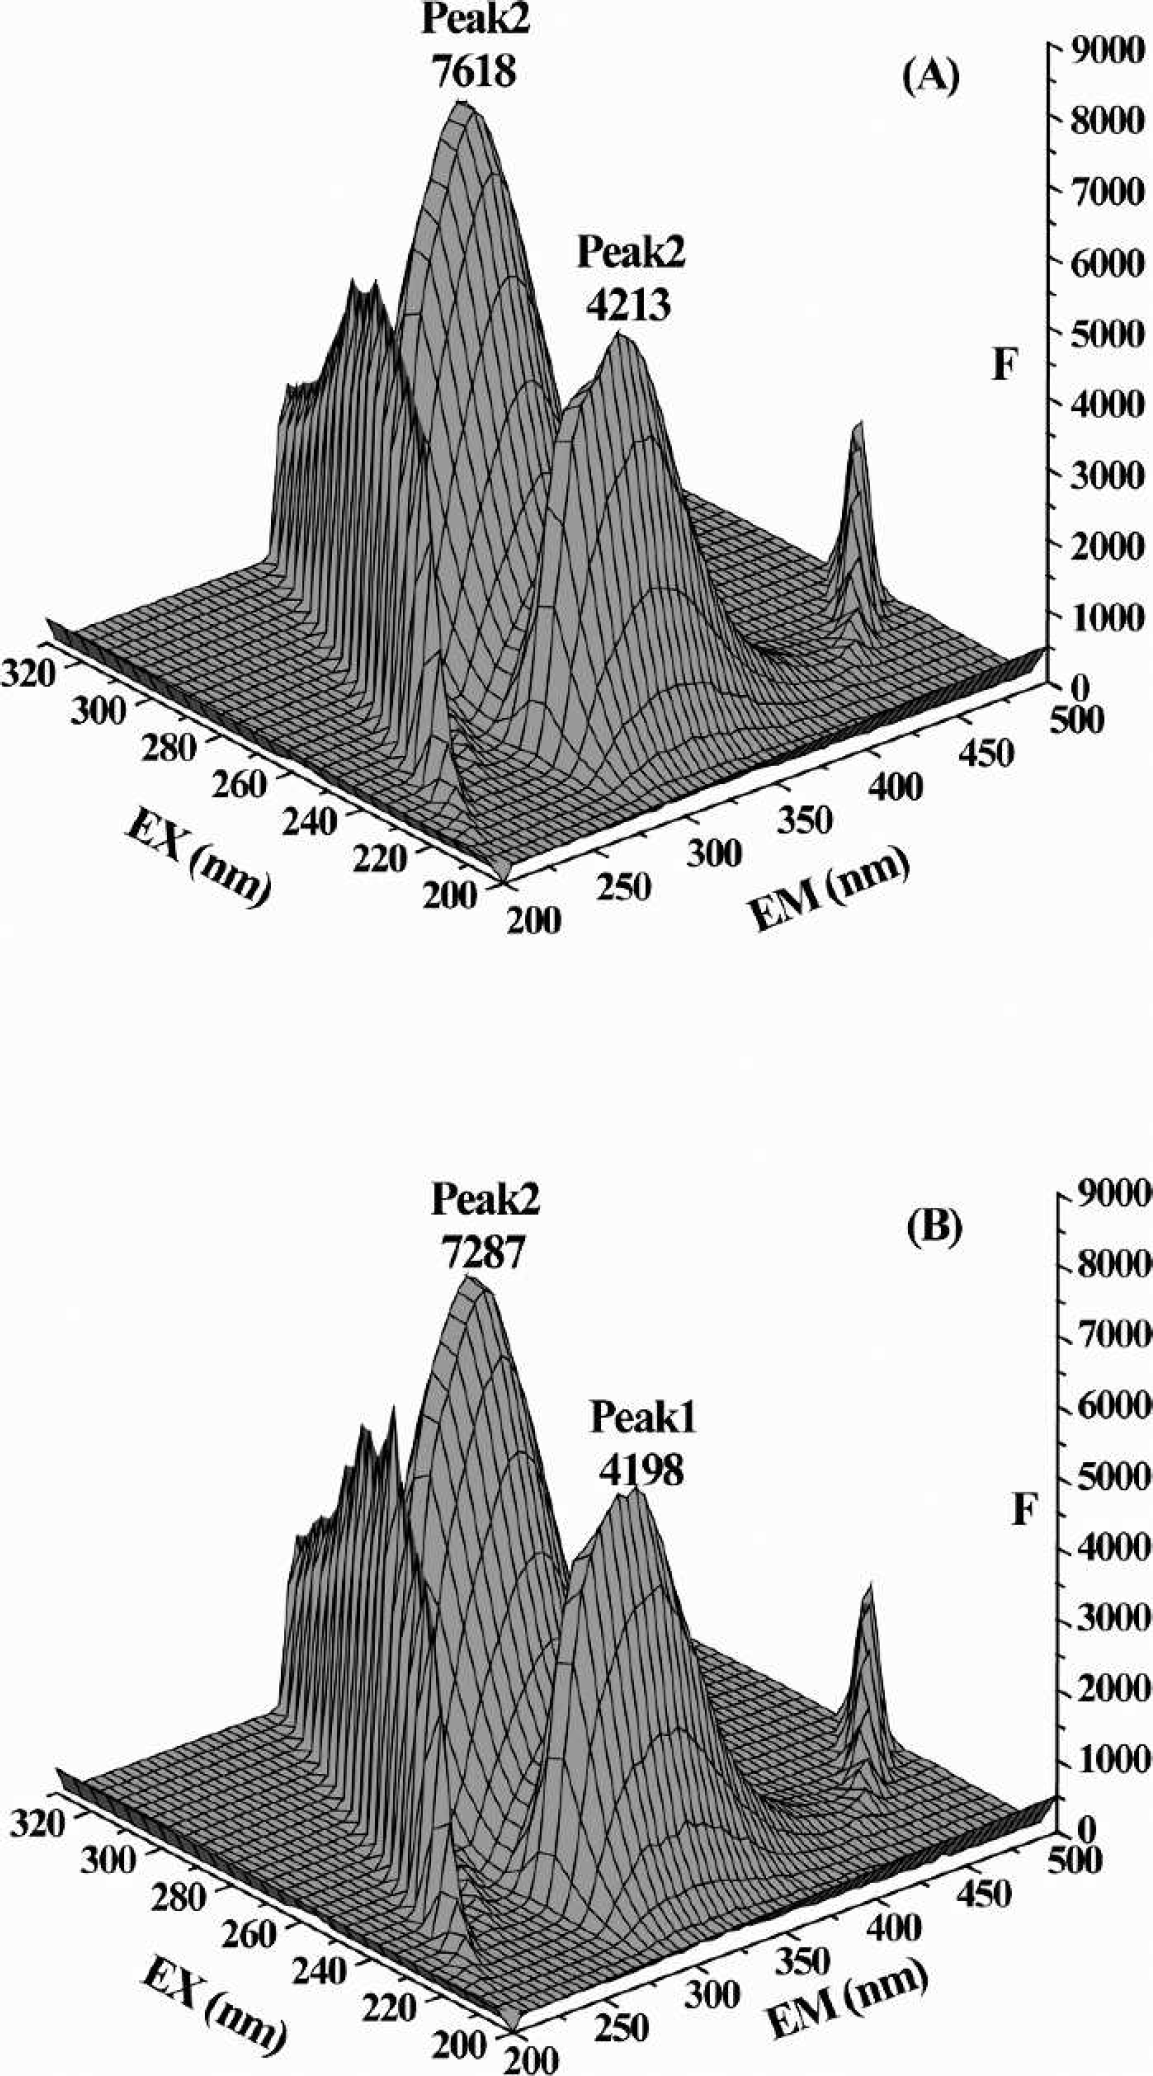
Three-dimensional fluorescence spectra of (
The peaks at the left and right were the first-order Rayleigh scattering peak (λem = λex) and the second-order Rayleigh scattering peak (λem = 2λex), respectively. Both of these two Rayleigh scattering peaks were enhanced after interaction because of the formation of the ABT-HSA complex, which led to the increase in the macromolecule diameter.
In the middle of the spectra, there were two intrinsic fluorescence peaks between two Rayleigh scattering peaks. The intensity of peak 1 (λex = 230 nm and λem = 330 nm), which represented the fluorescent behavior of the polypeptide backbone structures, was related to the secondary structure of protein, 27 whereas peak 2 (λex = 278 nm and λem = 330 nm) demonstrated the spectral behavior of the chromophore (mainly tryptophan and tyrosine residues).
After binding with 2-ABT, peak 1 decreases only a little (about 0.36%), suggesting that the peptide structure of HSA had been changed slightly. However, the quenching of peak 2 was much more obvious (4.34%) because the microenvironment of the chromophore may have been changed.
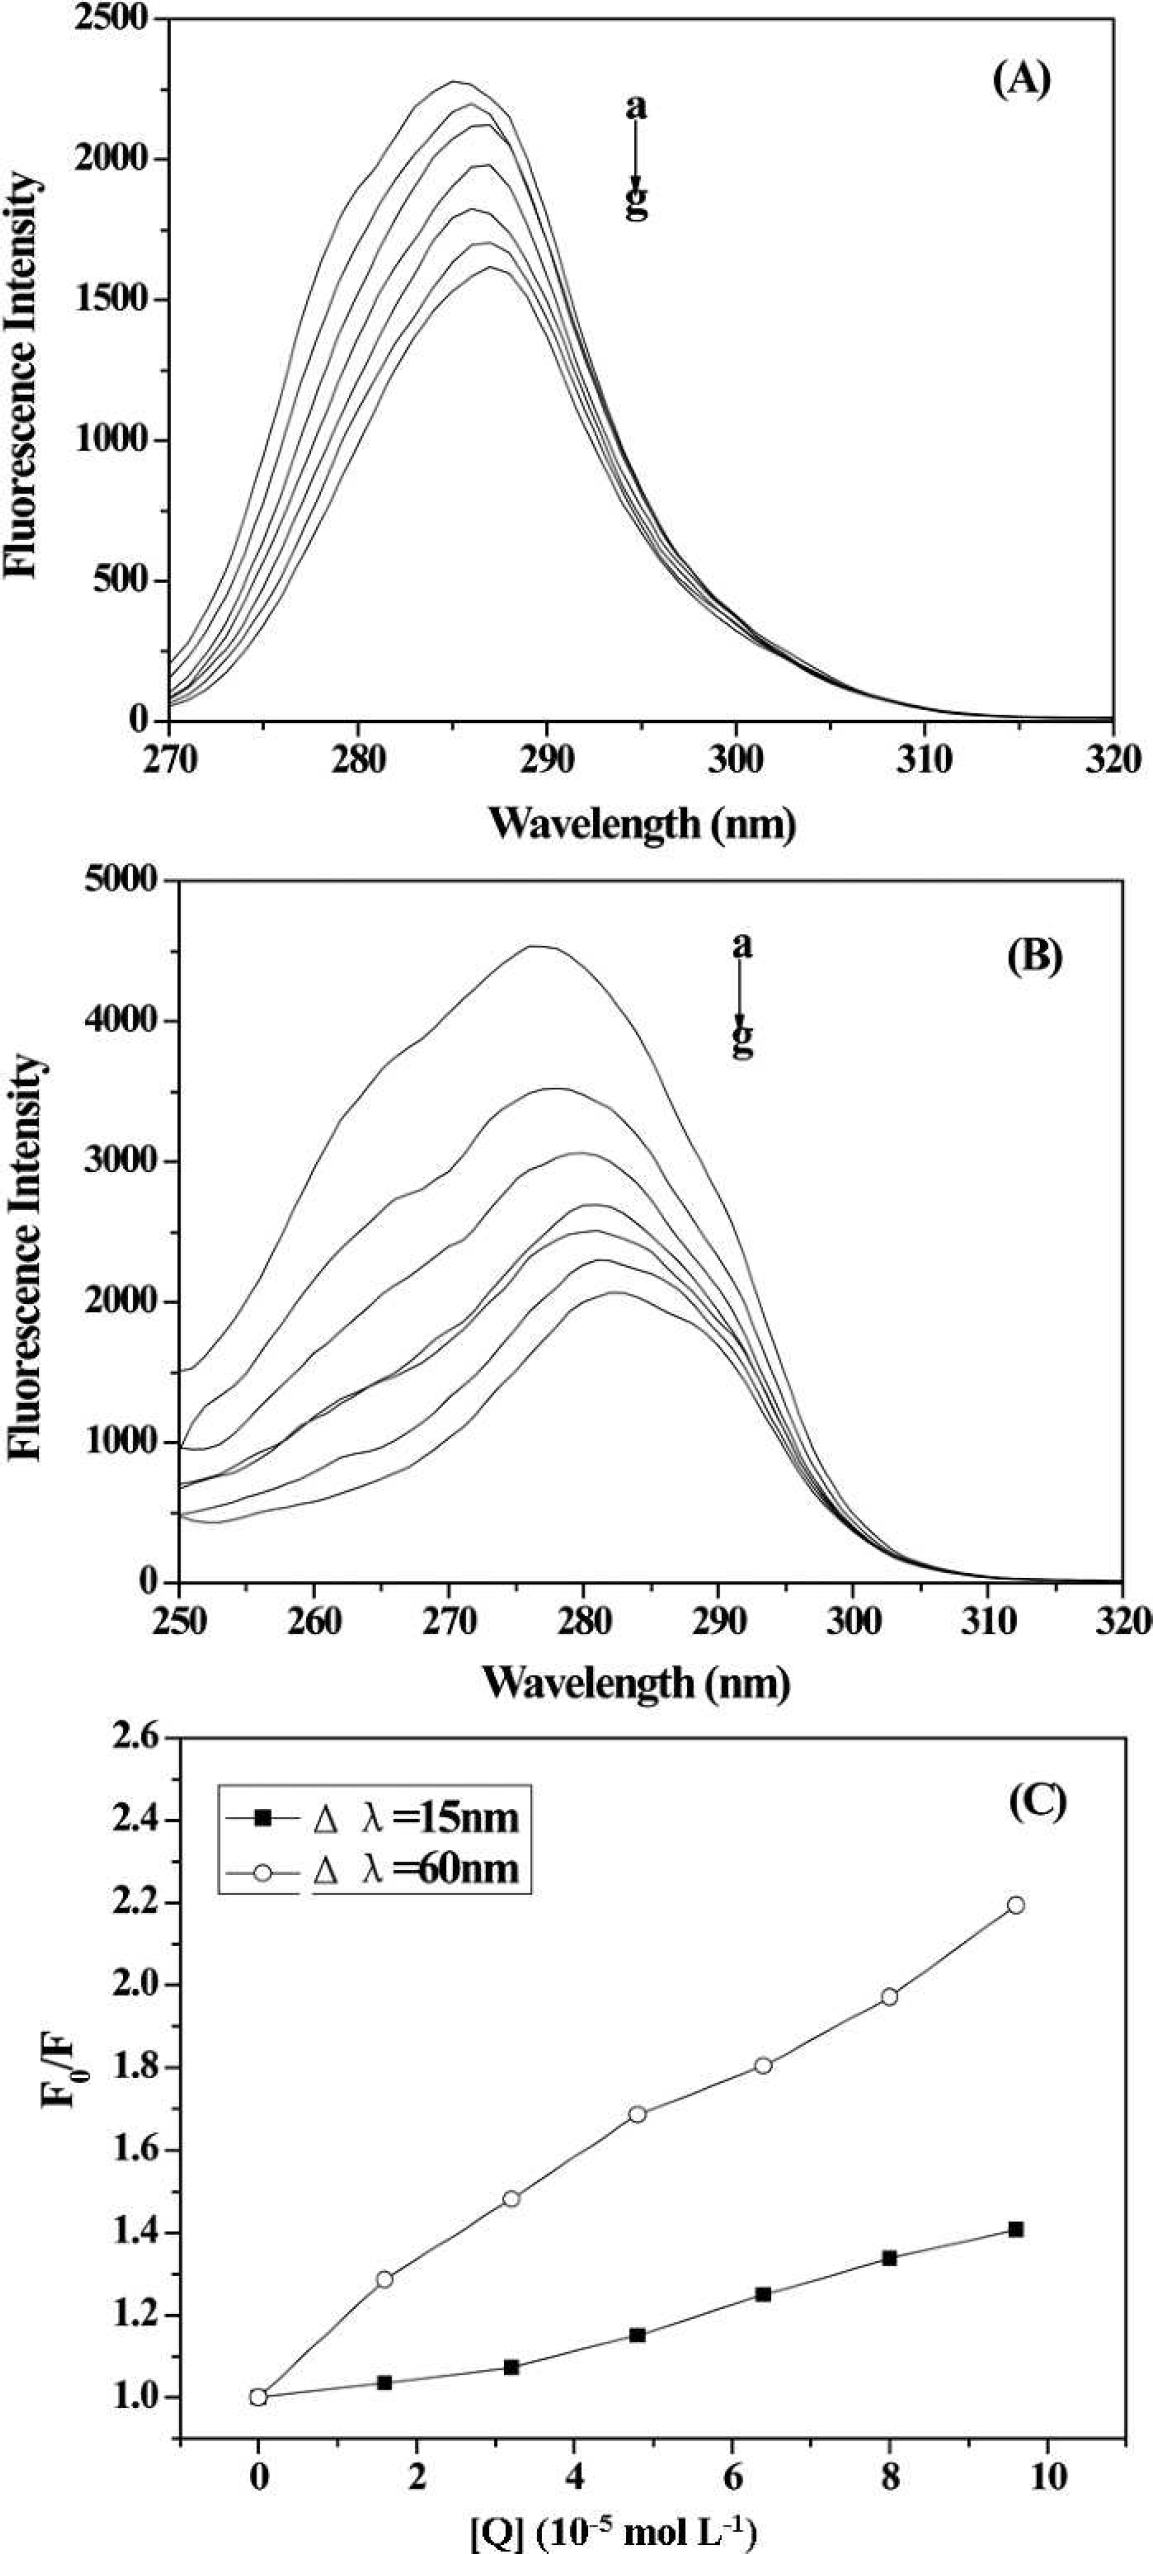
Synchronous fluorescence spectra of HSA: (
As the concentration of 2-ABT increased gradually, the synchronous fluorescence intensity decreased and both of the peaks of tyrosine and tryptophan residues shifted towards a longer wavelength significantly, which indicated that the hydrophobicity of these residues decreased and the residues buried in nonpolar hydrophobic cavities were moved to a more hydrophilic environment. 36 However, the slope was higher when Δλ was 60 nm (Fig. 7C), suggesting that 2-ABT was vicinal to tryptophan residues compared to tyrosine residues.
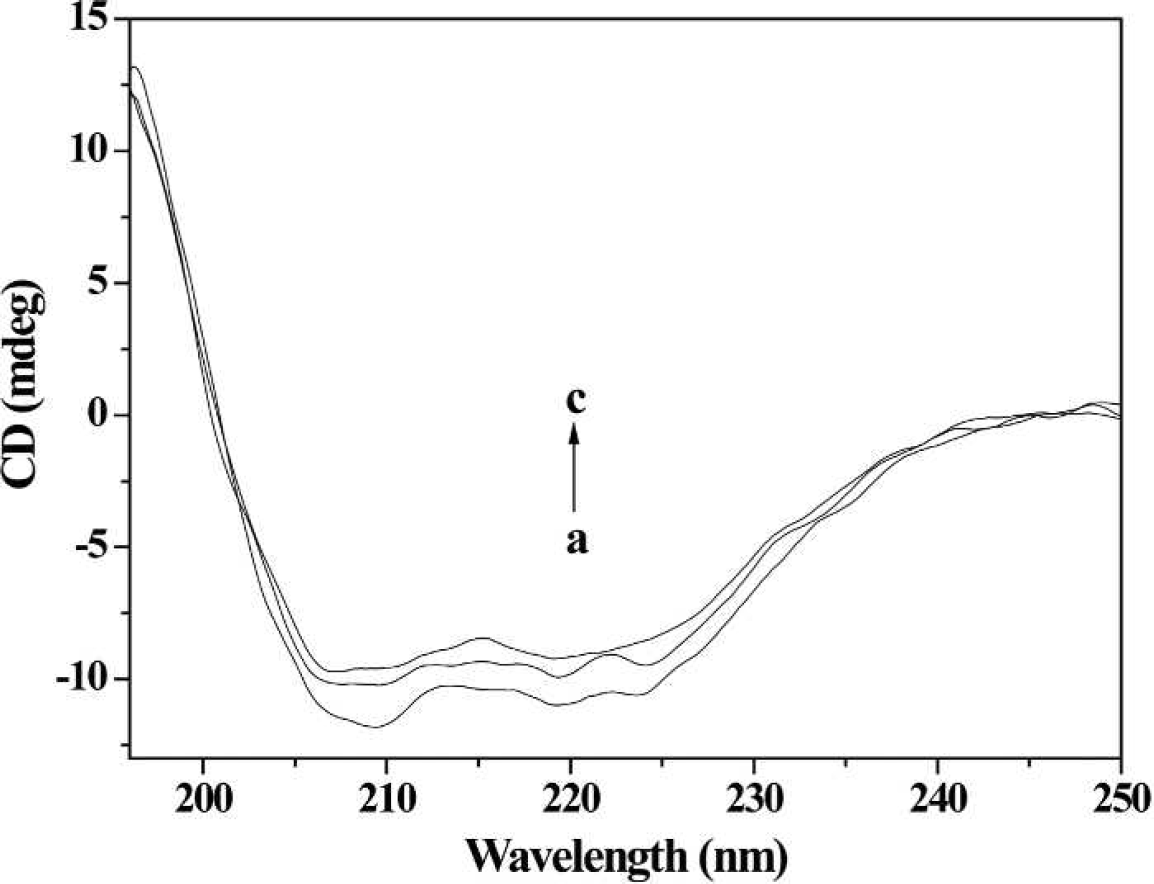
CD spectra of HSA in the presence of 2-ABT. Conditions: HSA: 1× 10⁻⁷ mol L−1; 2-ABT / (10−7 mol L−1): (
The CD spectra of HSA exhibited two negative bands at about 208 and 218 nm in the ultraviolet region, which was characteristic for α-helix of proteins. 23 The amount of α-helix in the secondary structure of HSA after interaction with different concentrations of 2-ABT were calculated using Eqs. 6 and 7:
where CP is the molar concentration of the protein, n is the number of amino acid residues (585), and l is the path length of the cell (1 cm).
where MRE208 is the observed MRE value at 208 nm, 4000 is the MRE of the β-form and random coil conformation cross at 208 nm, and 33 000 is the MRE value of a pure α-helix at 208 nm.
At different molar ratios of HSA to 2-ABT (1 : 8 and 1 : 16), the α-helicity decreased from 56.02% in free HSA to 47.46% and 44.03%, respectively. These results suggested that 2-ABT combined with the amino acid residues of the main polypeptide chain of HSA, which might affect its physiological function.
As mentioned above, the binding of 2-ABT to HSA can induce obvious conformational changes in the secondary structure of HSA, changing the microenvironment of residues.
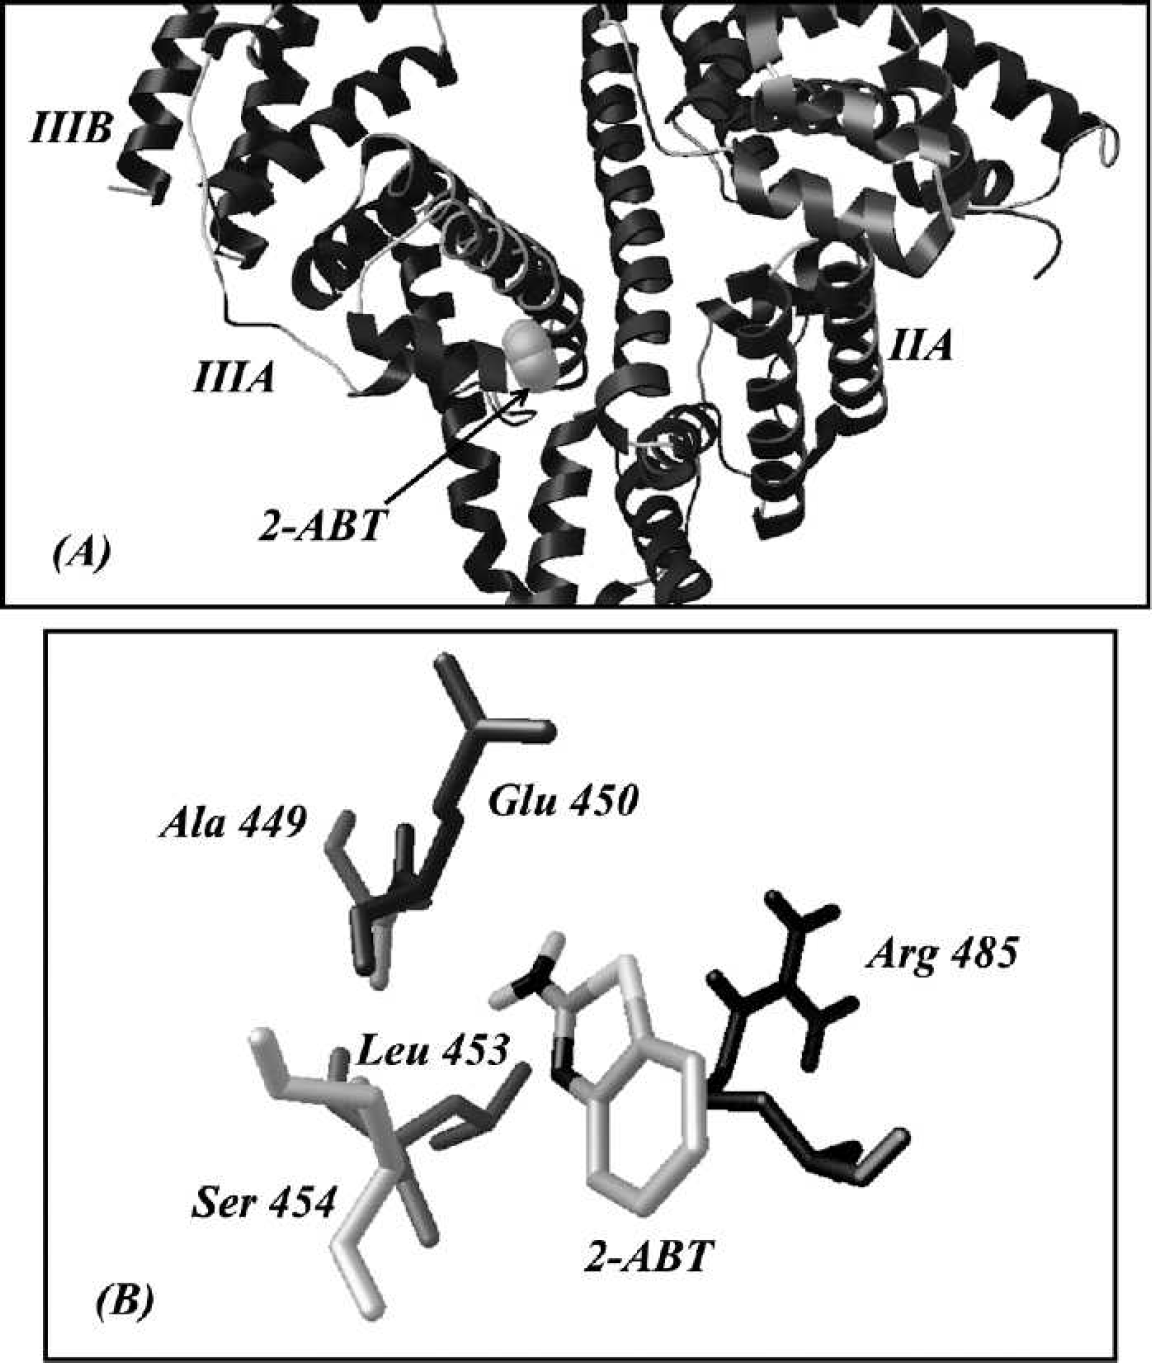
The binding mode between 2-ABT and HSA: (
The positively charged 2-ABT mainly interacted with the negatively charged residues through electrostatic force, coincident with the conclusion above. Five residues within 5 Å around 2-ABT were demonstrated in Fig. 9B. The acidic amino acid Glu 450 displayed electrostatic attraction to 2-ABT, with the result that 2-ABT turned towards it. This phenomenon was aggravated by Arg 485, which was positively charged.
CONCLUSIONS
In this article, we investigated the interaction between 2-ABT and HSA at the molecular level. The electrostatic interaction binding mode was indicated by the calculated thermodynamic parameters and the effect of ionic strength. The precise binding site was illustrated using molecular modeling on the basis of site-competitive replacement experiments. Furthermore, HSA conformation change verified the formation of the ABT-HSA complex, which may affect the normal function of the transport protein during the blood transportation process. These results contribute to evaluate the biotoxicity or side effects of 2-aminobenzothiazole derivatives, such as anti-inflammatories, herbicides, and antibiotics.
Footnotes
ACKNOWLEDGMENTS
The work is supported by NSFC (20875055). Ministry of Education of China (708058), and Key Science-Technology Project in Shandong Province (2008GG10006012) are also acknowledged.