






Abstract
The Hadamard transform spectral imager based on a digital micromirror device (DMD) is a novel type of spectral imager developed in recent years. This paper describes the designing scheme of the Hadamard encoding mask and analyzes the encoding process of the detector pixels. Generally the Hadamard encoding mask constructed by DMD cannot completely encode the dispersed spectrum of all the pixels according to the Hadamard matrix; therefore, the spectral images recovered by inverse Hadamard transform inevitably have errors. A correction method for the recovered spectral images is proposed. The experimental results show that this method improves the quality of the recovered spectral images.
Keywords
INTRODUCTION
The Hadamard transformation is a known type of optical multiplex technique that distinguishes itself by the enhancement of the signal-to-noise ratio (SNR) for the reconstructed signals. 1 Interest in Hadamard transform spectroscopy has been limited due to the inability to perform accurate high-order masking in a reasonable amount of time. However, this technique has progressed in the past decade with improvements in encoding mask technology.2,–6 More recent advances in digital micro-mirror array (DMA) technology and the commercial availability of the Texas Instruments Digital Micro-mirror Device™ (DMD™) in particular have promoted the development of Hadamard transform techniques once again, and many scholars have done a lot of research work in utilizing the DMA as a spatial light modulator (SLM) for generating a stationary Hadamard encoding mask.7,–16 The Hadamard transform spectral imager (HTSI) based on DMD does not require macroscopic moving parts to provide spectral multiplexing capability, so it can be built in a robust, small-volume, and lightweight package. 1 However, the Hadamard encoding mask generated by DMD usually cannot guarantee the dispersed spectrum of every pixel of the input image to be encoded perfectly based on the Hadamard matrix. This paper describes this phenomenon and proposes a correction method for the recovered spectral images.
INSTRUMENT CONCEPT
The principles of operation of our HTSI based on DMD are illustrated in Fig. 1. The instrument consists of two gratings and a DMD placed in the intermediate focal plane between them. The first grating disperses the image into spectral components and images them onto the DMD. The DMD spectrally encodes the image by modulating the intensity of selected spectral bands in the dispersed image. The encoded image is then spectrally recombined by the second grating and imaged onto a photodetector.
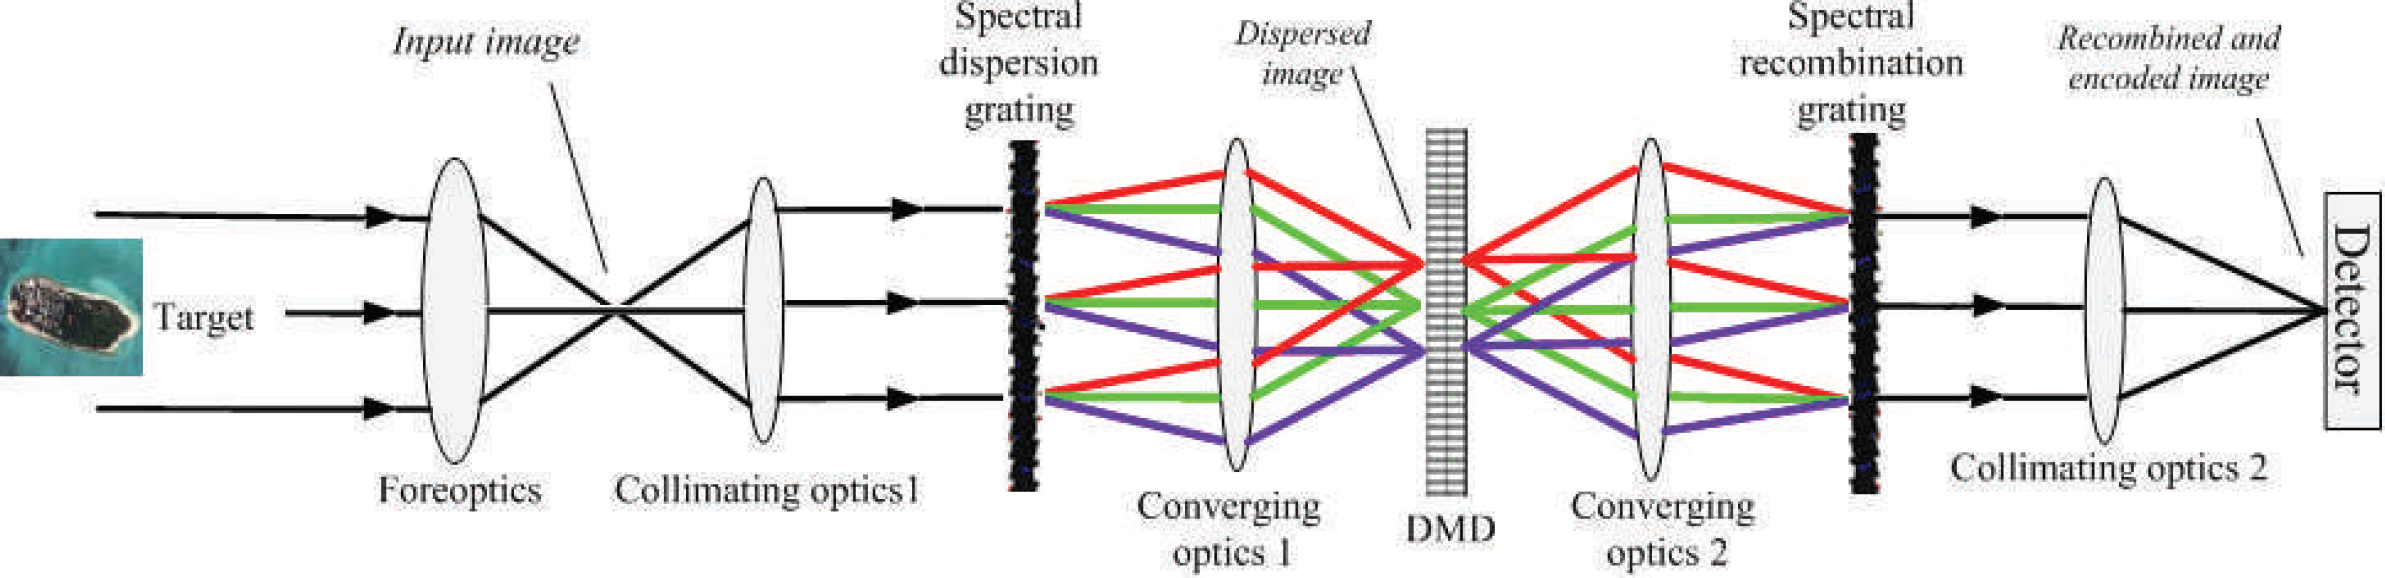
The schematic diagram of the ray path for our engineering HTSI.
Spectral encoding is achieved by transmission and rejection of particular bands. This operation is accomplished with the programmable digitally controlled DMD. The DMD is programmed to generate a dynamic series of spatial patterns that perform the transform functions. Spectral encoding of this sort can be seen as equivalent to applying a Hadamard transform to the spectrally resolved image. 7 The encoded images acquired from the detector are decoded by the inverse Hadamard transform (IHT) to provide the spectrum for each individual pixel.
HADAMARD ENCODING MASK AND THE EXISTENT PROBLEM
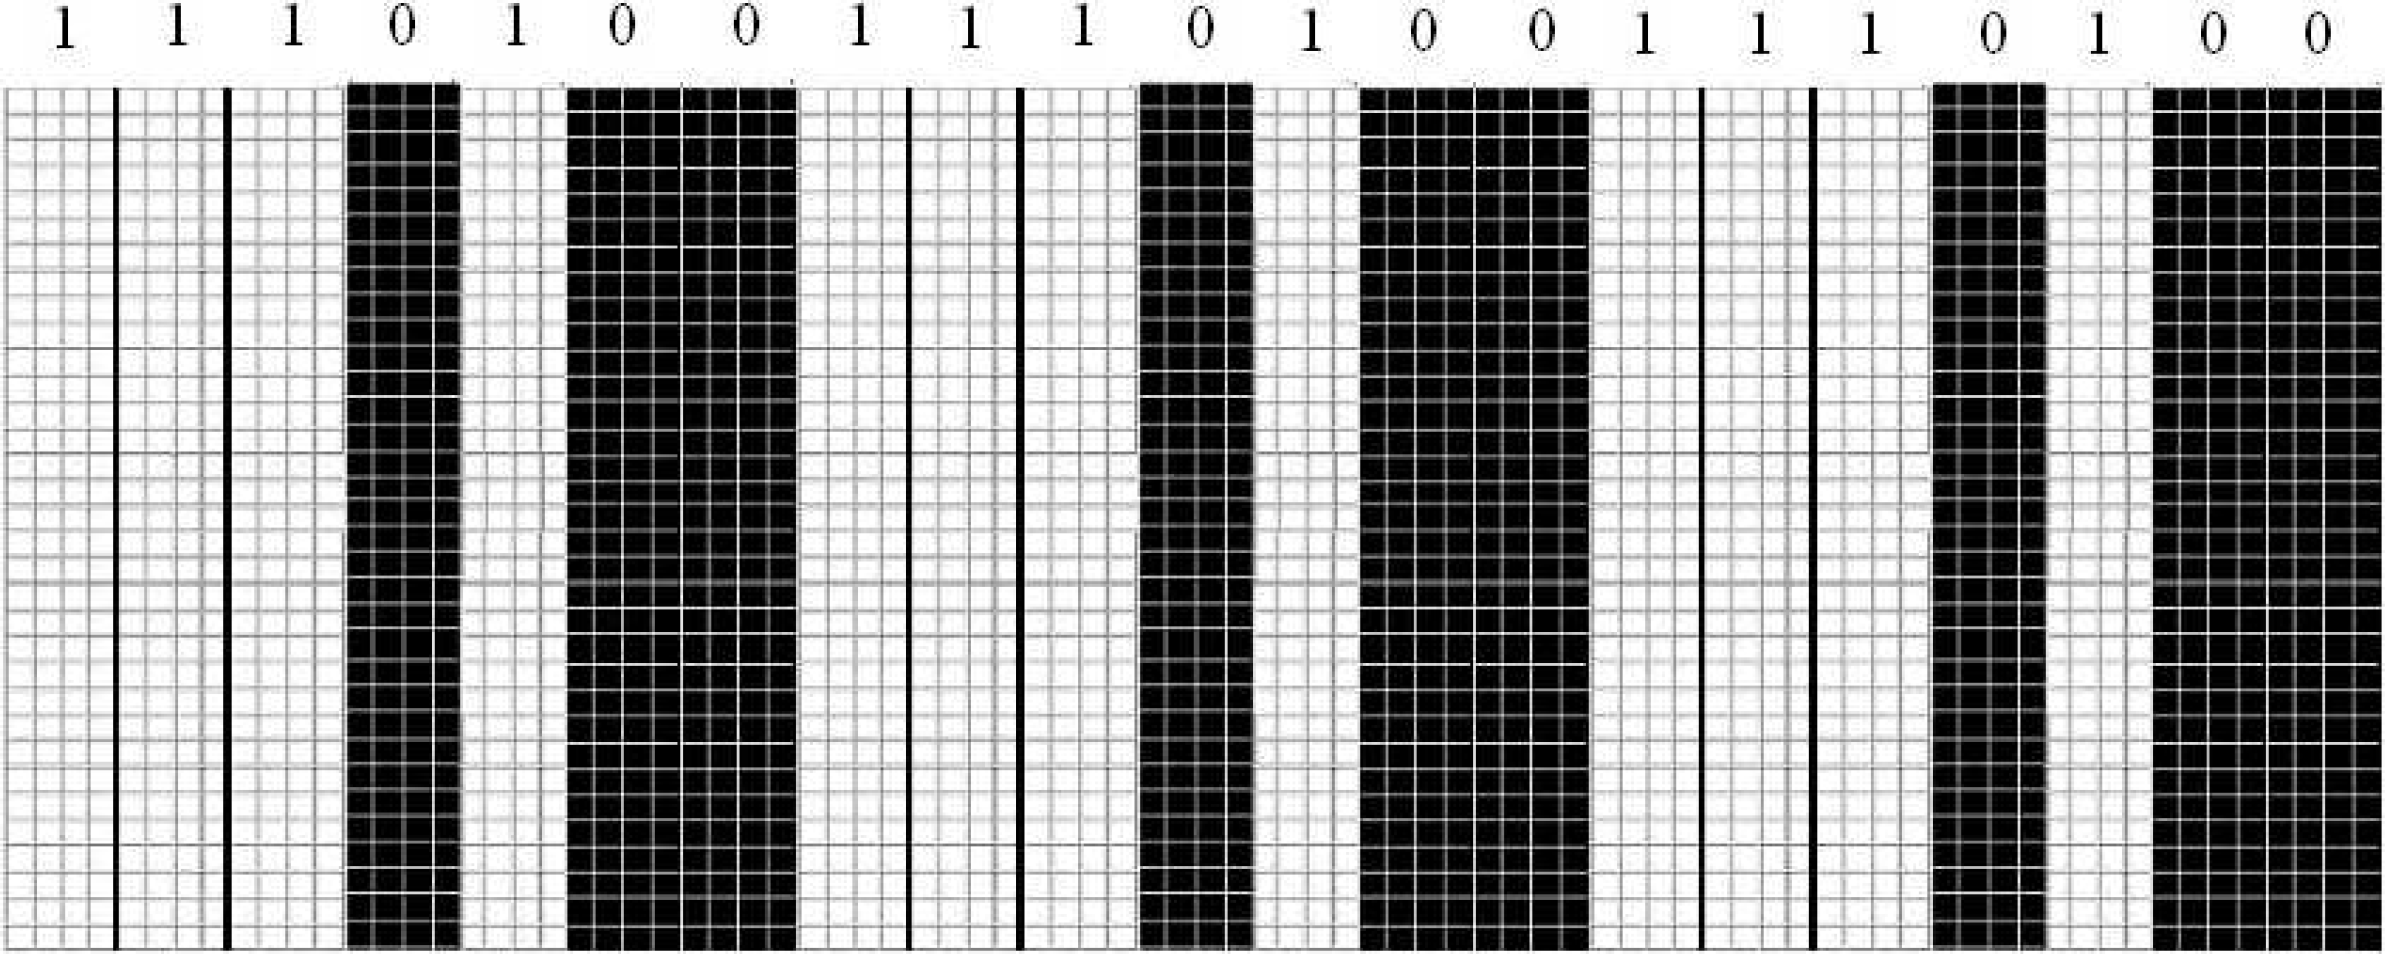
Hadamard encoding mask constructed based on the 7-order cyclic
Calculating the width of the each encoding channel is the key to constructing the encoding mask. Now we discuss how to determine the column numbers of micro-mirrors for each encoding channel.
Assuming the response range of the HTSI is λ1 * λ2 and the corresponding geometrical width to the dispersed spectrum on the mask of every pixel of the input image is l, to encode the dispersed spectrum of every pixel based on the Hadamard matrix, we ensure that the width of l is completely divided into seven even elements by the encoding channels. Therefore, the width of each encoding channel is designed to be l/7. Then we can calculate the column numbers of the micro-mirrors corresponding to the width l/7 for each encoding channel and construct the Hadamard encoding mask by the programmed setting of the DMD micro-mirrors.
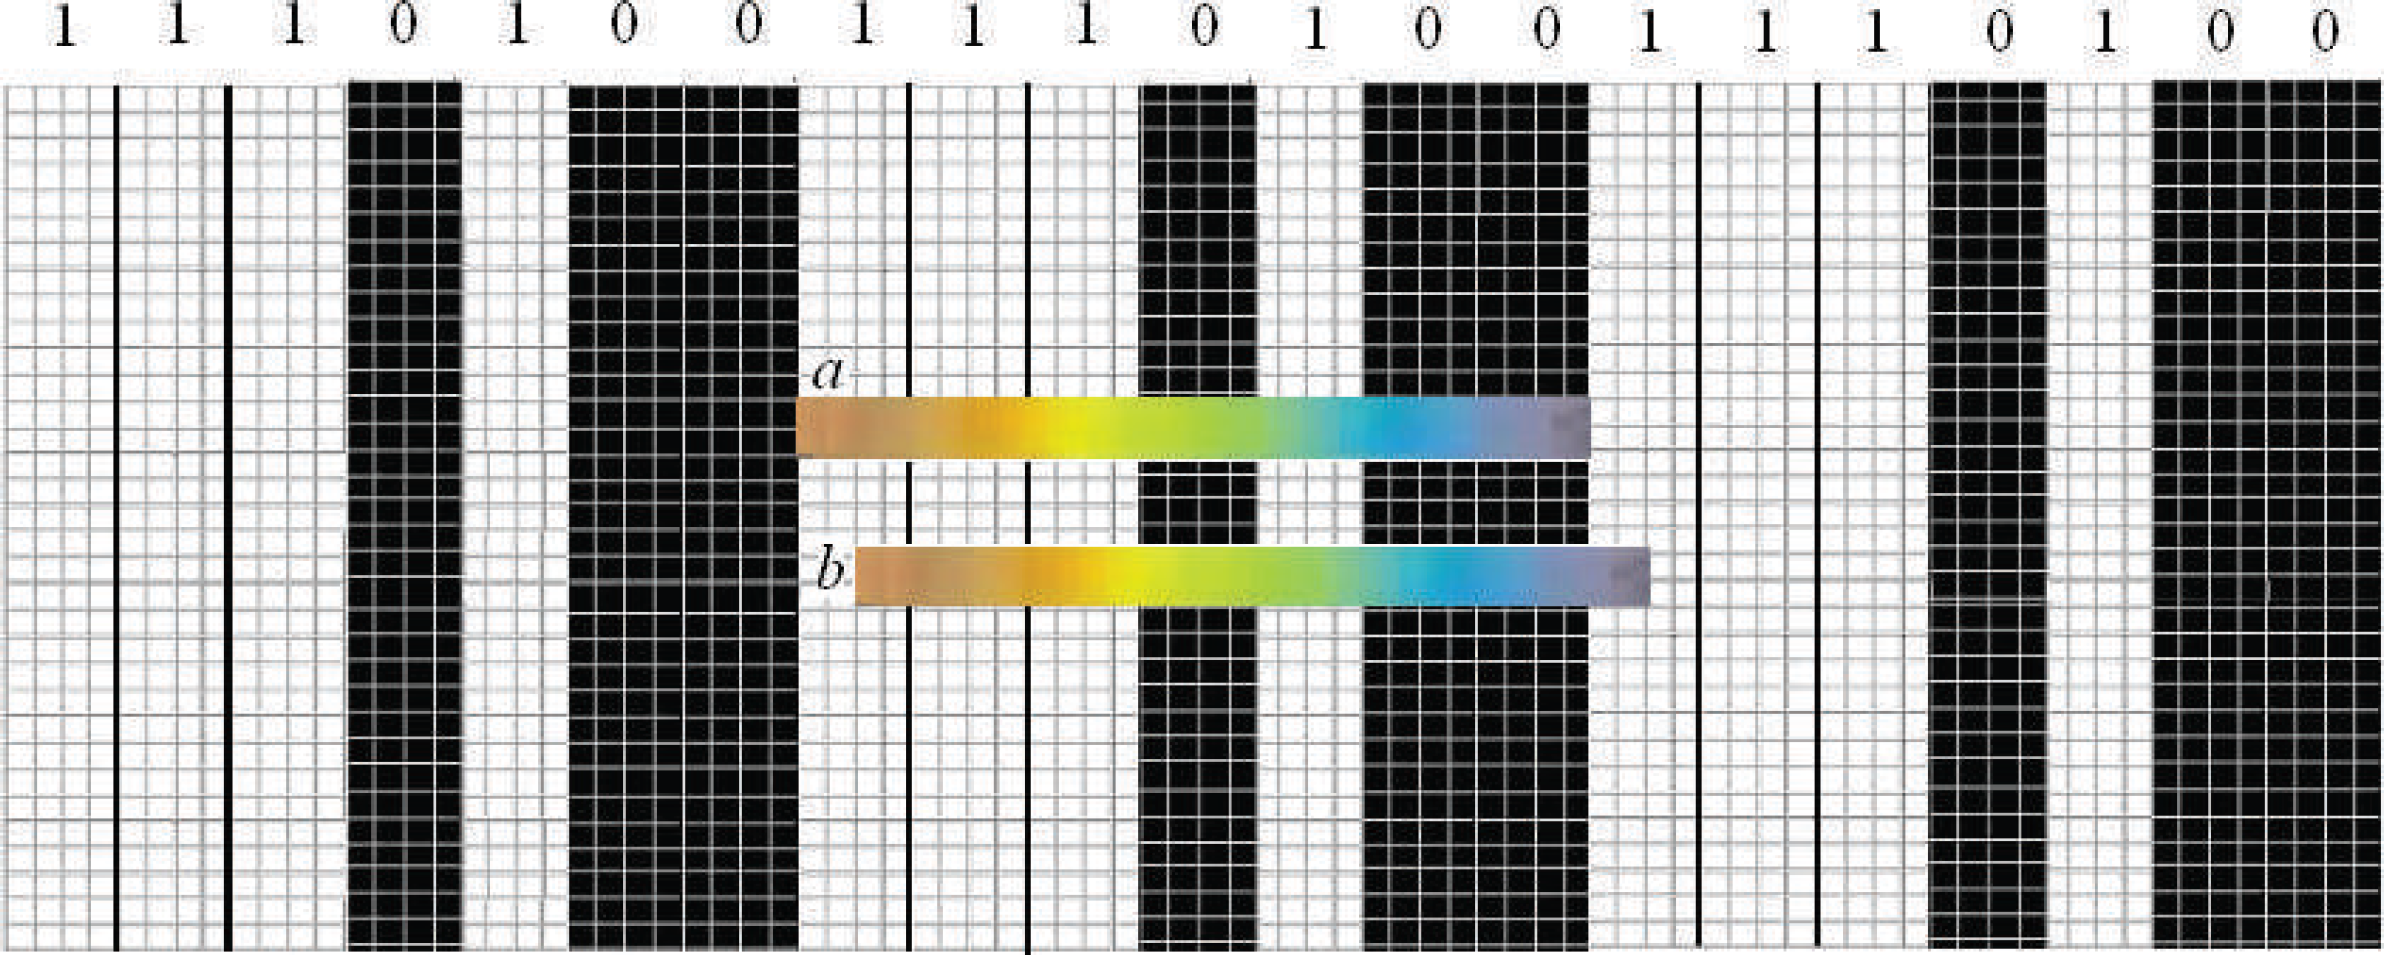
The dispersed spectrum of two pixels in different positions.
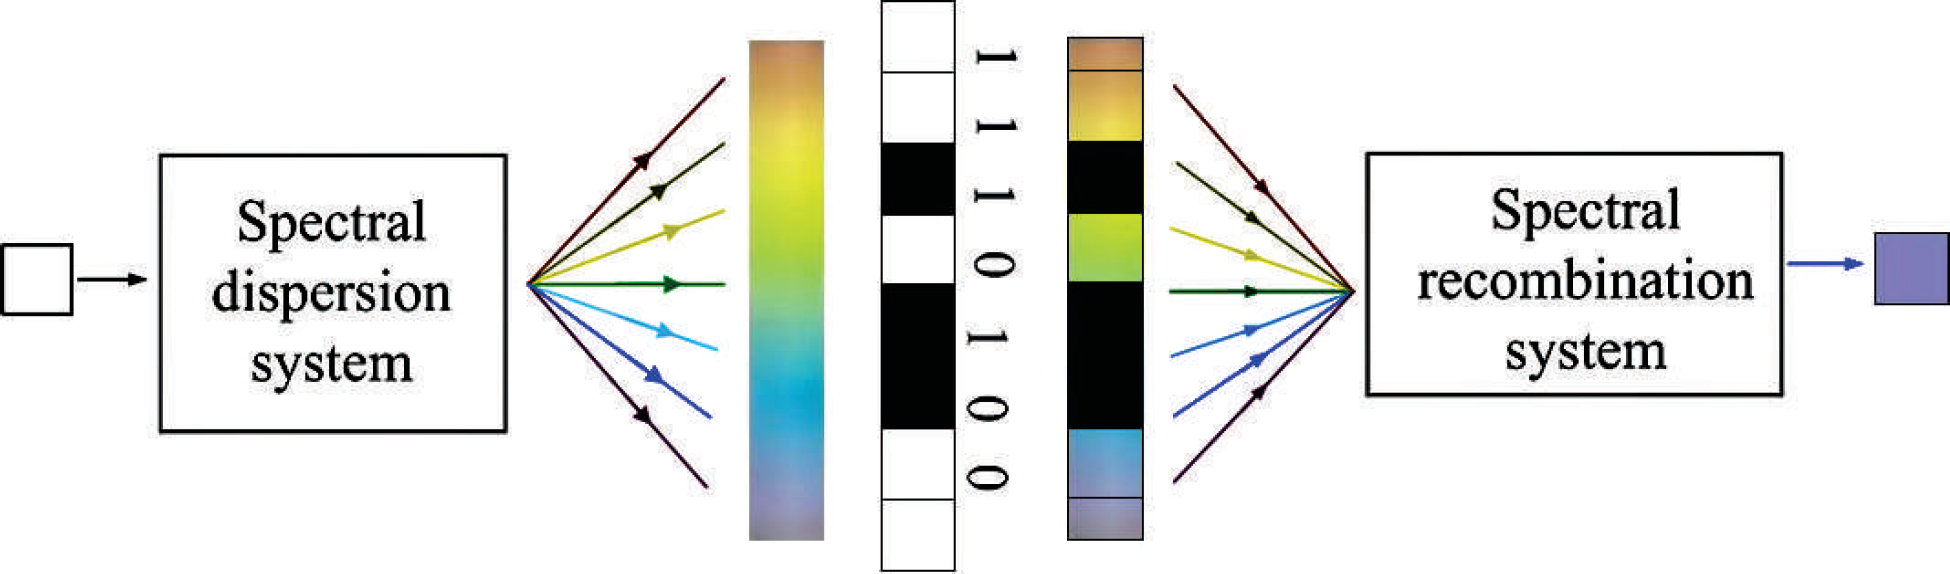
The encoding and re-imaging process for the dispersed spectrum of a pixel encoded into 8 elements.
THE IMPROVED DESIGN OF THE HADAMARD ENCODING MASK
Cyclic Encoding of the Detector Pixels. In fact, the encoding process of the detector pixels changes circularly in space. In Fig. 5, the green solid lines are used to distinguish different encoding regions on the detector; all the pixels in the same region encode based on the same matrix, while different regions encode based on different
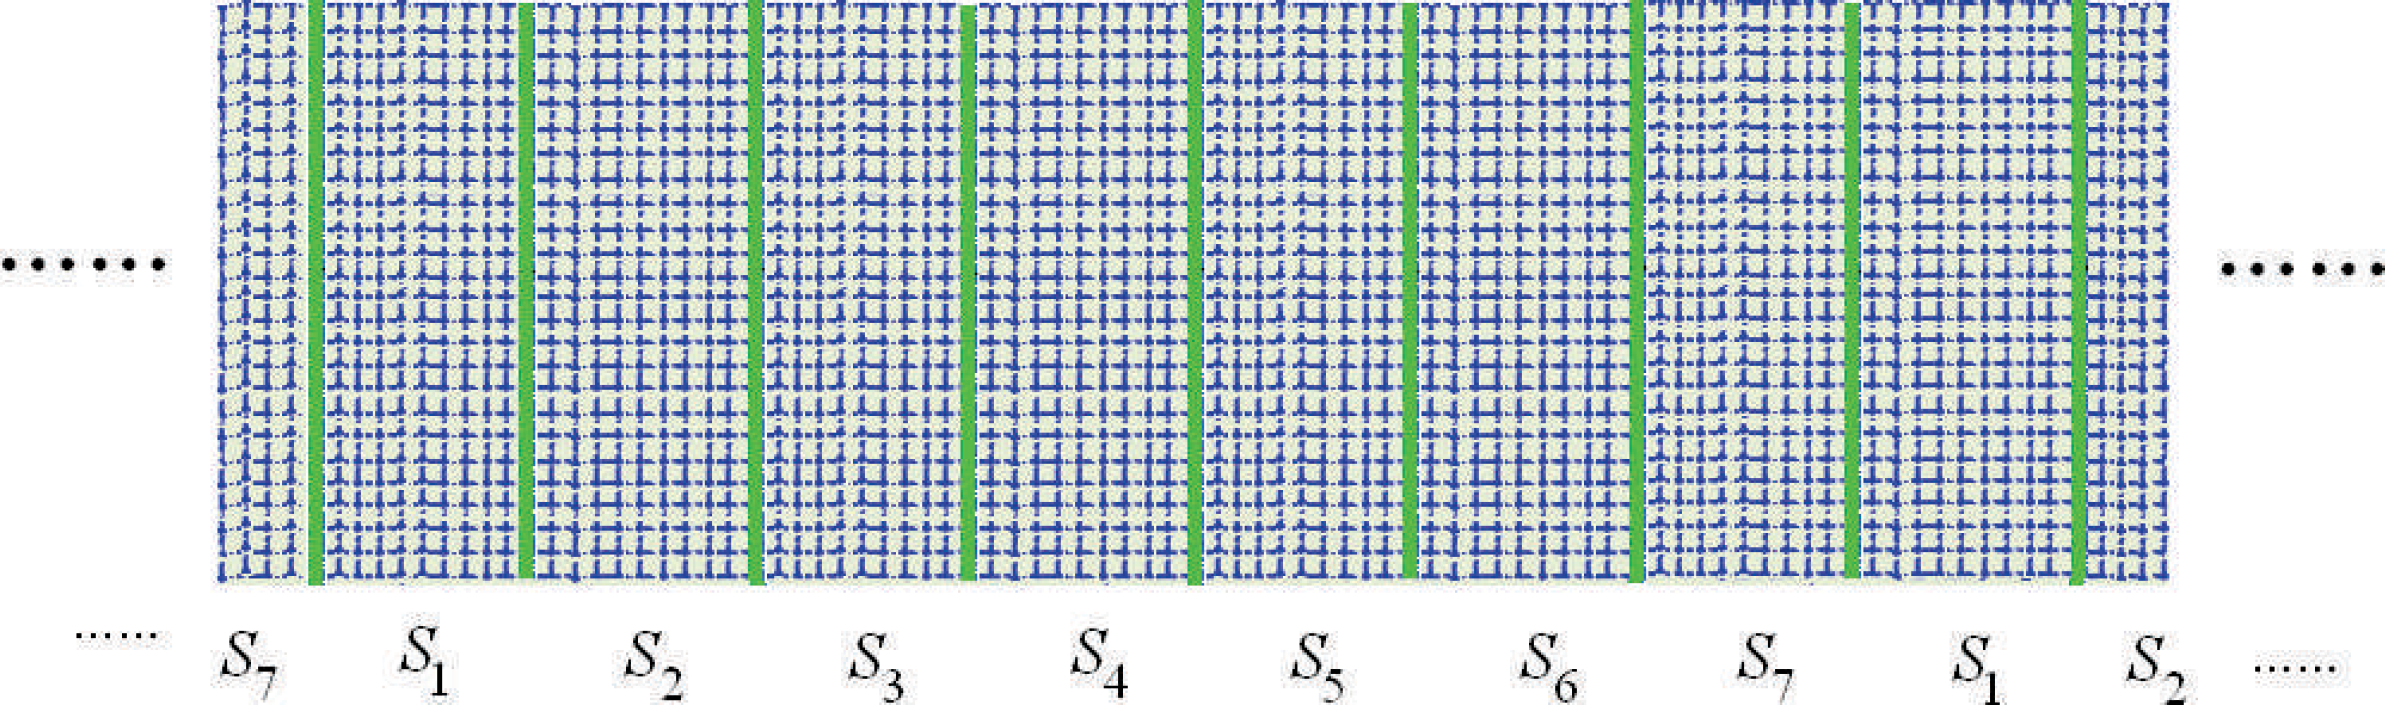
The distribution of the cyclic encoding region for the detector pixels. The detector pixels in different regions encode based on different
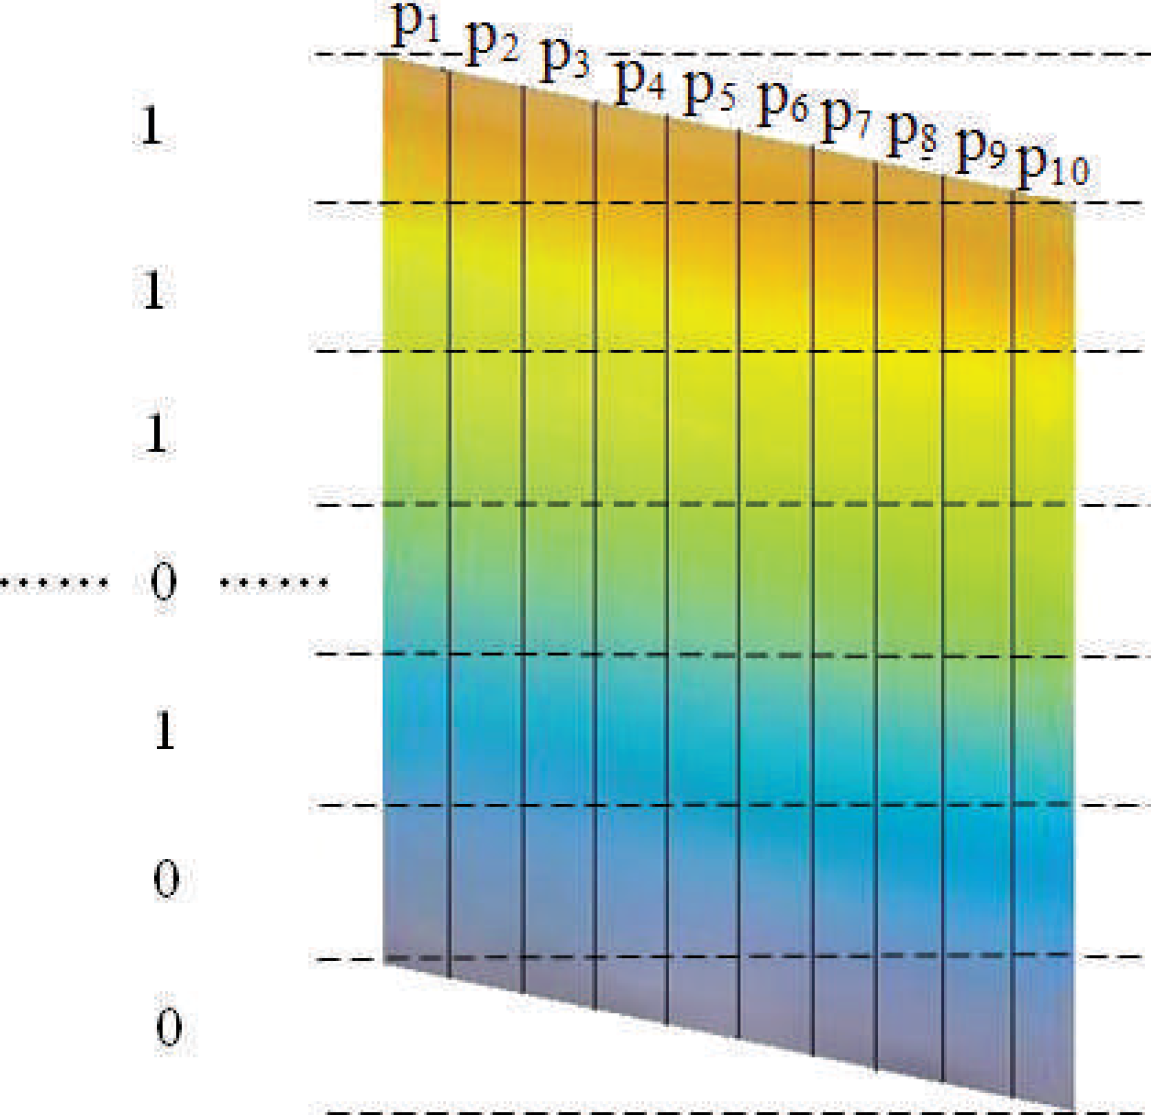
The encoded dispersed spectrum based on 6-order encoding mask. All the dispersed spectrum are encoded into 7 spectral elements.
As can be seen from Fig. 6, although the dispersed spectrum of the pixels p1 * p10 are encoded into seven elements, the spectral elements with the same serial number have different wavelength ranges. There is spectral offset between the spectral elements with the same serial number. As a result, the spectral images recovered by IHT cannot accurately reflect the spectral information of a specified wavelength range.
If we let the HTSI operate based on a higher-order S-matrix, the spectral images with high spectral resolution can be obtained by IHT. Then we can merge several hyperspectral images with the adjacent wavelength range into one spectral image to obtain the multispectral images with smaller spectral offset. However, this approach is rough and theoretical errors still exist.
CORRECTION OF THE RECOVERED SPECTRAL IMAGES
The width of each encoding channel in our HTSI is designed to be l/7. The process of encoding a row of detector pixels in a cyclic encoding region is shown in Fig. 7. We extract the pixel p6 in this region as a sample to study. Its dispersed spectrum is encoded into eight spectral elements. The first spectral element and the eighth spectral element always have the same encoding state (“0” or “1”). These two spectral elements will be merged into the first spectral element in spectrum recovery. Therefore, we still obtain seven recovered spectral elements by IHT for p6. Obviously it is unreasonable and the recovered spectral images need correction.
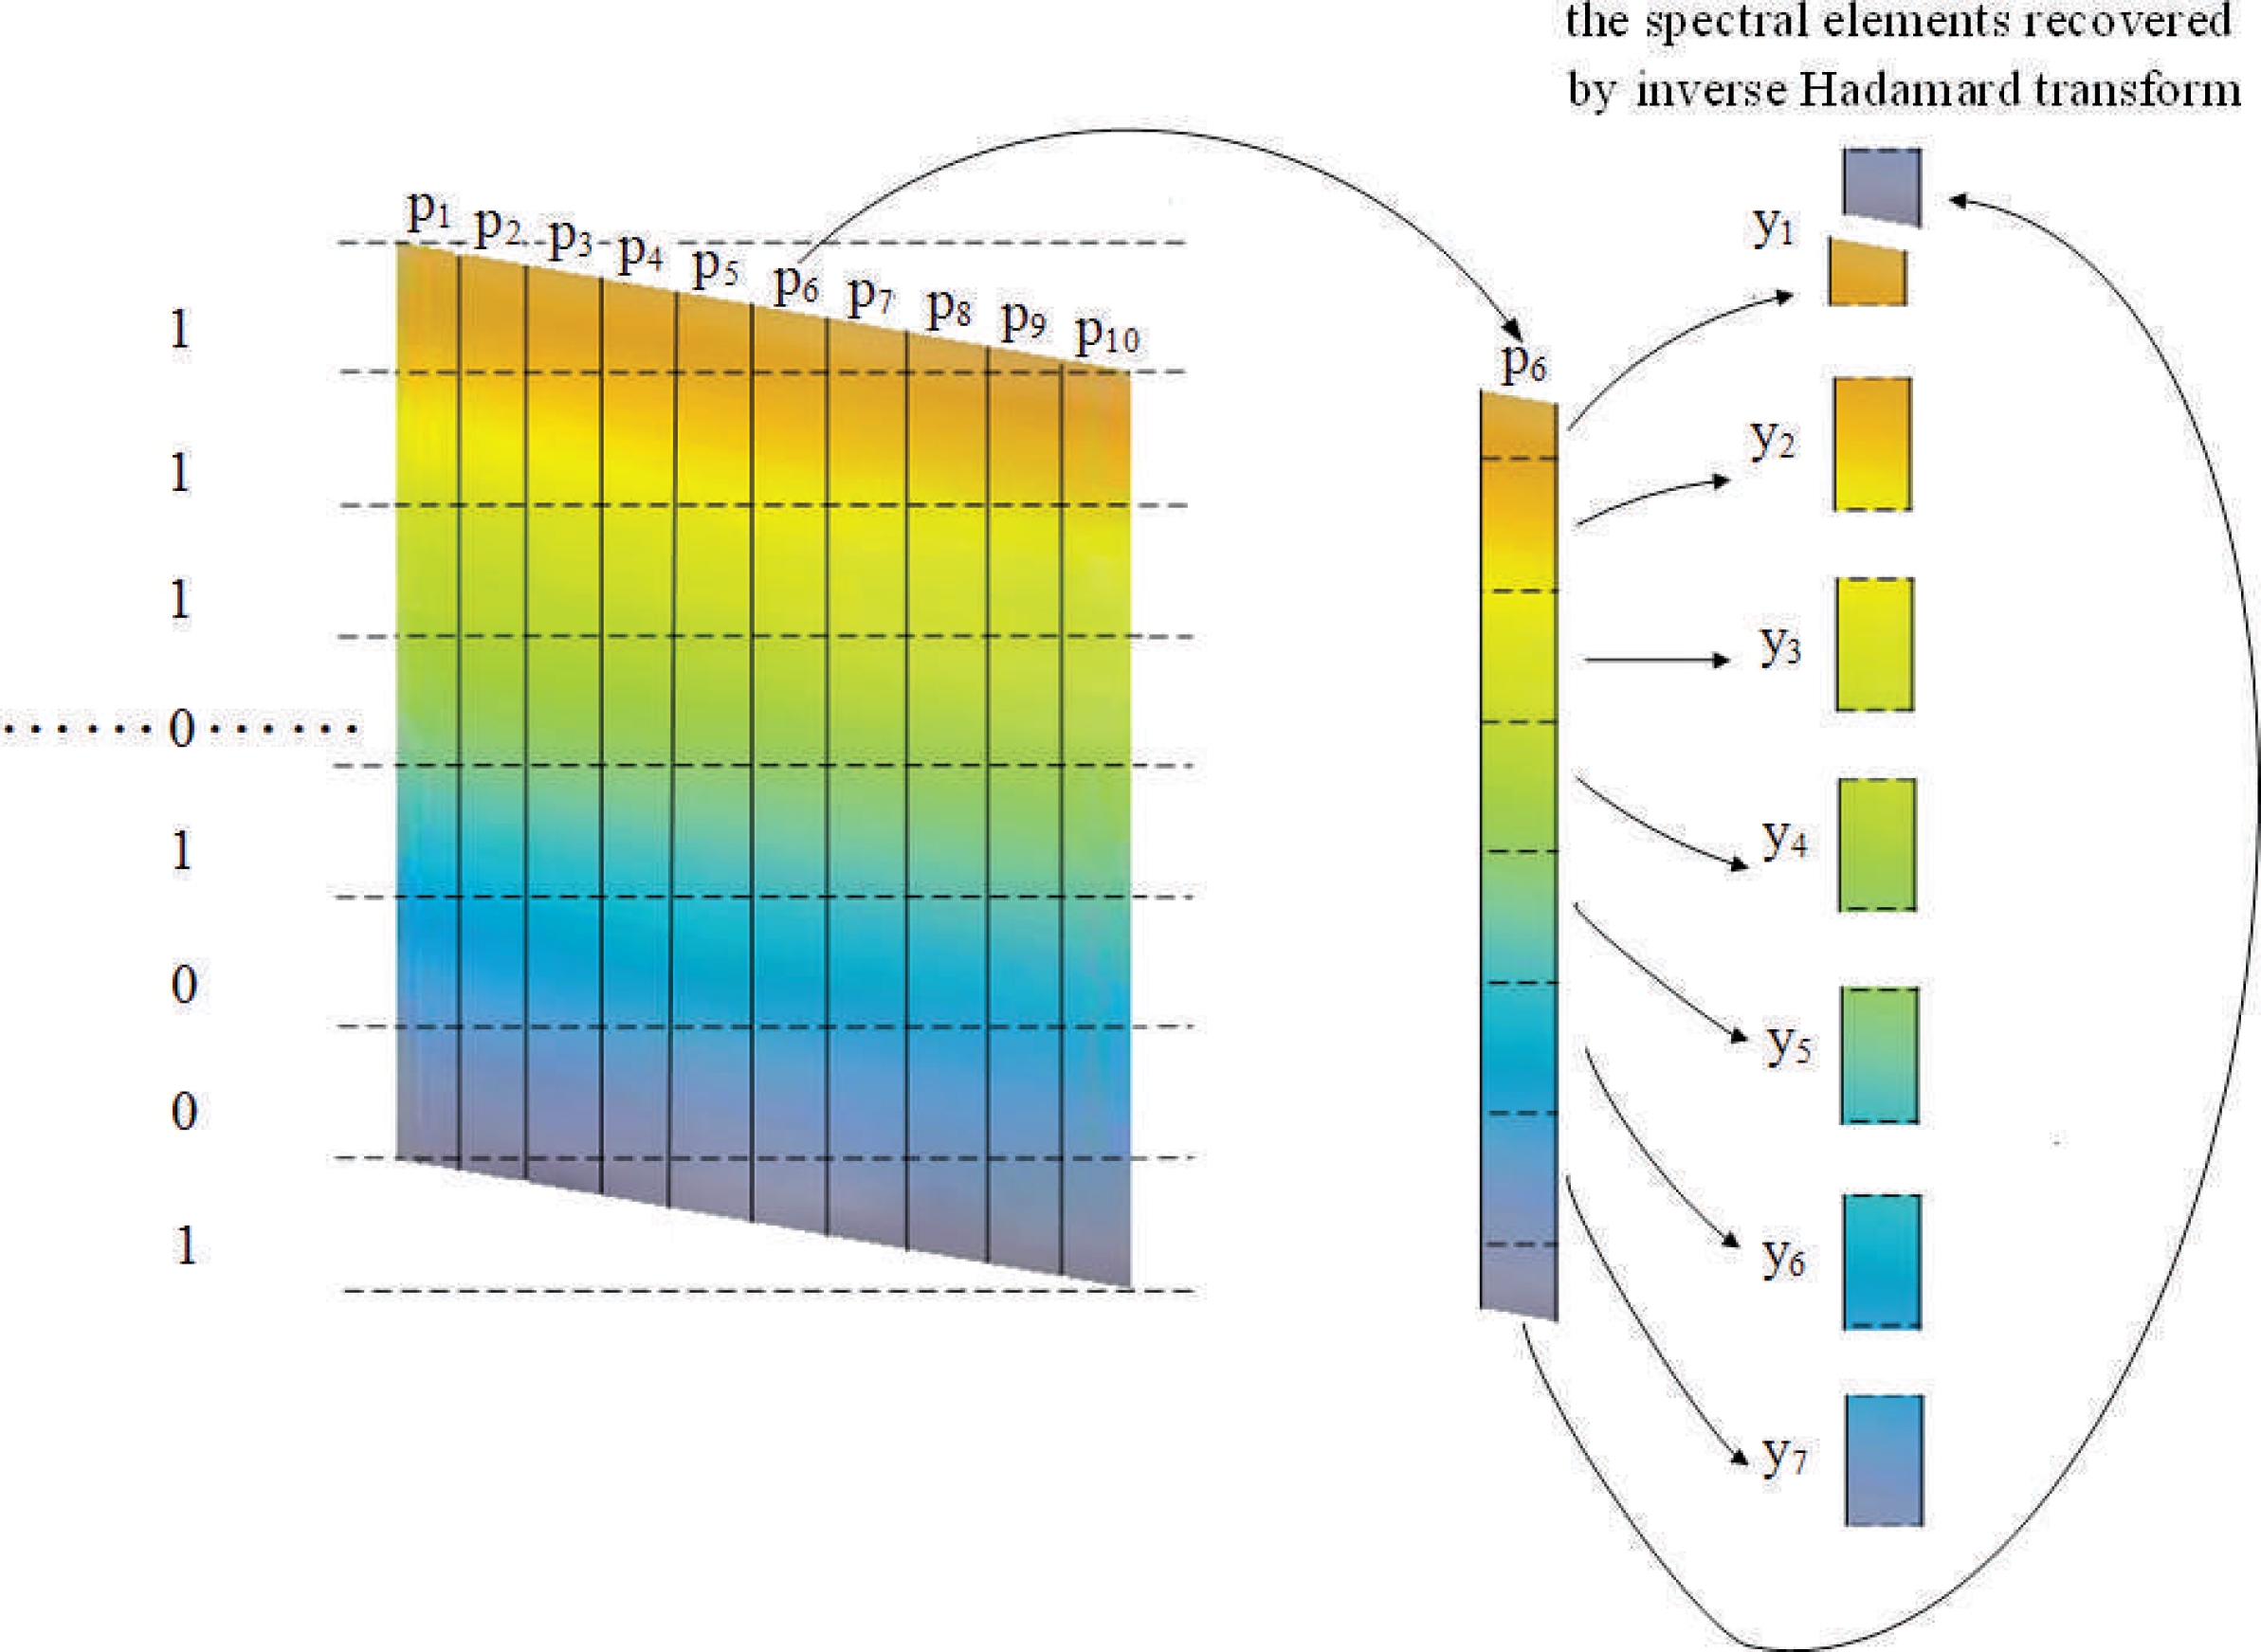
The encoding and the decoding process of the dispersed spectrum based on the 7-order encoding mask.
Figure 8 shows the corresponding relationship between the eight actual encoded spectral elements and the ideal seven spectral elements of the pixel p6.
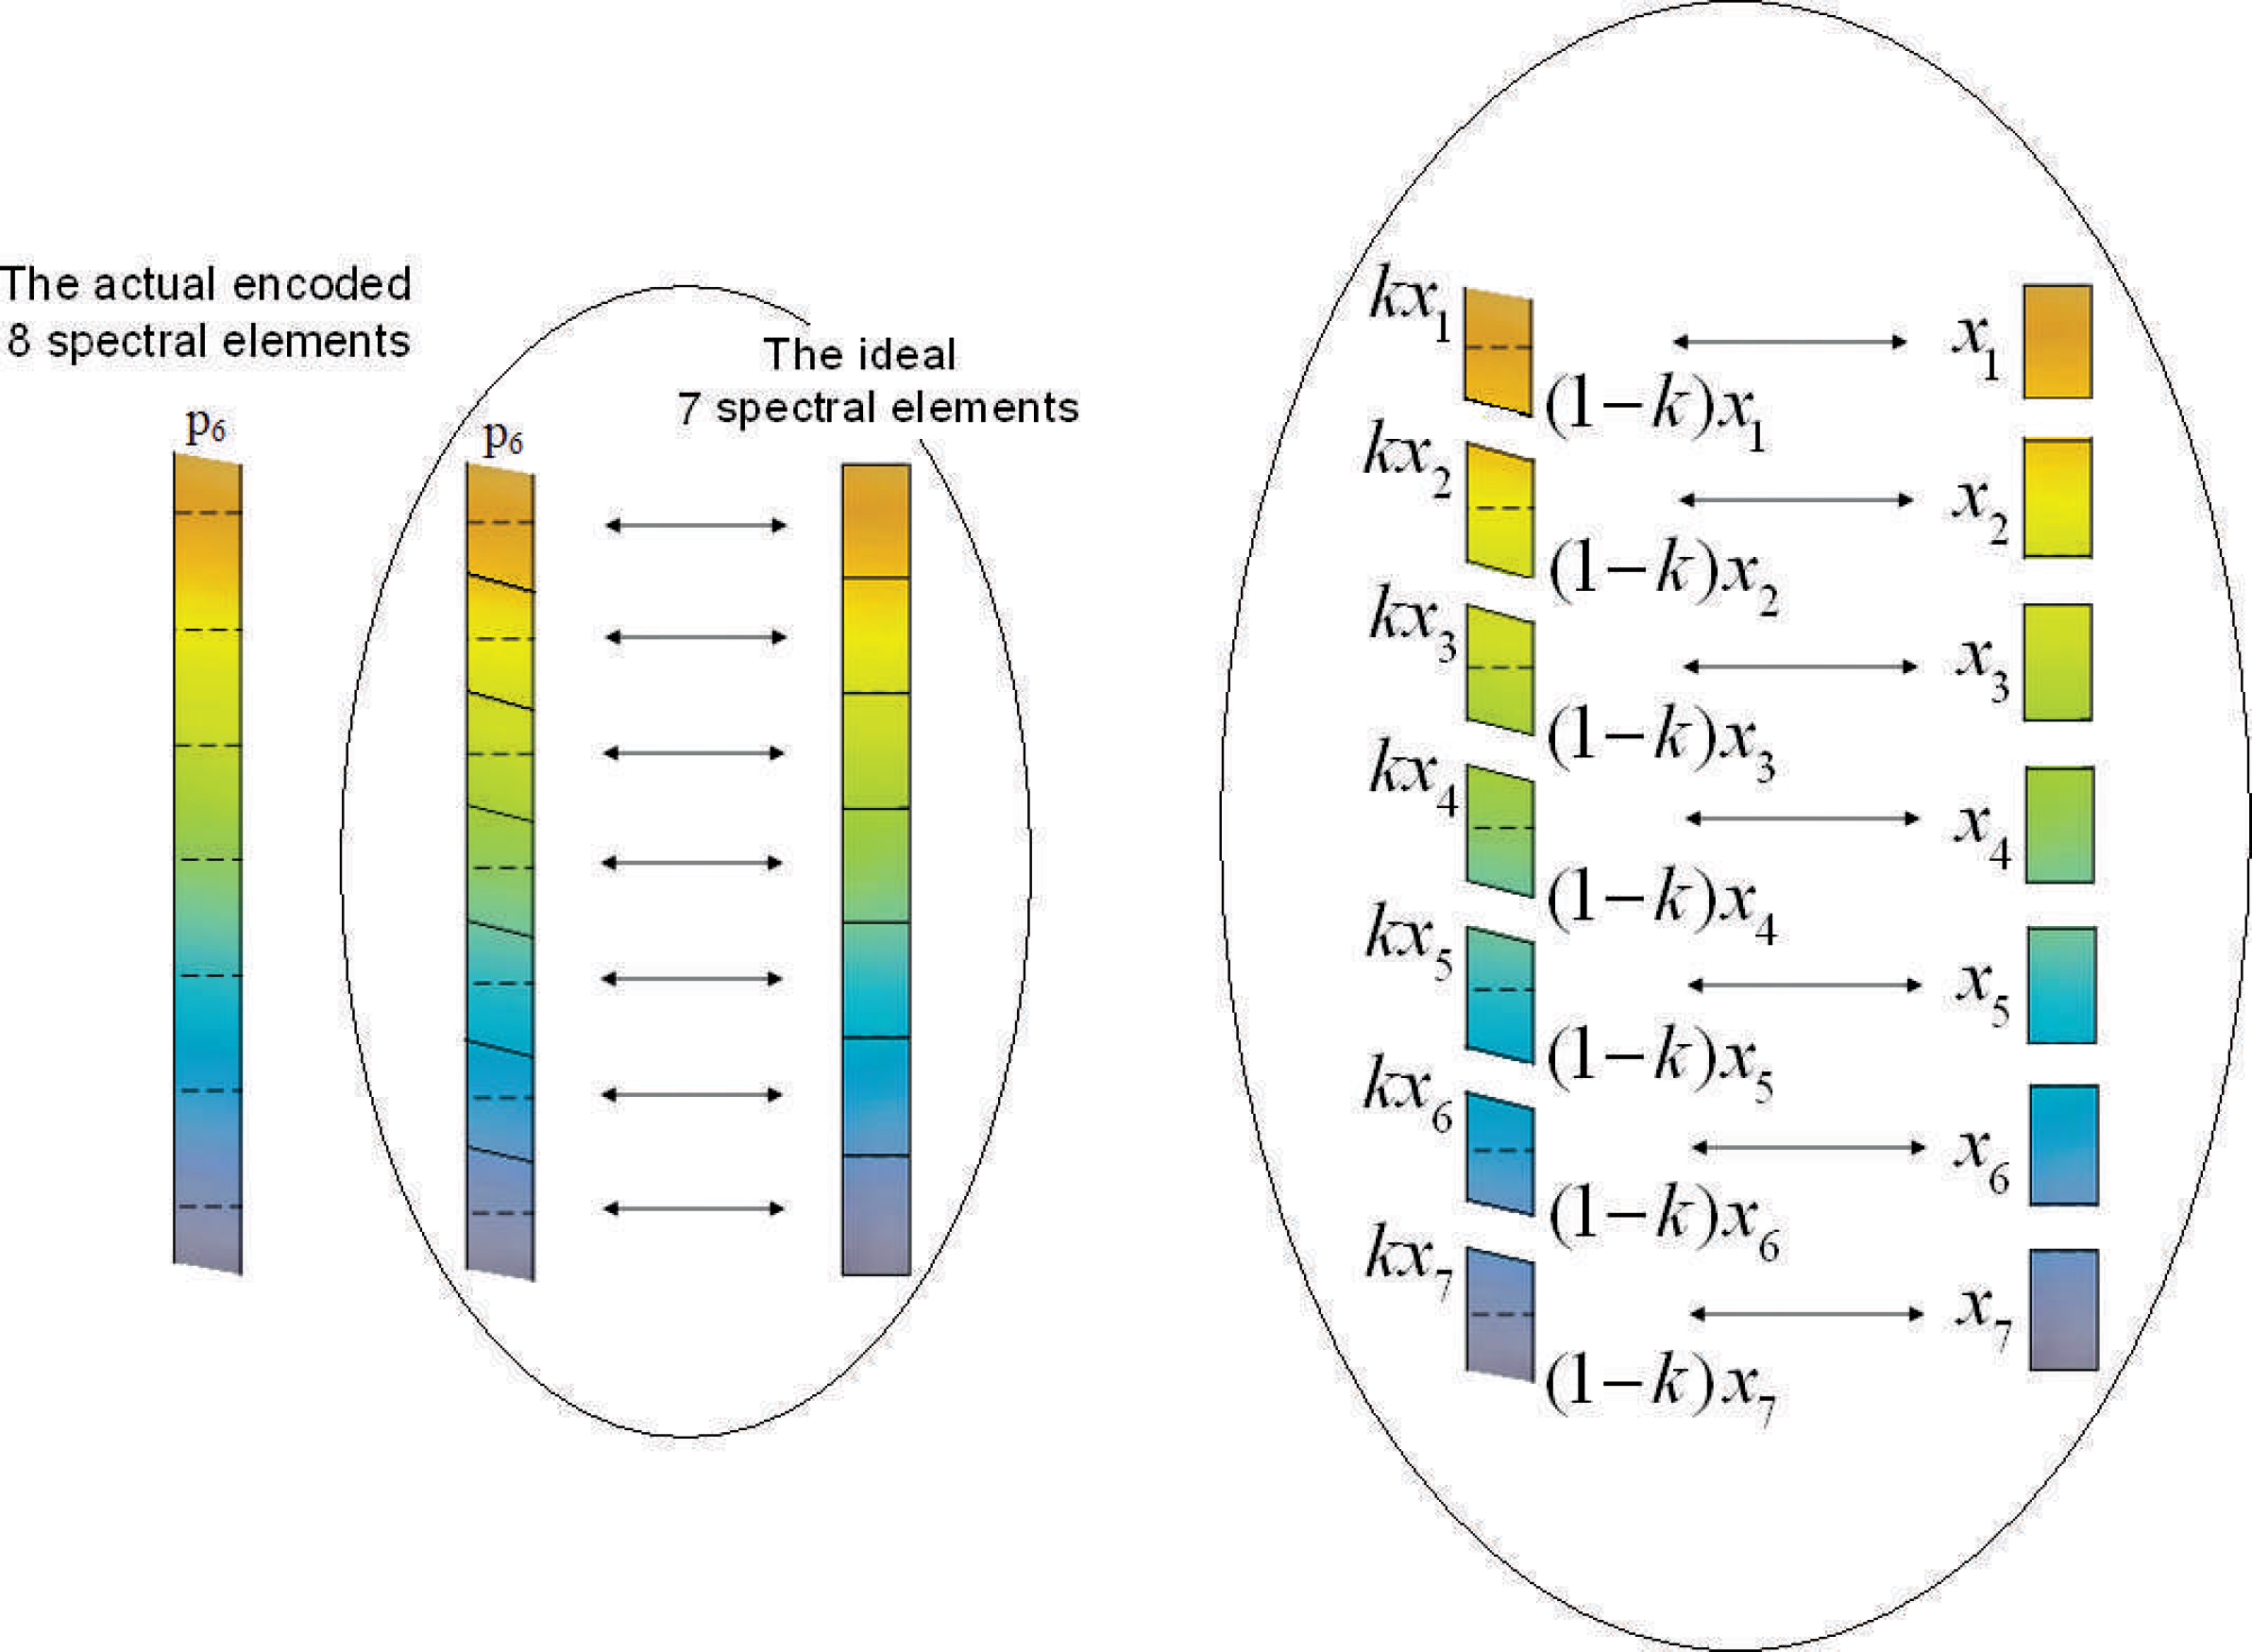
The corresponding relationship between the actual dispersed spectrum encoded into 8 elements and the ideal 7 spectral elements.
If we use y1, y2, y3, y4, y5, y6, and y7 to denote the actual recovered spectral elements, and x1, x2, x3, x4, x5, x6, and x7 for the ideal seven spectral elements, then the following equation is established based on Fig. 8.
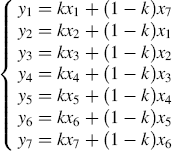
where k is a correcting coefficient of less than 1, written in matrix form:
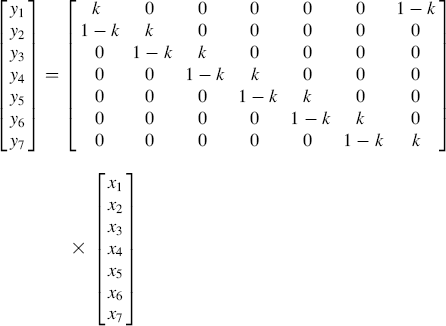
Now we discuss how to obtain the correction coefficient for the detector pixels in one of the cyclic encoding regions.
If the ten pixels p1 * p10 lie in a small region with well-proportioned hue on the panchromatic image, then they should have the same spectrum. We can take these ten pixels as the training samples to obtain the correction coefficients.
Figure 7 shows that the pixel p1 and the pixel p10 are at the edges of a cyclic encoding region. Their encoding errors are very small and they are almost encoded into seven spectral elements. Therefore, we can decode these two pixels by IHT directly to obtain its seven spectral elements with small errors. To reduce the errors further, we average the two recovered spectral vectors of these two pixels as the ideal spectrum of the ten pixels.
If we substitute the gray values of the obtained seven ideal spectral elements into the column vector [x1 x2 x3 x4 x5 x6 x7]T of Eq. 2 and substitute the gray values of the actual recovered spectral elements of p2 * p9 obtained by IHT into the column vector [y1 y2 y3 y4 y5 y6 y7]T, respectively, then all the correcting coefficients for p2 * p9 can be solved approximately using the least square method with ease.
Because the encoding process of the detector pixels changes circularly in space, to obtain the correction coefficients of all the pixels, we only need to evaluate the correction coefficients of the detector pixels in one of the cyclic encoding regions rather than one by one. The recovered spectral images can be corrected through Eq. 2 after the correction coefficients are obtained.
EXPERIMENT
First we use our HTSI to record seven encoded images of a butterfly model. The panchromatic image and the encoded images are shown in Fig. 9. From the region with the well-proportioned hue on the panchromatic images, we extract ten pixels in a cyclic encoding region as the samples to train the correction coefficients.
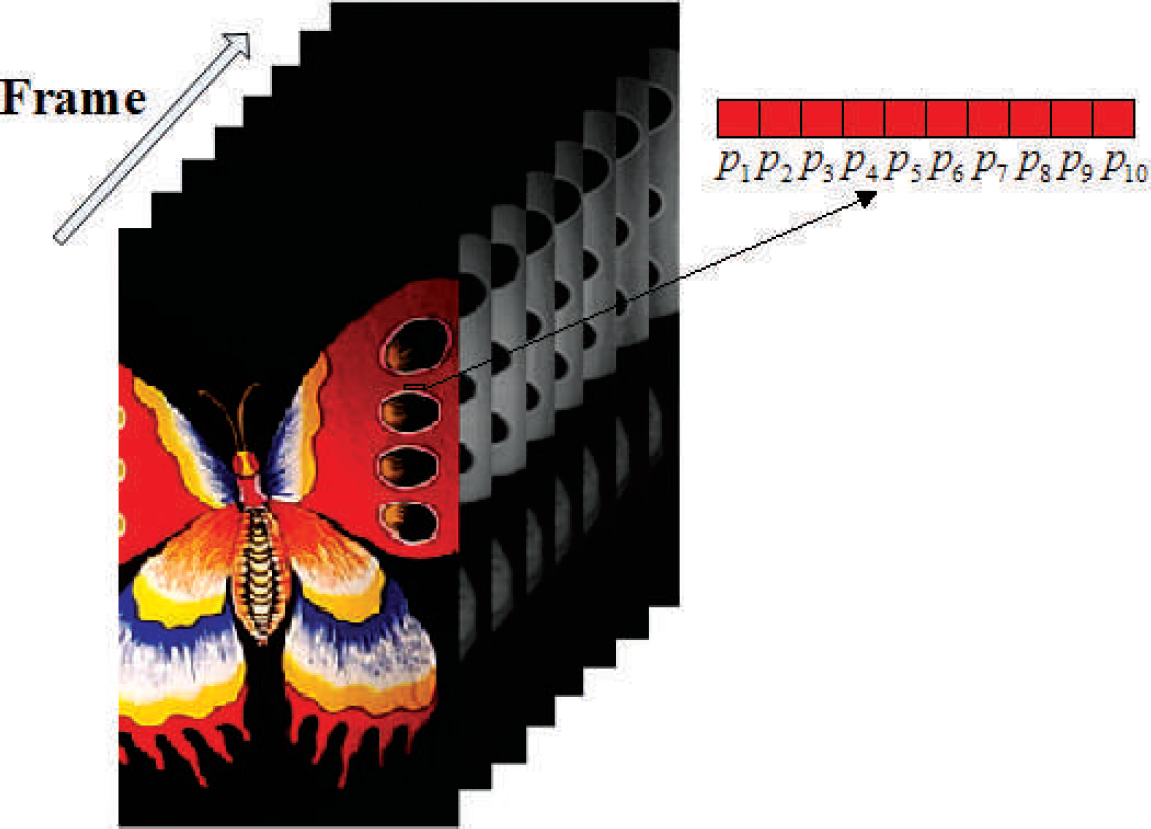
The panchromatic image and the seven encoded images of the butterfly model.
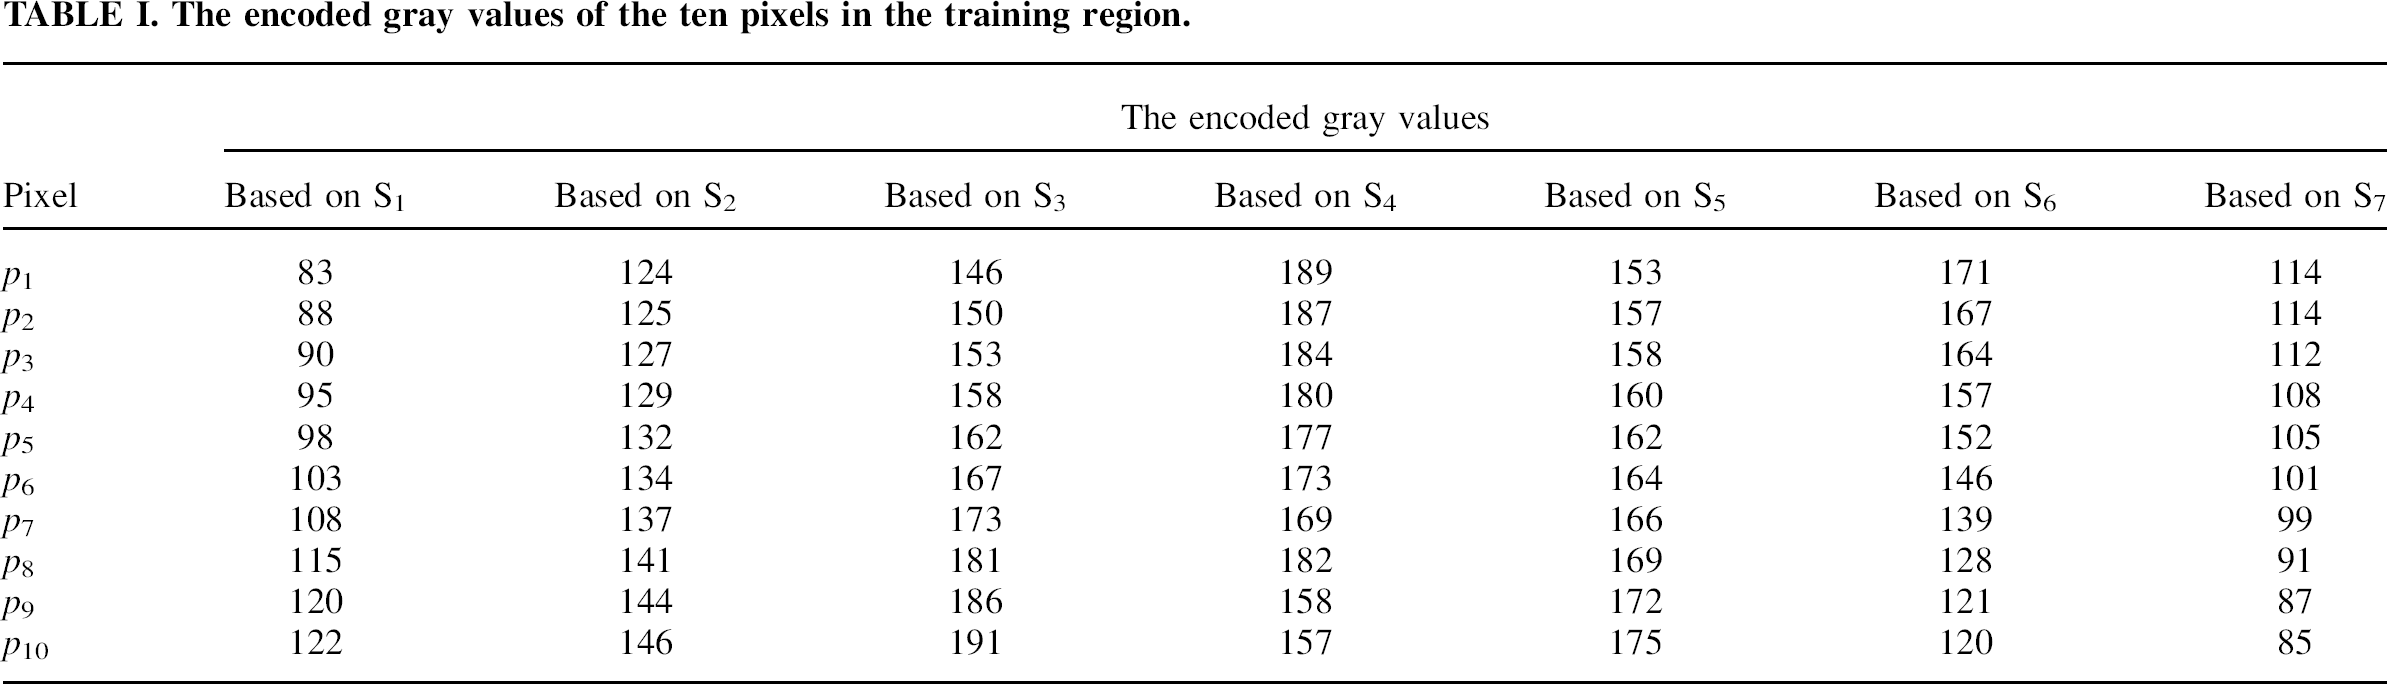
The encoded gray values of the ten pixels in the training region are shown in Table I. The gray values of the ten pixels recovered directly by IHT are shown in Table II.
The encoded gray values of the ten pixels in the training region.
The gray values of the ten pixels recovered by IHT in the training region.
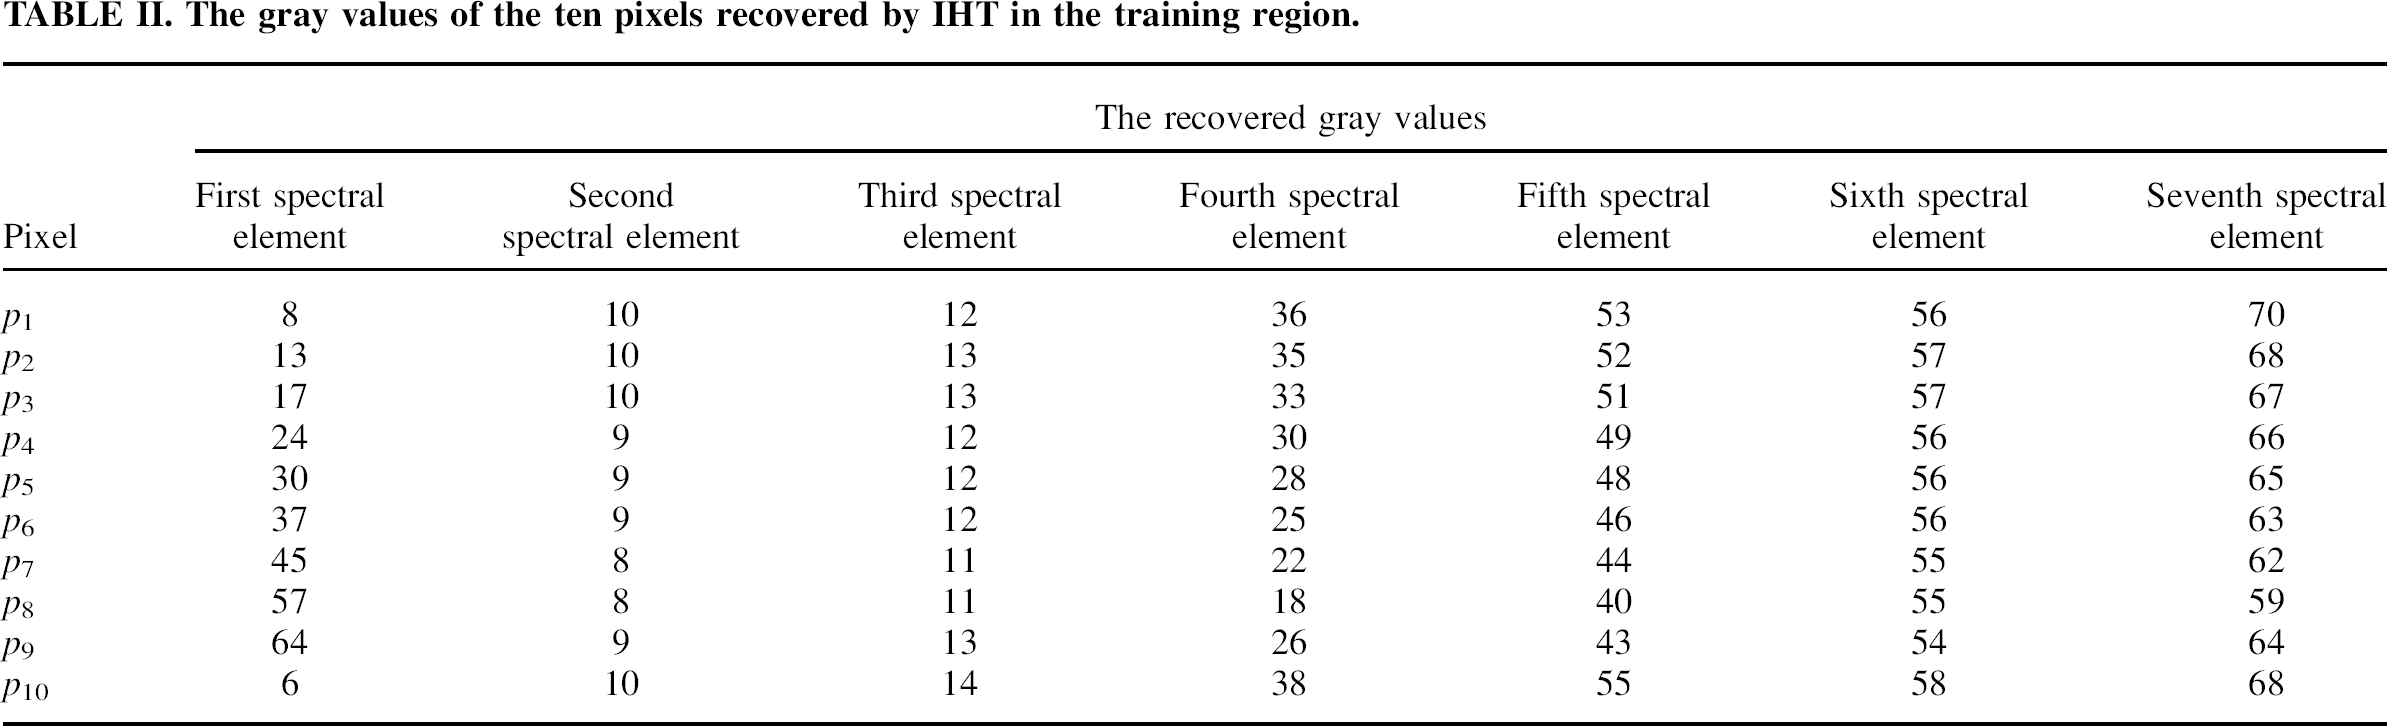
The ideal spectral vector is obtained by averaging the recovered spectral elements of p1 and p10 in Table II with ease. We substitute this ideal spectral vector [7 10 13 37 54 57 69]T into the column vector [x1 x2 x3 x4 x5 x6 x7]T of Eq. 2 and substitute the recovered spectral vectors of p2 * p9 in Table II into the column vector [y1 y2 y3 y4 y 5 y6 y7]T, respectively. The correcting coefficients of the pixel p2 * p9 can be solved approximately by the least squares method. They are 0.90, 0.84, 0.72, 0.63, 0.52, 0.39, 0.20, and 0.08.
Now we use these obtained coefficients to correct another group of recovered spectral images recorded by our HTSI.
In Fig. 10, M and N are two testing pixels. Their coefficients are evaluated with the above-mentioned method beforehand. The correction coefficient of M is 0.39, and the correction coefficient of N is 0.84. We extract the spectrograms of the two testing points with the spectrometer FieldSpec® HandHeld (Analytical Spectral Devices, U.S.) and show them in Fig. 10. The spectral response range of our HTSI is 500 nm * 710 nm, so the wavelength range of the seven spectral elements is 550 nm * 530 nm, 530 nm * 560 nm, 560 nm * 590 nm, 590 nm * 620 nm, 620 nm * 650 nm, 650 nm * 680 nm, and 680 nm * 710 nm, respectively. For M and N, we integrate the intensity of the seven spectral elements among their wavelength range and obtain seven discrete values. The seven discrete values are connected to form spectral curves as the benchmark and are also shown in Fig. 10.
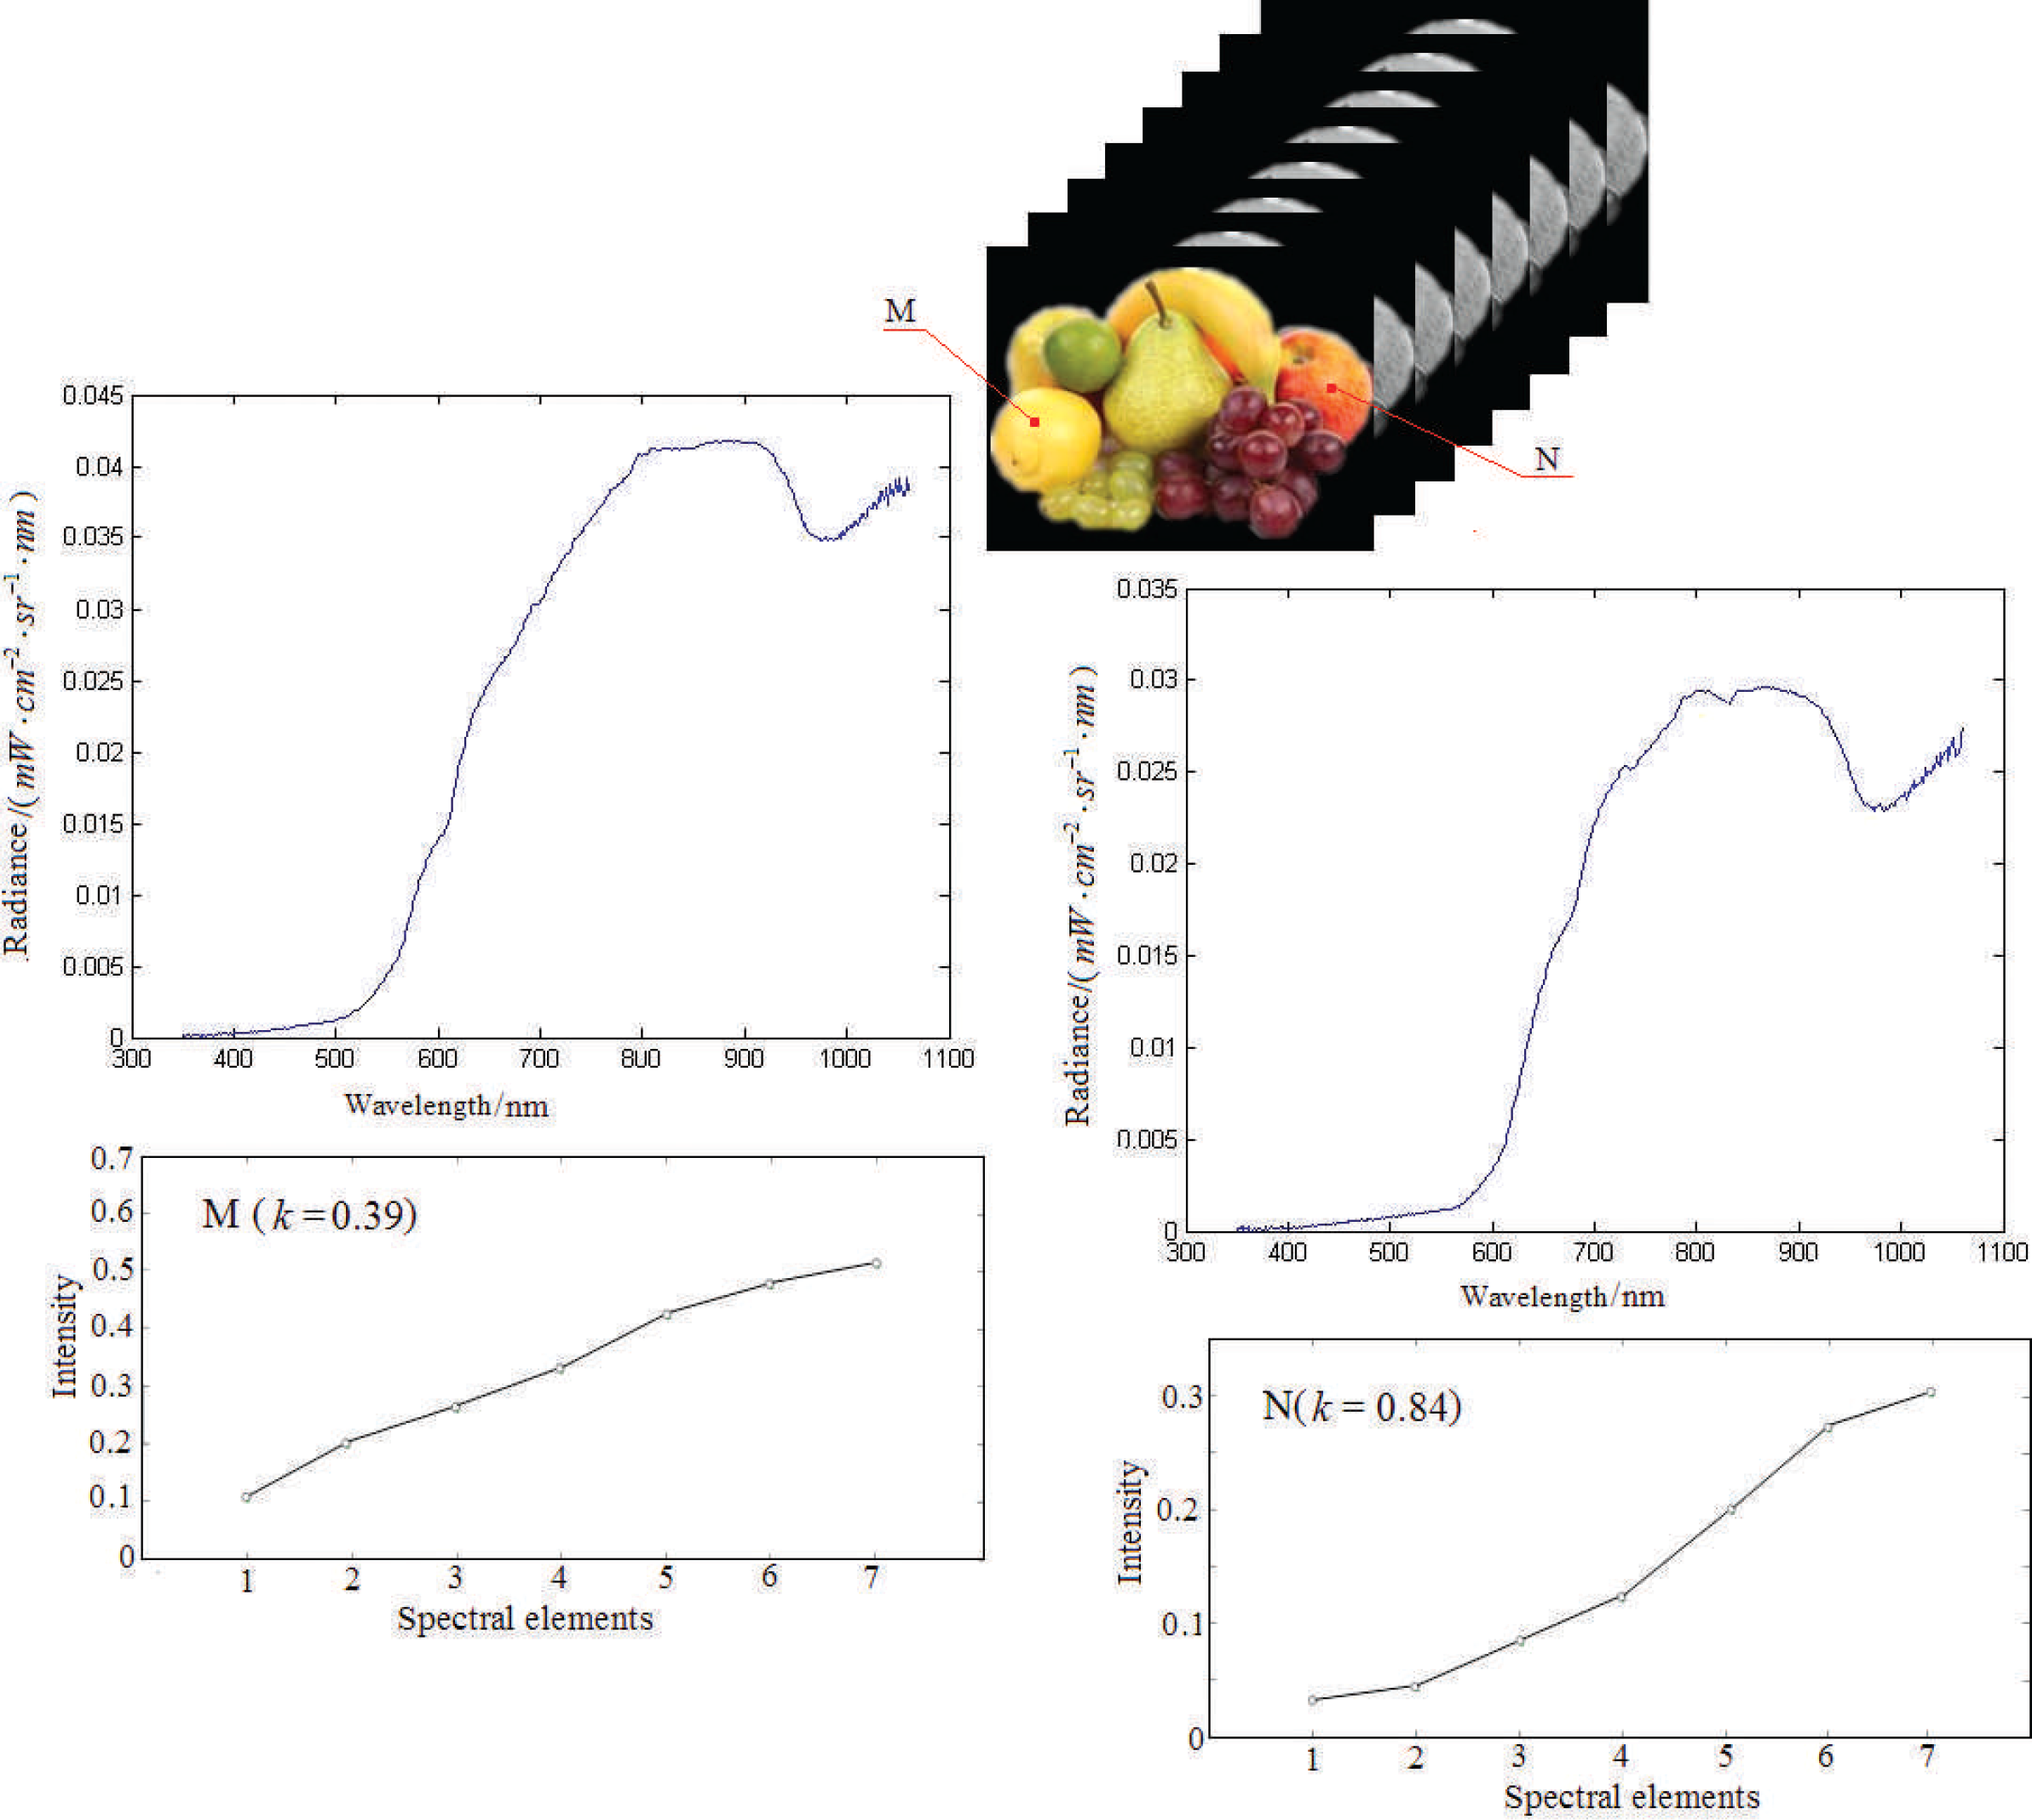
The spectrum of the two testing points extracted by radiation meter and the spectral curves obtained after integration.
We decode the seven spectral elements of M and N by IHT directly and use the dashed line to denote the obtained spectral curves in Fig. 11. Substituting the spectral vectors obtained by IHT in the previous step and the correction coefficients of the two testing points into Eq. 2, respectively, we can obtain the corrected spectral vectors, and the corrected curves are denoted by the solid lines in Fig. 11.
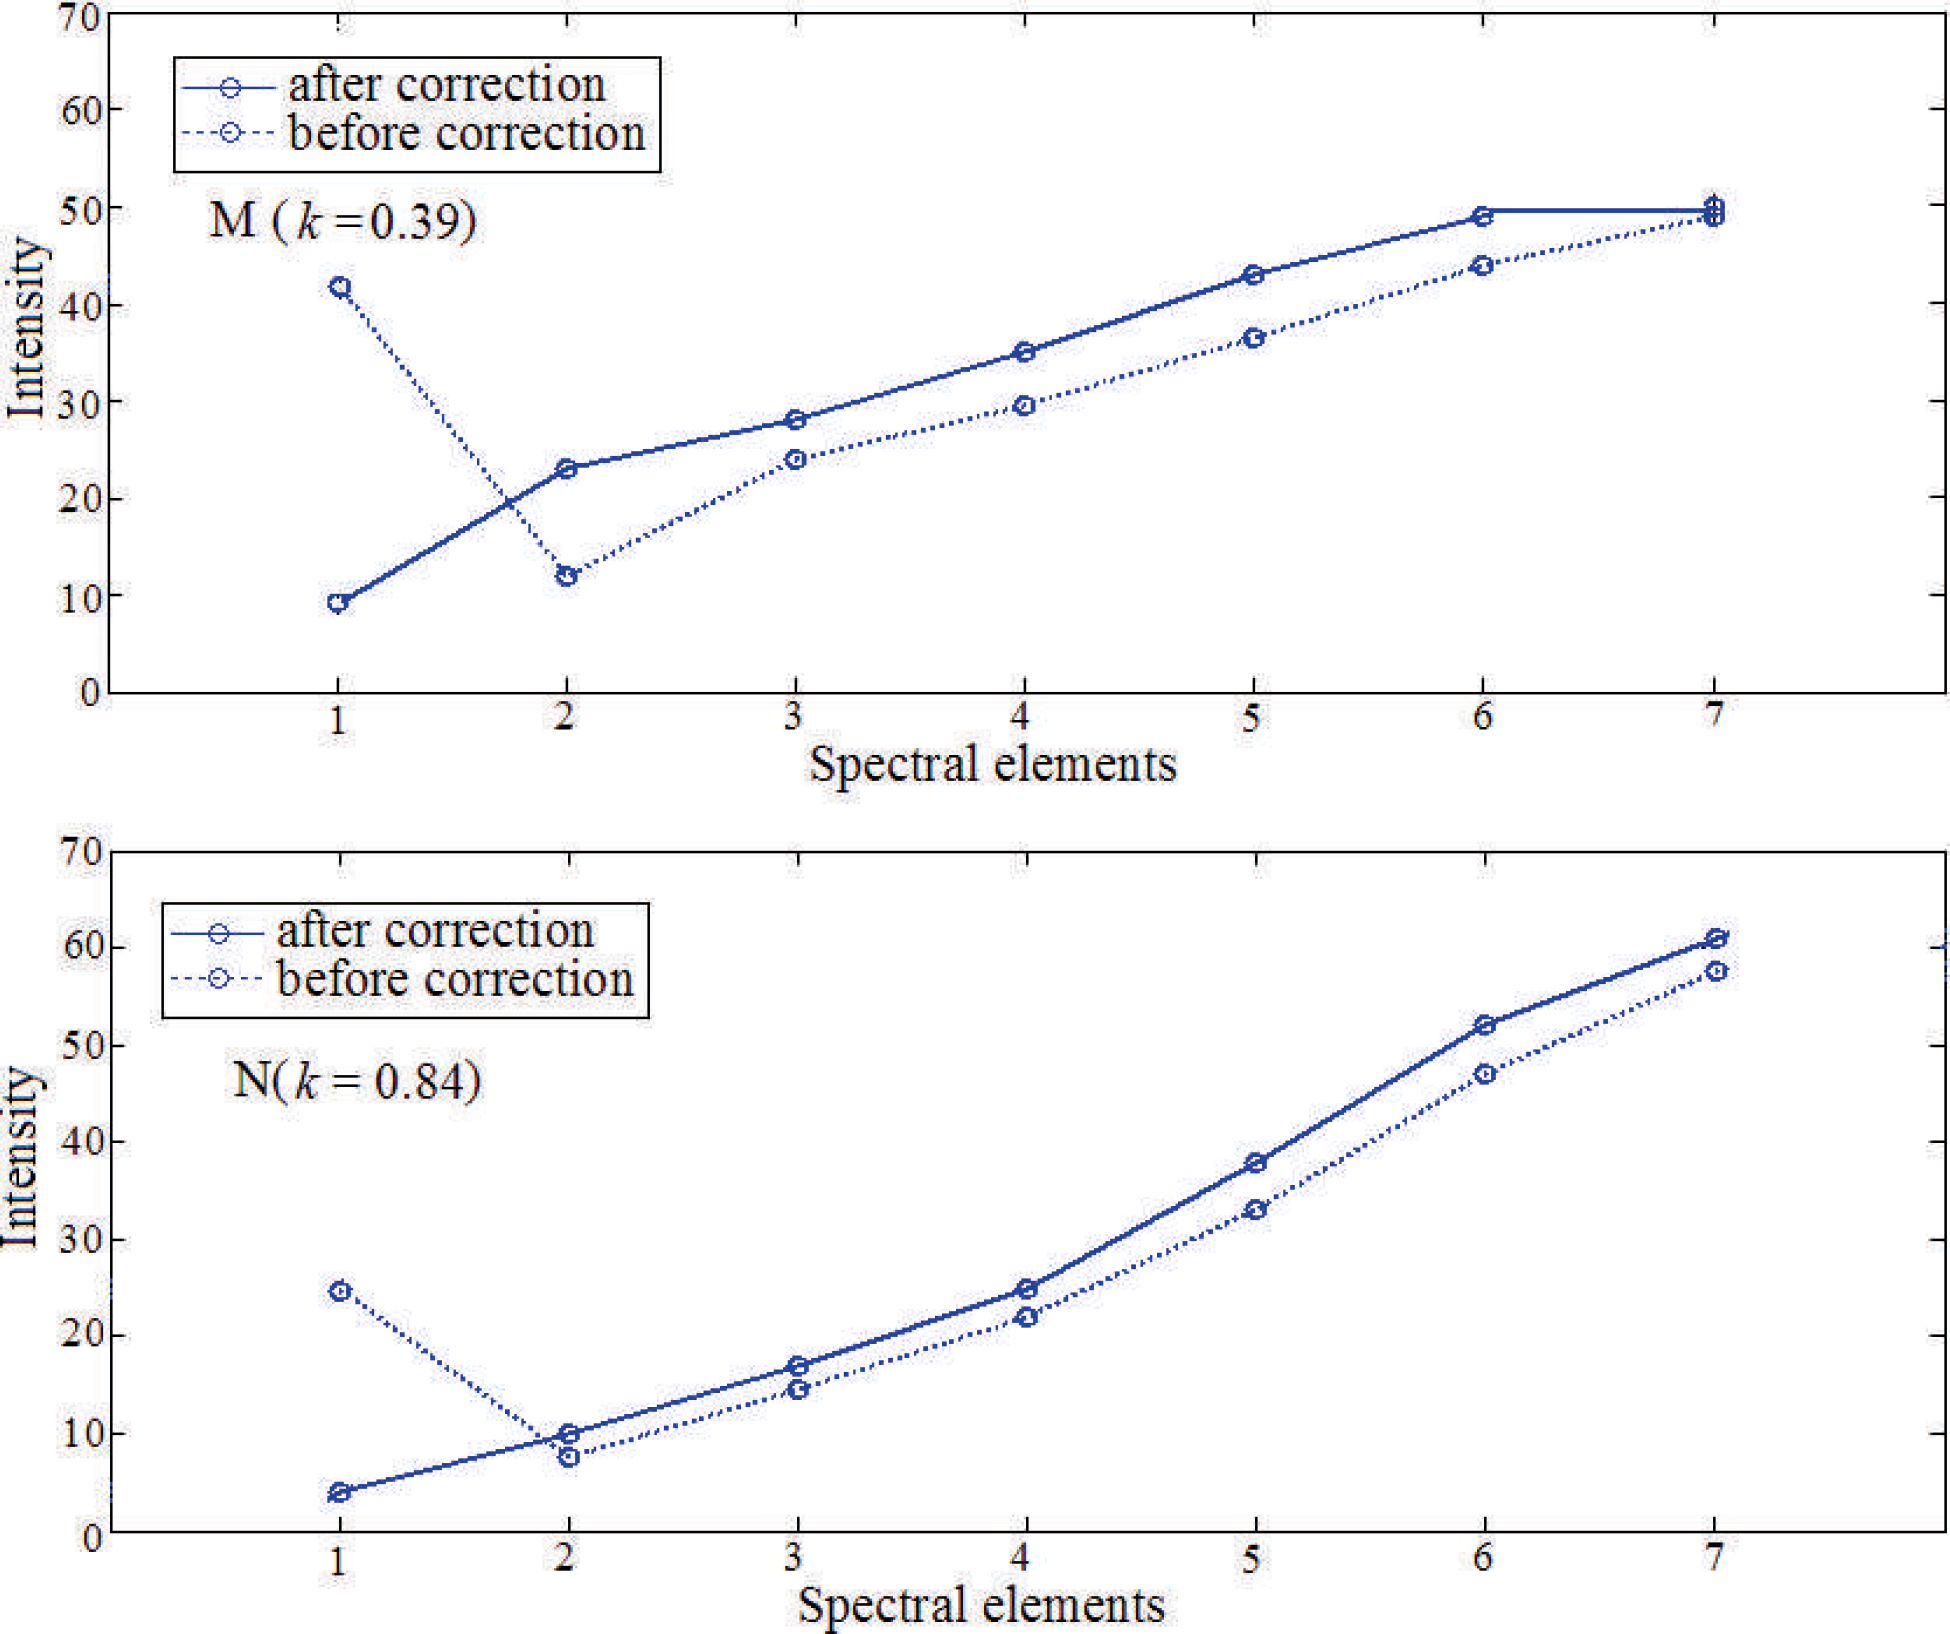
The spectrograms of the two testing points before correction and after correction.
As can be seen from Fig. 11, the solid curves are more similar to the benchmark curves in Fig. 10 than the dashed curves. The first data points in the spectrogram before revision are outliers. This is because the seventh spectral elements of the two testing pixels have higher intensity than the others and contribute to the first spectral elements by IHT. However, the outliers return to the vicinity of the normal values after being corrected.
Spectral angle match (SAM) is an algorithm to identify and classify the targets by calculating and comparing the angle between the spectral vector of the target and the spectral vector of the sample. By calculating, the spectral angles between the benchmark vectors and the spectral vectors before correction of M and N are αM = 12.8° and αN = 21.1°; however, the spectral angles between the benchmark vectors and the spectral vectors after correction of M and N are βM = 1.2° and βN = 1.8°. Obviously the spectral angles between the benchmark vectors and the spectral vectors after correction are smaller than the angles between the benchmark vectors and the spectral vectors before correction. Experimental results show that the correction method proposed in this paper is effective to improve the quality of the recovered spectral images.
CONCLUSION
In DMD-based HTSI, the Hadamard encoding mask cannot guarantee the dispersed spectrum of all the pixels to be encoded perfectly based on the Hadamard matrix; therefore, the recovered spectral images need to be corrected. The mathematical model of correction is deduced and a practical correcting method for the recovered spectral images is proposed. Experimental results reveal that the quality of the recovered spectral images after correction is improved.