
Abstract
An analytical method for the classification of complex real-world samples was researched and developed with the use of excitation-emission fluorescence matrix (EEFM) spectroscopy, using the medicinal herbs, Rhizoma corydalis decumbentis (RCD) and Rhizoma corydalis (RC) as example samples. The data set was obtained from various authentic RCD-A and RC-A, adulterated AD, and commercial RCD-C and RC-C samples. The spectra (range: λex=215∼395 nm and λem=290∼560 nm), arranged in two- and three-way data matrix formats, were processed using principal component analysis (PCA) and parallel factor analysis (PARAFAC) to produce two-dimensional component-by-component plots for qualitative data classification. The RCD-A and RC-A object groups were clearly discriminated, but the AD and the RCD-C as well as RC-C samples were less well separated. PARAFAC analysis produced somewhat better discrimination, and loadings plots revealed the presence of the marker compound Protopine—a strongly fluorescing substance—as well as at least two other unidentified fluorescent components. Classification performance of the common K-nearest neighbors (KNN) and linear discrimination analysis (LDA) methods was relatively poor when compared with that of the back propagation- and radial basis function-artificial neural networks (BP-ANN and RBF-ANN) models on the basis of two- and three-way formatted data. The best results were obtained with the three-way fingerprints and the RBF-ANN model. Subsequently, the quality of the commercial samples (RCD-C and RC-C) was classified on the best optimized RBF-ANN model. Thus, EEFM spectroscopy, which provides three-way measured data, is potentially a powerful analytical technique for the analysis of complex real-world substances provided the classification is performed by the RBF-ANN or similar ANN methods.
Keywords
INTRODUCTION
Excitation-emission fluorescence (EEF) spectroscopy is a well-established technique for fingerprint analysis of samples, which, often, contain polycyclic aromatic hydrocarbons. Examples of such applications include the identification and classification of various kinds of oils,1–4 water samples, 5 pharmaceuticals, 6 tobacco, 7 and dyes. 8 The technique is rapid, has high sensitivity, requires small amounts of sample, 9 and provides qualitative and quantitative information. Sample preparation is often quite simple, involving just an aqueous or buffer solution extraction, and fluorescence spectroscopy will normally detect the fluorescing substances so extracted (limit of detection (LOD) ∼10−6–10−9 mol L−1) irrespective of any other components that may have dissolved in the extraction medium. Useful and convenient substances for research and development of analytical methodologies for comparison of complex samples are herbs because they are complex plant materials and are in common use throughout the world. Fluorescing molecular components of a traditional Chinese medicine (TCM) are often the active species; they are usually aromatic compounds or their derivatives, which have a π-conjugation and a rigid, planar structure, e.g., alkaloids, coumarins, flavonoids, anthraquinones, and phenylpropanoids.
Recently, there has been increasing interest in the development of analytical methodology for comparison of samples containing such substances so as to ensure their quality and to limit the spread of adulterated, substituted, and alternative TCMs. In this context, Wei et al.10,11 applied excitation-emission fluorescence matrix (EEFM) spectroscopy quantitatively to analyze the contents of such substances but the work did not extend to cover any comparisons, classification, or discrimination amongst such samples. Ortiz et al. 12 found ciprofloxacin in human urine from EEFM data submitted to parallel factor (PARAFAC) analysis, and the associated recovery and the absolute relative errors were 88.3% and 4.2%, respectively. Maggio et al. 13 presented a new application for the three-way kinetic EEFM data for quantitative determination of two inter-converting analytes, carbaryl (0– 363 μg L−1) and 1-naphthol (0–512 μg L−1), embedded in a complex sample background. Data processing was performed with the unfolded partial least squares (PLS) method combined with residual tri-linearization (U-PLS/RTL), and also with the (PARAFAC) model, combined with a calibration based on multilinear regression. U-PLS/RTL was shown to be significantly simpler, and it produced similar figures of merit in comparison to those from the PARAFAC analysis. The application and algorithms of EEF for second- and third-order calibration can be found in two recent reviews.14,15
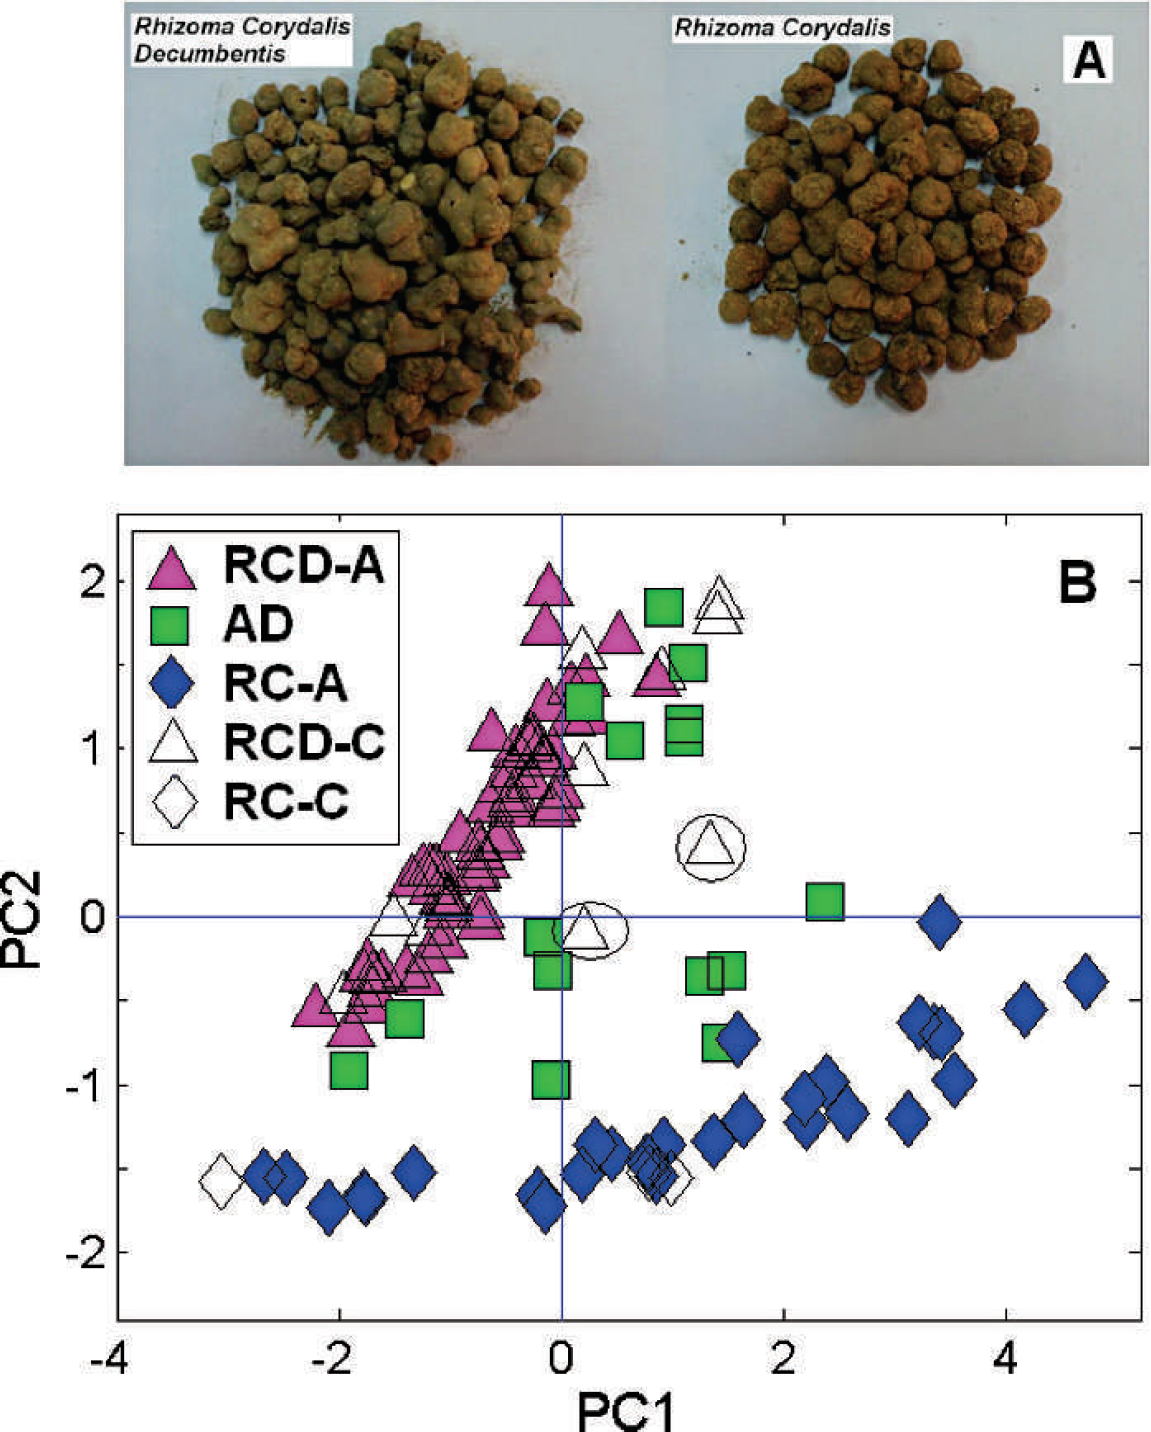
For this work, two similar TCMs were chosen: (i) Rhizoma corydalis decumbentis (RCD), which is the dried root tuber of Corydalis decumbens (Thunb.) Pers., and a plant of the Papaveraceae family, which is widely distributed in the Jiangxi province, and (ii) Rhizoma corydalis (RC), which is the dried root tuber of Corydalis yanhusuo W.T. Wang, of the same family, and mainly grows in Zhejiang province. Both are well-known TCMs with many well-documented medicinal properties.16–19 Their actual appearance is very similar (Fig. 1A), and as a consequence they can be used to adulterate each other or as substitutes. However, even though some of the plant properties are similar, for clinical purposes, it is desirable to know accurately the nature of a prescribed medication; furthermore, the two TCMs often have different market values depending on their availability at the time. In such cases, adulteration of the more expensive by the cheaper one can occur. This indicates that the above two TCMs are particularly appropriate examples for investigation because it focuses on the development of simple, rapid analytical methodologies for the discrimination and classification of complex substances with the use of fluorescence spectral fingerprints and their interpretation with the use of chemometrics methods.
(
In general, examples of classical methods for TCM identification include morphological and microscopic examination, both of which are highly subjective, particularly with the very similar RCD and RC root samples (Fig. 1A). Previous phytochemical and clinical studies have shown that protopine and tetrahydropalmatine have been identified as the active secondary metabolites of the plants, and they were noted as reference markers. 20 Protopine has different effects21,22 when interacting with tetrahydropalmatine,23,24 but both are present in the two TCM plants as well as in other members of the Corydalis family;25,26 thus, the use of these substances as markers for comparative purposes of RCD and RC is insufficient. In addition, previous literature for RCD and RC mostly focused on the identification and quantification of one or more compounds, such as protopine, tetrahydropalmatine, and palmatine, with the use of liquid chromatography (LC) or capillary electrophoresis (CE).16,27 Other studies have compared the different Corydalis species, 27 but these involved quite expensive mass-spectrometric techniques, which were time consuming and required organic solvents. Recent studies suggested that alkaloids were the main active constituents separated from RCD and RC, 16 and it was demonstrated that the marker compound protopine fluoresces. This suggests that EEFM spectroscopy is suitable for studying both RCD and RC.
The aims of this study were to research and develop a rapid and reliable screening method with the use of EEFM fingerprints to enable the classification of complex, real-world samples such as the two visually similar RCD and RC materials; of particular interest was the performance of the chemometrics classification models to discriminate the adulterated samples. Thus, it was the intention of this work to explore the use of two- and three-way EEFM spectral fingerprints for qualitative analysis with the use of principal component analysis (PCA) and parallel factor analysis (PARAFAC), respectively. Several chemometrics methods: K-nearest neighbors (KNN), linear discrimination analysis (LDA), back propagation artificial neural networks (BP-ANN), and radial basis function artificial neural networks (RBF-ANN) were then used for classification of the samples on the basis of the two-way fingerprint data, and their performance was compared.
EXPERIMENTAL
Test samples information.
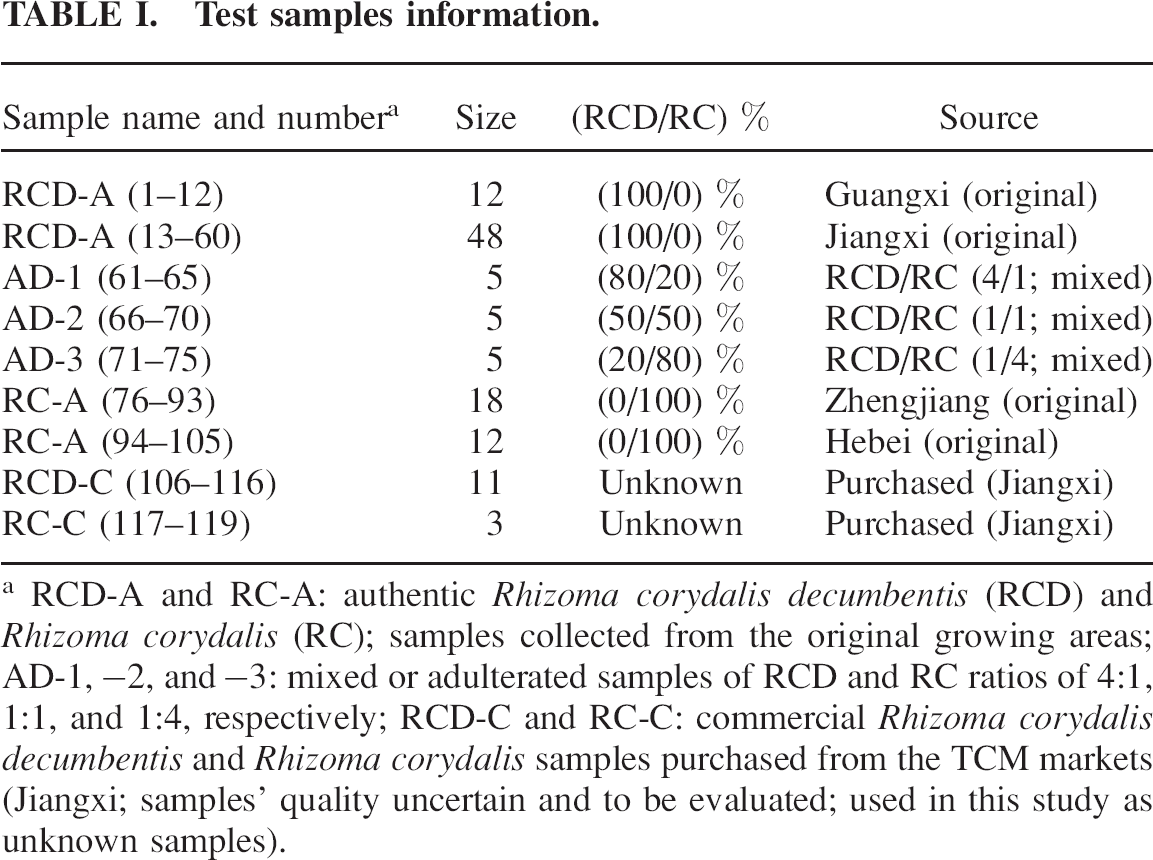
RCD-A and RC-A: authentic Rhizoma corydalis decumbentis (RCD) and Rhizoma corydalis (RC); samples collected from the original growing areas; AD-1,–2, and–3: mixed or adulterated samples of RCD and RC ratios of 4:1, 1:1, and 1:4, respectively; RCD-C and RC-C: commercial Rhizoma corydalis decumbentis and Rhizoma corydalis samples purchased from the TCM markets (Jiangxi; samples' quality uncertain and to be evaluated; used in this study as unknown samples).
Protopine (Scheme 1A) and tetrahydropalmatine (Scheme 1B) were obtained from the National Institute for the Control of Pharmacological and Biological Products of China, Beijing, China. Freshly redistilled water was used throughout the experiments. Protopine solution (0.25 mg mL−1) was prepared by dissolving 6.25 mg crystal in 25 mL methanol.
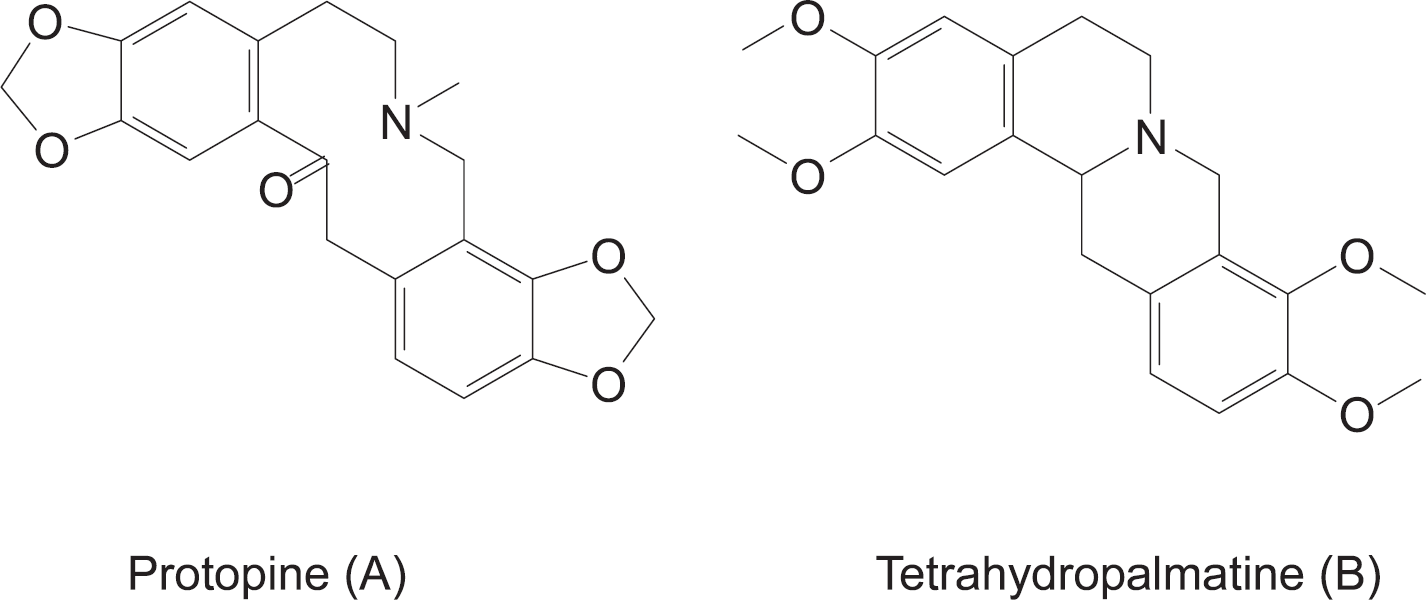
Molecular structure of (A) protopine and (B) tetrahydropalmatine.
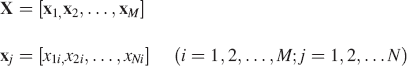
where the vector xj (N × 1) denotes the emission spectrum measured at the ith excitation wavelength. By application of PCA,28,29 X can be decomposed into three matrices, the score matrix T (N×M), the loadings matrix VT (M×M), and the residual matrix E (N×M):

The score matrix,
Suppose
opnm are elements of the
Radial Basis Function and Back-Propagation Artificial Neural Networks. In general, an ANN model provides an iterative learning method for the analysis of experimental data.42,43 It is a powerful chemometrics approach because it does not need any model structure specification and can process multivariate problems of nonlinear systems. With appropriate training, ANNs can accurately model the presence of synergistic effects and avoid the influence of potential nonlinearity in mixtures, which result from the interferences between the components. There are two common ANN methods, which have different transfer functions, i.e., the RBF-ANN and BP-ANN models.
44
The kernel or basis function is classified as a local activation function compared with the sigmoid function. In this case, the main difference is that with the BP-ANN model the basis function defines an ellipsoid in the input space while with the RBF-ANN a Gaussian function is utilized; it is characterized by two parameters: the center and the peak width (cj and σ
j
). The output from the jth Gaussian neuron for an input object,
The output, which computes the weighted sum of the hidden node outputs, is given by
where wji represents the weights of the connections between the hidden layer, i, and output layer, j, and the oj(x) can be obtained from the previously given expression above.
K-nearest neighbors and LDA procedures were carried out with the use of the ChemoAC toolboxes (version 1.1). 45 The BP-ANN and RBF-ANN algorithms were written with the MATLAB 6.5 software and the subroutines in the Nnet toolbox for MATLAB.
In this investigation, the measured fluorescence data from the RCD-A, RC-A, and AD samples were partitioned into training and validation data sets. In general, two-thirds of the authentic and AD samples were randomly selected for the training data set, i.e., 40 RCD-A, 20 RC-A, and 10 AD samples, and the remaining one-third were included in the validation data set, i.e., 20 RCD-A, 10 RC-A, and 5 AD samples. The quality of the 14 commercial samples, i.e., 11 RCD-C, 3 RC-C samples, was determined based on the resulting discrimination model. Also, importantly the classification performance of the several above-mentioned chemometrics methods was compared.
RESULTS AND DISCUSSION
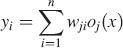
3D fluorescence spectra and contour EEFM plots of RCD-A (
(
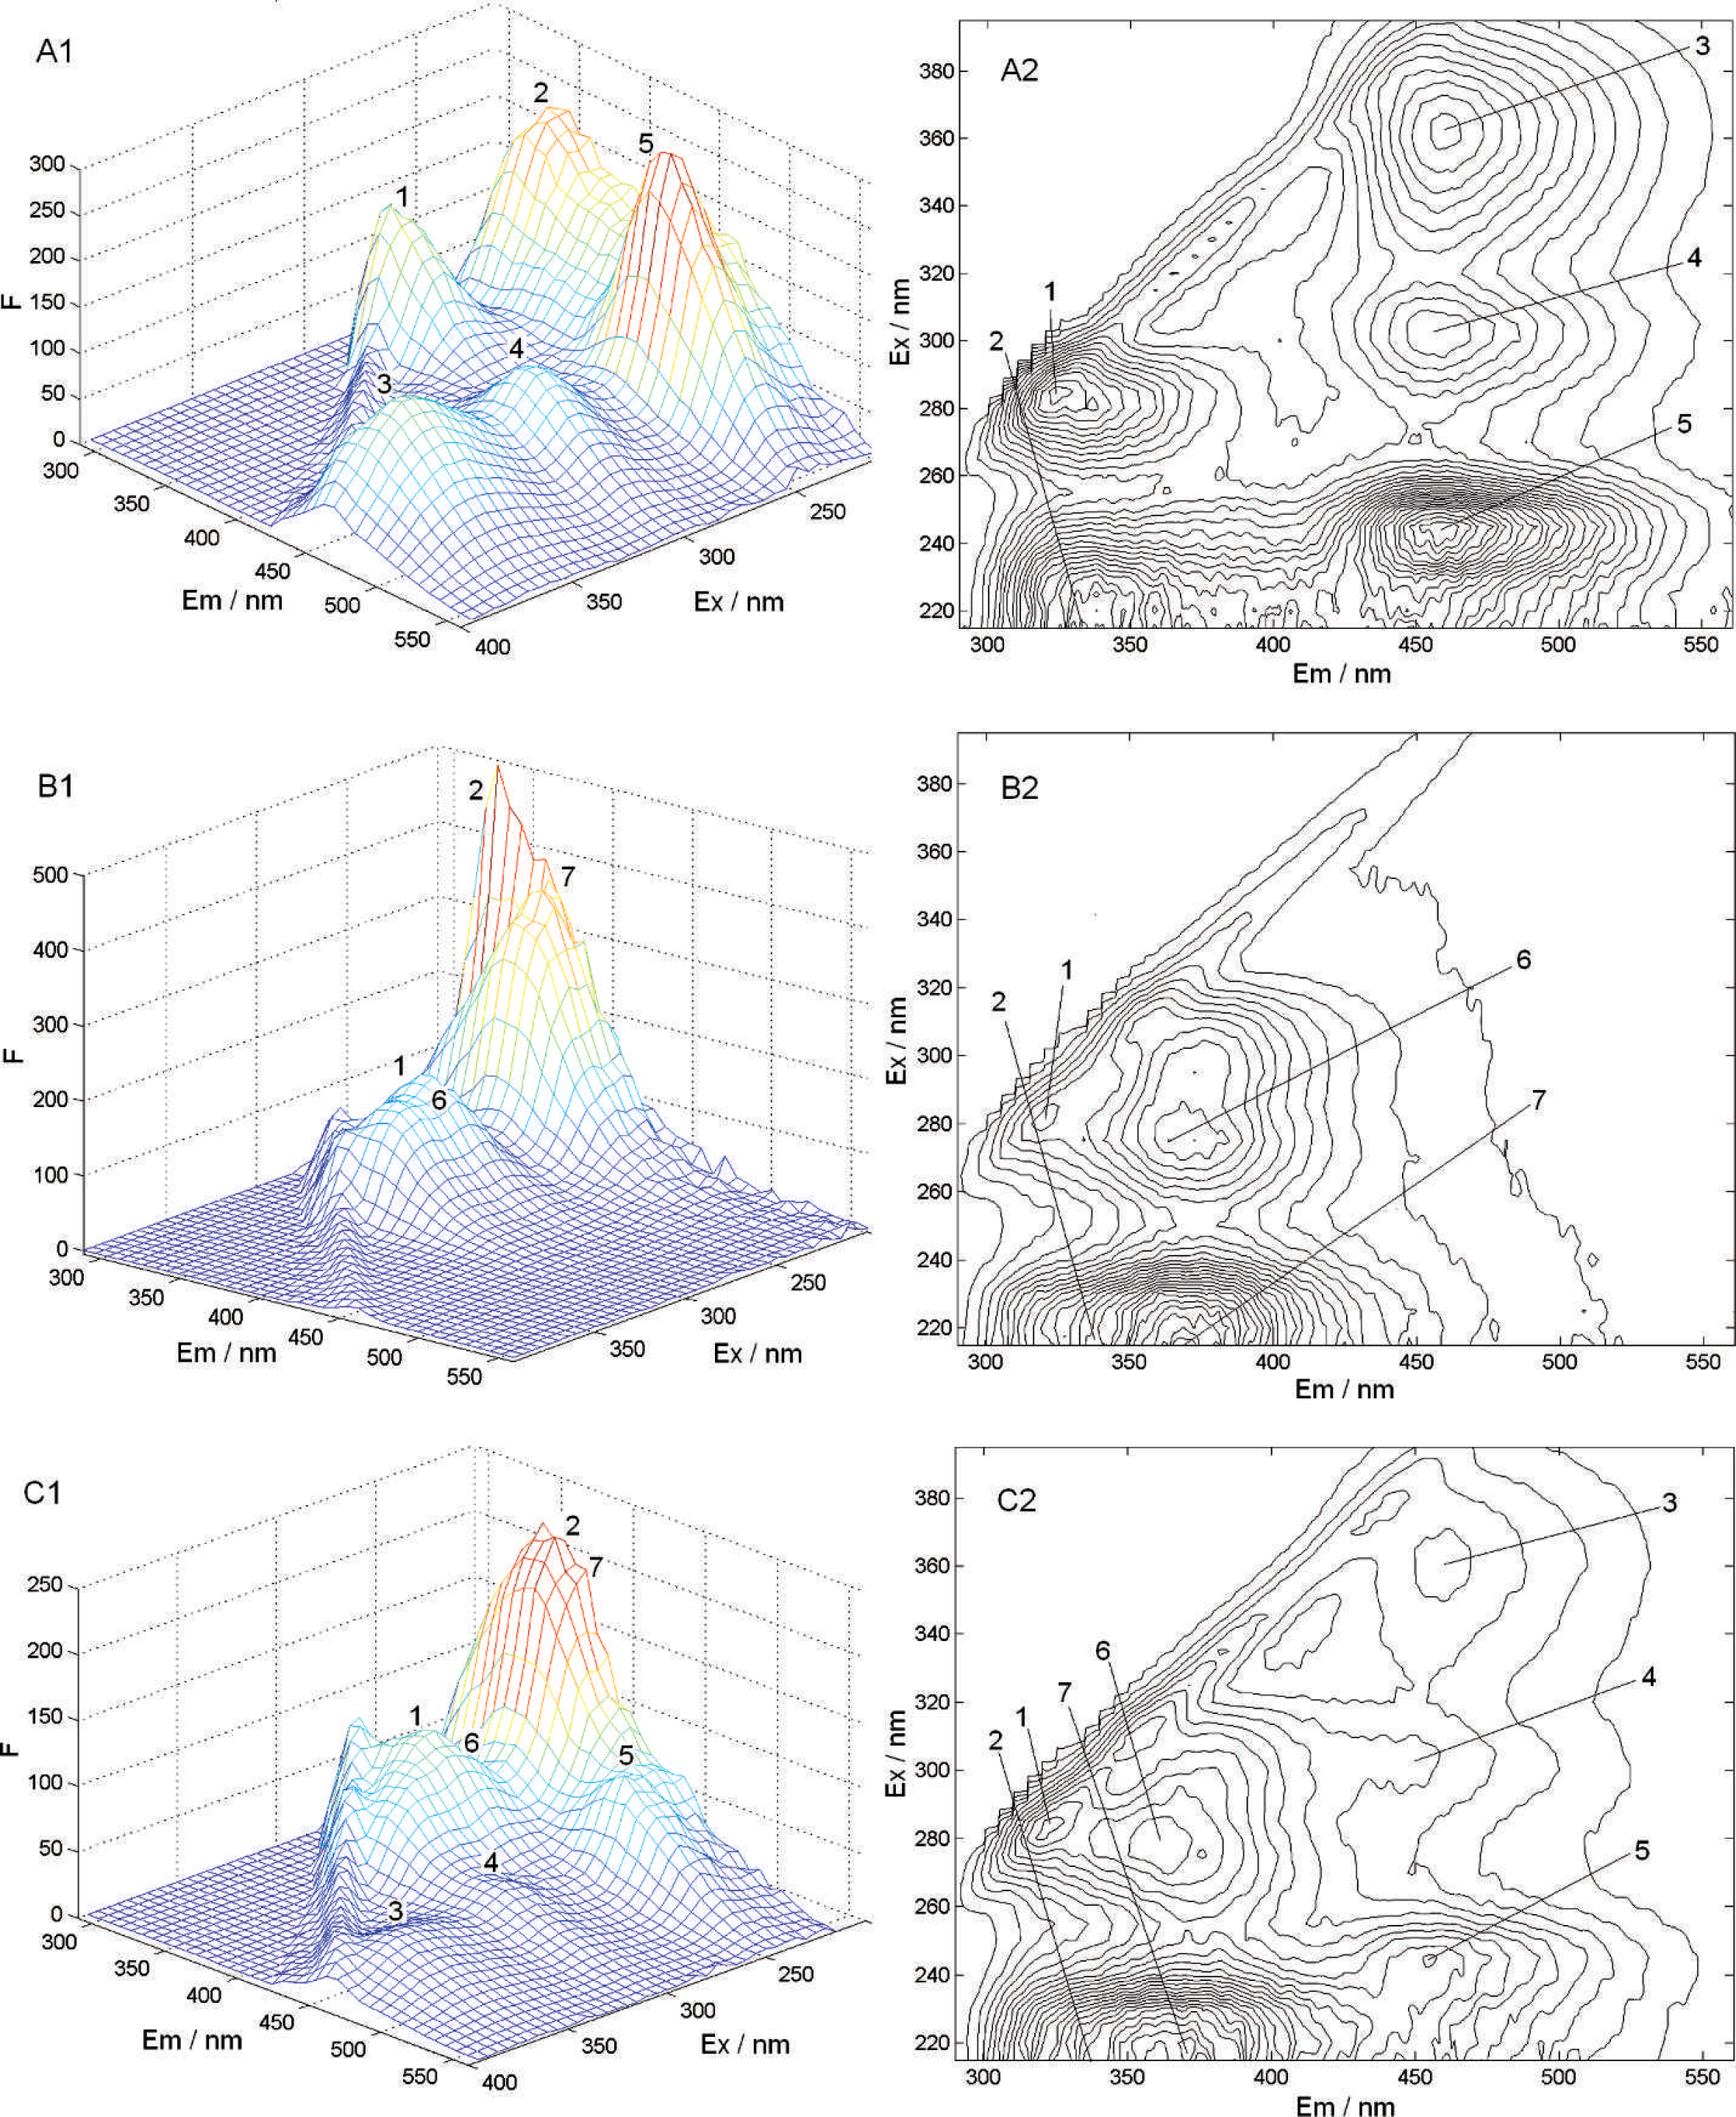
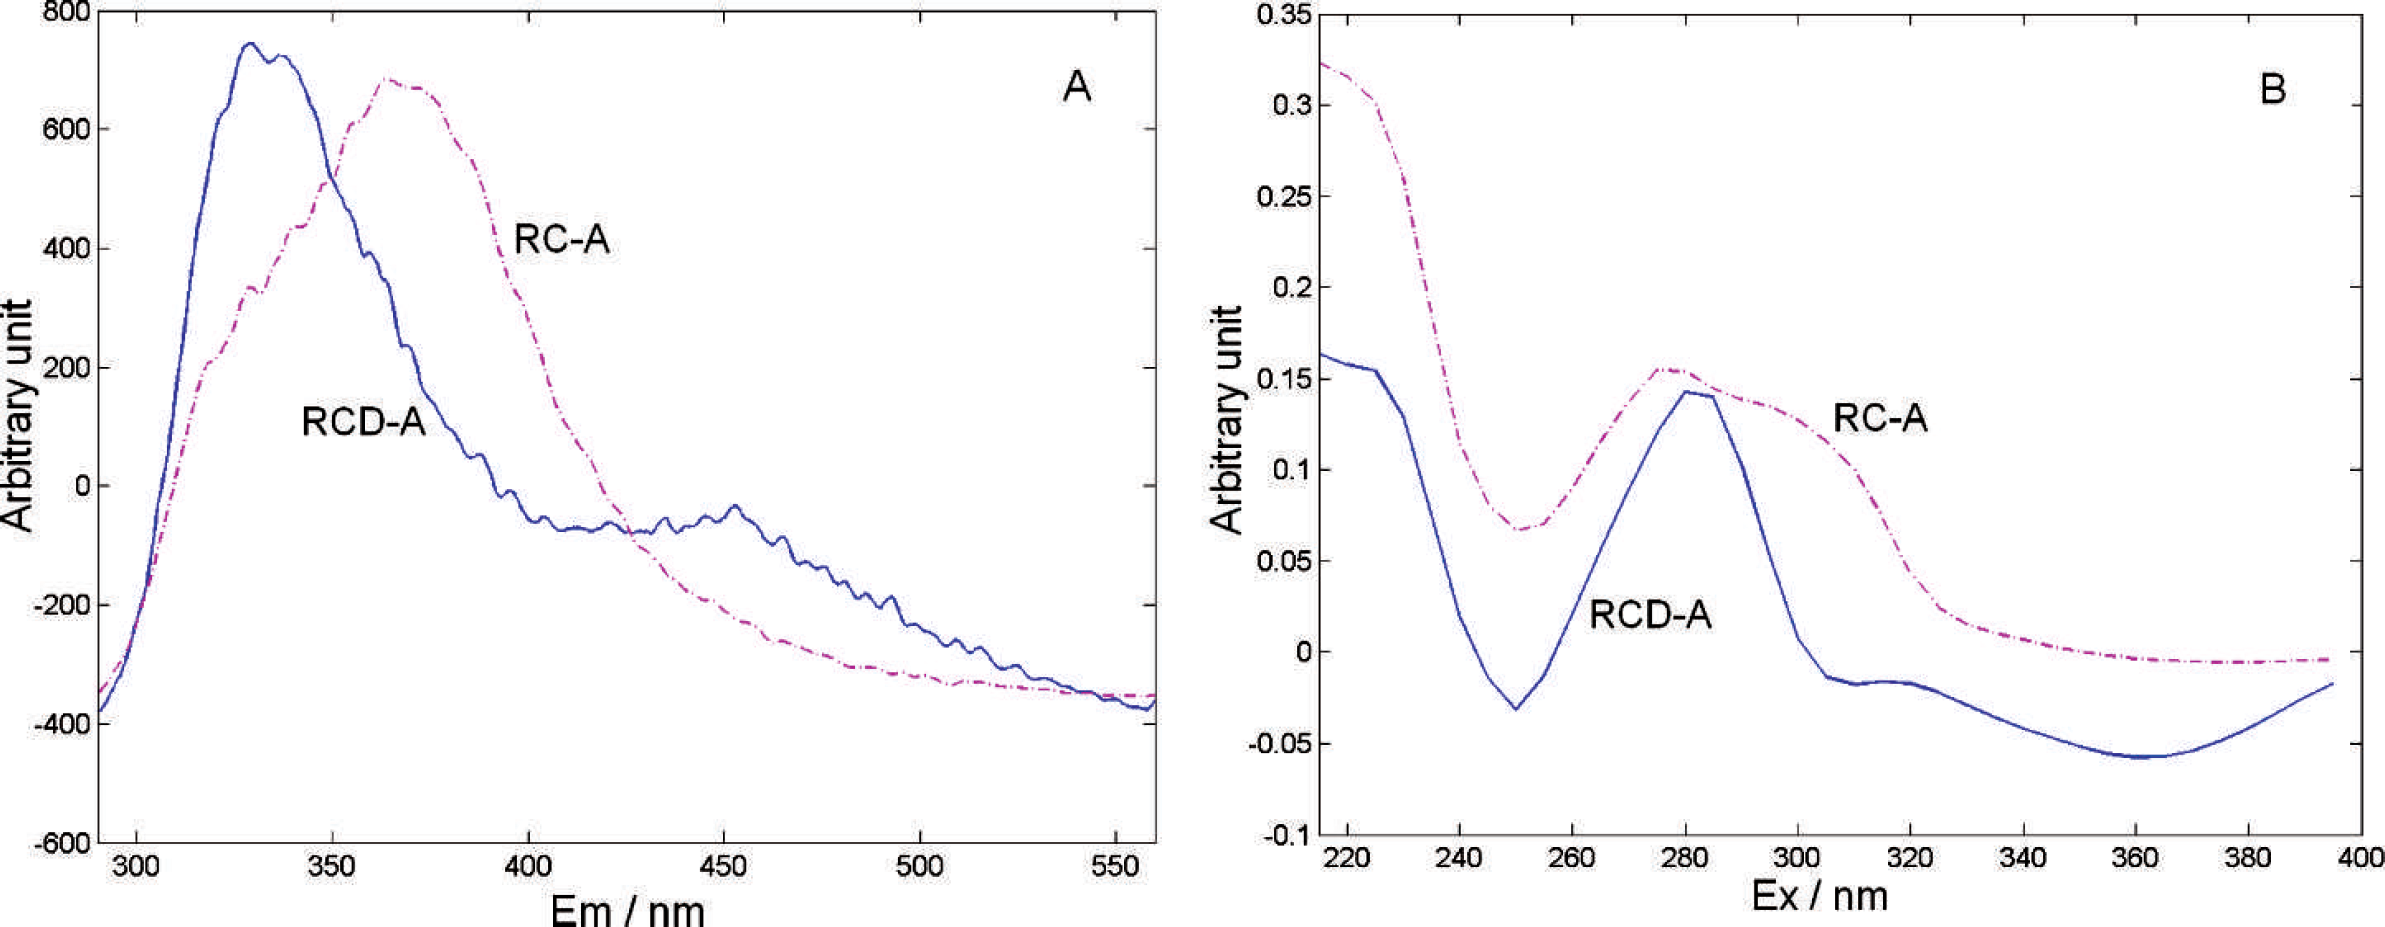
The PARAFAC results indicate that there are three fluorescent components for both the RCD and RC sample sets. Their excitation and emission loadings (a1, a2, and a3) are displayed for the RCD samples in Figs. 4A1 and 4A2; for the RC samples, the excitation and emission loadings (b1, b2, and b3) are displayed in Figs. 4B1 and 4B2; and for the whole sample set, the excitation and emission loadings (c1, c2, c3, and c4) are displayed in Figs. 4C1 and 4C2, respectively.
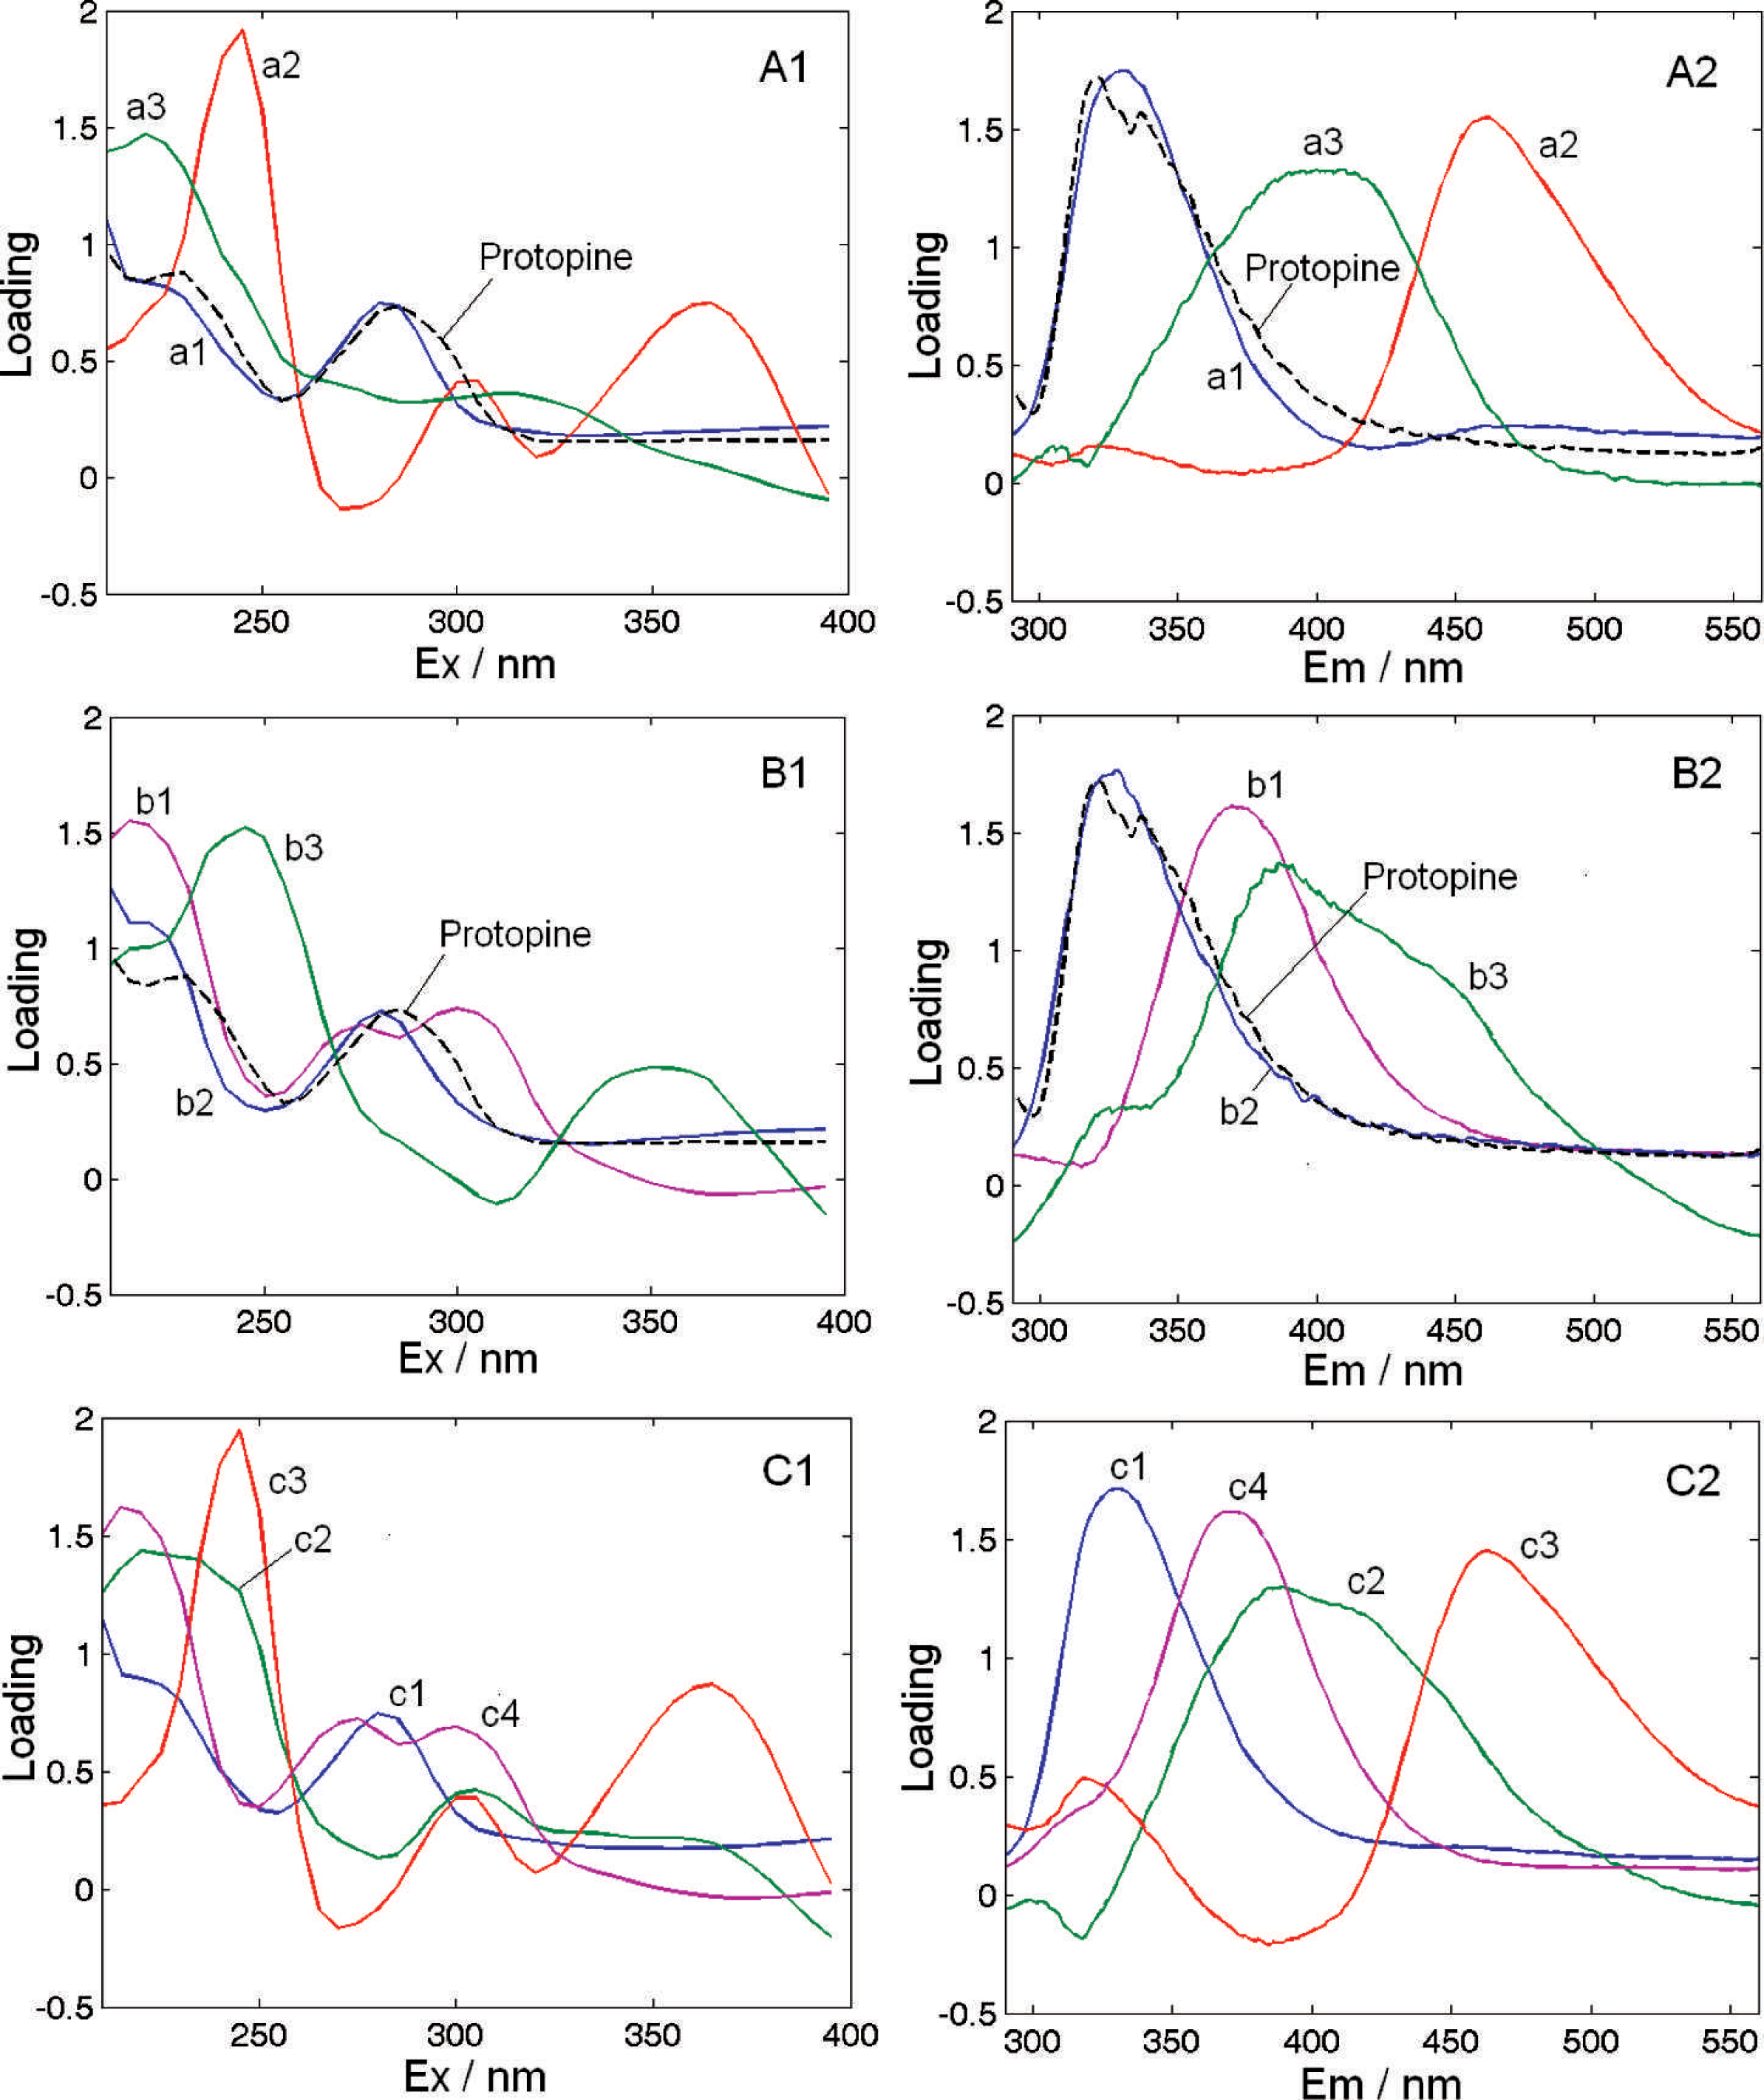
PARAFAC excitation and emission loadings of (
Qualitative comparison of the excitation an emission loadings (Fig. 4) indicates that the loadings profiles a1, b2, and c1 are quite similar to the EEFMs of pure protopine (see Instrumentation section). This suggests that the intense peak in the λem = 300–350 nm range observed in the fluorescence spectrum (labels 1 and 2, Fig. 2) can be attributed to the fluorescence of protopine. This assertion is supported by the molecular structure of protopine, which has properties that facilitate fluorescence: it is a polycyclic aromatic hydrocarbon compound with π-conjugation and a rigid structural plane (Scheme 1). Also, it is one of the most effective components with high pharmacological activity and is usually chosen as a marker compound to assess the quality of RCD and RC. In contrast, another marker compound, tetrahydropalmatine, does not have a molecular structure that facilitates fluorescence, and consequently, its spectrum and the related loadings were not observed (Scheme 1B). In summary, PARAFAC modeling of the EEFMs led to the following conclusions: (i) three fluorescent spectral components were resolved for RCD and RC: a1, a2, and a3 for RCD and b1, b2, and b3 for RC; (ii) components a1 and b2 have the same profile as a spectrum of protopine, while factors a3 and b3 are arguably similar to each other but their source(s) are unclear; (iii) factor a2 is specific to RCD (labels 3, 4, and 5, Fig. 2), and factor b1 is specific to RC (labels 6 and 7, Fig. 2); (iv) four, rather then three, factors were extracted for the whole sample set; c1 is similar to a1 and b2 (protopine), c2 has some features similar to a3 and b3, c3 is similar to a2, and c4 is similar to b1 (Fig. 4C).
The loadings matrix,
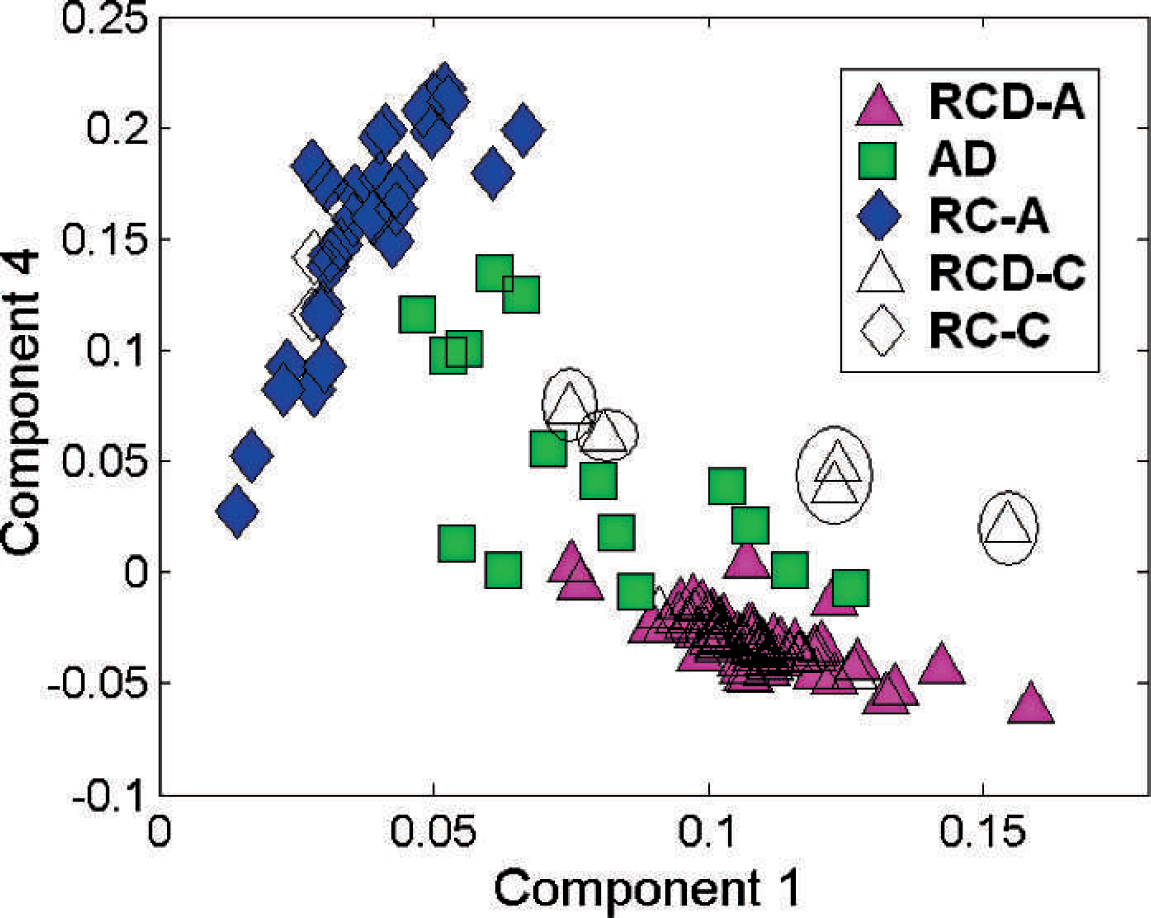
Component 1 versus Component 4 bi-plot of the PARAFAC concentration loadings vectors for the 119 samples.
The classification of the RCD-A and RC-A objects in the training and validation sets with the use of the KNN and LDA models was satisfactory (classification rates: 93∼100%) but the discrimination performance for the AD samples was poor (classification rates: 0∼50% for training set and 20∼80% for validation set).
In general, the classification performance of both models, BP-ANN and RBF-ANN, for the two data sets was satisfactory and recorded better results for the AD samples, both with the training (classification rates: 80∼100%) and validation sets (70∼100%); however, with the two-way fingerprints, the matching classification was as low as 70 to 80%. On the other hand, the three-way data set when modeled by the PARAFAC method produced only one moderately low matching result of 90%, with the others rating no less than 97%.
Quality assessment on the commercial samples based on both the BP-ANN and RBF-ANN models showed that all of the RC-C samples were predicted to correspond to the authentic RC type, and the 11 RCD-C samples were classified into two groups: six authentic RCD and five AD ones as expected. In agreement with the previous results from the other models, this confirmed that these five RCD-C samples were adulterated and also indicated that the three-way fingerprints processed by the ANN models were particularly well suited for the classification of the quality of such complex substances as RCD and RC.
CONCLUSION
An analytical method based on the measurements of excitation-emission fluorescence matrices of examples of real-world complex substances, Rhizoma corydalis decumbentis (RCD) and Rhizoma corydalis (RC), was researched and developed. These matrices were formatted as two- and three-way fingerprints. Qualitative bi-plot analysis with the use of PCA and PARAFAC methods indicated that the authentic RCD-A and RC-A object groups were well separated but the discrimination of the AD from the RCD-C and RC-C samples was less evident, and the PARAFAC modeling produced better results than PCA. Furthermore, loadings plots revealed the presence of the marker compound protopine, a well-known, strongly fluorescing compound, as well as at least two other unidentified significant fluorescent components. This demonstrated that the PARAFAC method can produce analytical evidence that not only supports the established information, i.e., the presence of protopine, but also new information about fluorescent substances that are apparently present but still awaiting identification.
Classification performance of the commonly used methods KNN and LDA was compared with that of the BP-ANN and RBF-ANN models on the basis of two- and three-way formatted data. The common methods performed relatively poorly as compared to the ANN ones, and the best results were obtained with the use of the three-way fingerprints and the RBF-ANN model. Almost 100% classification rates were recorded for RCD-A, RC-A, and AD samples in the training and validation data sets derived from the three-way fingerprints. In addition, all the commercial (RC-C) samples were found to be unadulterated and five adulterated samples were distinguished from the commercial RCD-C ones.
Thus, it has been demonstrated that EEFM spectroscopy is a powerful potential analytical technique for classification analysis of complex real-world substances provided the classification is performed by the RBF-ANN or similar method; this approach is particularly useful where standards for the pure components in complex substances, such as herb reference materials, are unavailable or have not been defined.
Footnotes
ACKNOWLEDGMENTS
The authors gratefully acknowledge the financial support of this study by the National Natural Science Foundation of China (NSFC-21065007), and the State Key Laboratory of Food Science and Technology of Nanchang University (SKLF-MB-201002 and SKLF-TS-200919).