






Abstract
Human serum albumin (HSA) is a protein responsible for the transportation and delivery of drug molecules, fatty acids, and metabolites to various targets and the removal of waste products from the body. However, the binding of heavy metal ions, including mercury (II) (Hg(II)), can adversely affect HSA physiological properties with deleterious health consequences. The volatility of Hg at room temperature precludes the use of conventional flame, graphite furnace, or inductively couple atomic absorption spectroscopy for routine analysis of Hg in most research and medical laboratories. This study reports the first potential utility of fluorescence spectroscopy and multivariate regression analysis for the determination of Hg(II) concentration in HSA samples. The results of Fourier transform infrared (FT-IR) spectroscopy indicated the binding of Hg(II) at HSA amide I and amide II sites. Also, the binding of Hg(II) with HSA resulted in a decreased HSA ultraviolet (UV)-visible absorption and dramatic quenching of HSA fluorescence emission. The developed multivariate partial least squares regression (PLSR) model from Hg(II)–HSA fluorescence emission data was able to predict the Hg(II) concentration in HSA samples, with a root mean square percent relative error of prediction of 6.59%. The simplicity, low cost, and robustness of this method makes it a promising alternative method for rapid determination of Hg(II) concentration in biological specimens.
Keywords
INTRODUCTION
Human serum albumin (HSA) is an extracellular protein in the blood plasma responsible for the transportation and delivery of fatty acids, drug molecules, and metabolites to different targets in the body. 1 HSA protein has a molecular weight of 66 000 Dalton, contains 585 amino acids with 17 disulfide bridges, and is approximately 60% α-helix with no β-strand.2,3 As a transportation medium, HSA can potentially bind with small molecules, drugs, metabolites, dyes, and heavy metal ions.4,–8 The binding of small molecules and heavy metals with HSA is well known to have a considerable influence on HSA physiological characteristics and may also induce HSA conformational changes.4,–8 Most importantly, elevated heavy metal concentrations in humans have been implicated in various health hazards, including reduction of child intelligence quotients, lung cancer, headaches, hypertension, depression, mental disorders, cancer diseases, and neurological disorders. 9,–12
Mercury (Hg) is a known toxic heavy metal contaminant, causing severe health problems including autism and autism spectrum disorder, diabetes, lung cancer, kidney and renal failure, oxidative DNA damage, hypertension, cardiovascular disease, stroke, and neurological disorders at chronic and/or acute concentrations.13,–19 Humans can potentially be exposed to Hg through various routes including occupational, environmental (air, water, and soil), foods, or industrial activity.20,–28 The harmful health consequences of elevated Hg concentration in humans necessitate the need for the development of analytical techniques capable of Hg analysis in complex biological specimens such as HSA. Conventional flame atomic absorption spectroscopy (FAAS), graphite furnace atomic absorption spectroscopy (GF-AAS), and inductively couple plasma atomic absorption spectroscopy (ICP-AAS) have been well developed for heavy-metal analysis. However, the high volatility of Hg at room temperature precludes the use of conventional FAAS, GF-AAS, or ICP-AAS for Hg analysis. Analysis of Hg is often achieved using a more specialized and relatively expensive cold vapor atomic absorption and/or cold vapor atomic fluorescence technique.29,–33 Other analytical methods such as high-performance liquid chromatography (HPLC), capillary electrophoresis (CE), chromatographic separation with fluorescence detection, electroanalytical techniques, and nanoparticle chemical sensing have also been strategically employed for Hg analysis.34,–40 However, the high cost of cold vapor instruments hinder routine Hg analysis in most research and medical laboratories. Chromatographic and CE separation techniques suffer from high instrumental cost, poor resolution, and long analysis times. Other methods may involve tedious and lengthy organic synthesis.
Considering the toxicity and severity of the health implications of Hg contaminants, there is an urgent need for the development of a simple, accurate, and low-cost protocol for rapid Hg analysis in biological specimens. This study explored the first possible use of fluorescence spectroscopy, guest-host HSA chemistry, and multivariate regression analysis for the determination of Hg(II) concentrations in human serum albumin. The simplicity and low cost of spectrometers and multivariate regression analysis of spectral data has recently made it increasingly attractive for rapid determination of various analytes in agricultural products, pharmaceuticals, and environmental samples.41,–45 The practical applications of multivariate regression analysis of spectral data for the determination of diverse analytes, metabolites, and for fast screening of cancer cells with little or no sample preparation have also been well demonstrated in biomedical studies and clinical diagnoses.46,–51 Besides, the multivariate regression approach to chemical analysis is not only rapid, sensitive, accurate, and inexpensive, but it is also robust. Once the calibration model is developed and carefully optimized, it can be used for accurate determination of analytes in samples for six months without recalibration, 52 considerably reducing the time and the cost of chemical analysis.
EXPERIMENTAL
RESULTS AND DISCUSSION
Fourier transform infrared spectroscopy was initially used to evaluate the HSA binding sites with Hg(II). As expected, the FT-IR spectrum of Hg(II) was transparent and featureless. Figure 1 shows the FT-IR spectrum of HSA and the resulting Hg(II)–HSA complexes. HSA shows the characteristic amide I (1653 cm−1) and amide II (1541 cm−1) peaks corresponding to carbonyl (C=O) and amine (C–N) of amino acid residues of HSA.8,53 The binding of Hg(II) with HSA resulted in a significant reduction of the amide I and amide II peaks, indicating that Hg(II) binds with HSA at these two binding sites. Mercury has strong affinity for thiol (sulfur) containing groups. Therefore, Hg(II)–HSA complexation can potentially occur through metal–sulfur linkage with involvement of C=O and/or C–N groups of amide I and amide II residues of HSA molecules. Other factors, including a charge transfer, may also influence Hg(II)–HSA complexation.

FT-IR spectra of HSA and Hg(II)-HSA complexes.
Figure 2 shows the UV-visible spectra of samples containing a fixed concentration (2 × 10⁻⁵ M) of HSA and varying Hg(II) concentration. HSA showed the characteristic HSA absorption λmax at 280 nm, with a molar absorption coefficient of 35 219 M−1cm−1. 2 The absorption at 280 nm is a result of an π→π* absorption transition of the lone pair electrons of the carbonyl and amine group of HSA tryptophan residue.2,54 The absorbance of HSA progressively decreased with an increase in Hg(II) concentrations in HSA samples.

UV-visible spectra of 2 × 10⁻⁵ M HSA and HSA solutions of varying Hg(II) concentrations ranging between 1 × 10⁻⁴ M Hg and 6.5 × 10⁻⁴ M Hg.
Figure 3 shows the emission spectra of samples containing a 2 × 0−5 M HSA concentration and varying Hg(II) concentrations. HSA is a highly fluorescent molecule because of its tryptophan residue, with an emission λmax at 350 nm. As expected, Hg(II) has no chromophore or fluorophore; therefore, Hg(II) showed no UV-visible absorption or fluorescent emission. The emission of HSA was notably quenched with an increase in Hg(II) concentration. It is of significant interest to note that the binding of Hg(II) with HSA resulted in a gradual blue shift of HSA emission λmax towards shorter wavelengths. The blue shift became more pronounced with increasing Hg(II) concentrations. The binding of Hg(II) with HSA obviously resulted in significant quenching of HSA emission. For instance, 2 × 10⁻⁴ M Hg(II) quenched HSA emission by approximately 20%. At 6 × 10⁻⁴ M Hg(II), nearly 45% quenching of HSA emission was observed for Hg(II). The binding of Hg(II) with HSA may result in protein agglomeration and induce HSA conformational or stereochemical changes. Human serum albumin protein agglomeration results in poor HSA solubility and/or precipitation in solution. Insolubility of HSA in solution will hinder effective transportation and delivery of necessary materials to the target. Also, changes in HSA conformation may influence HSA secondary structure and HSA stereochemistry. Changes in HSA stereochemistry may possibly hinder HSA chiral recognition ability and negate effective HSA binding of chiral metabolites or chiral drugs, ultimately affecting drugs utilization and drug therapeutic efficacy in humans.

Emission spectra of HSA and HSA solutions of varying Hg(II) concentrations:
Therefore, the determination of Hg(II) concentration in human serum albumin by multivariate regression analysis of fluorescence emission of Hg(II)–HSA complexes was explored. To achieve this goal, multivariate partial least squares (PLS-1) regression analysis was used to correlate changes in fluorescence emission of Hg(II)–HSA complexes in Fig. 3 with Hg(II) concentration in HSA samples. Detailed mathematical descriptions of multivariate regression calibrations in analytical spectroscopy for chemical analysis have been reported elsewhere.52,58,–61 In brief, a multivariate regression equation can be simplified and represented by Eq. 1:

where, y is the dependent variable [Hg(II) concentration in this study], x1, x2,…, xn are the independent variables (emission intensity at various wavelengths in this study), b0 is the intercept of the regression equation, and b1, b2,…, bn are the regression coefficients of x-variables. Equation 1 can be expressed in matrix notation as shown in Eq. 2.

where, [Y] contains the matrix values of the dependent variables for all samples, [X] is a matrix composed of values of the independent variables of all samples, and b contains the regression vector. In other words, the regression vector relates the independent and dependent variables. The goal in developing any regression model is to first determine the values of the regression vector using a data set of known independent and dependent variables, a process known as regression or model calibration. Once the value of the regression vector is established from the regression equation in the calibration phase, the value of the regression vector can then be combined with the independent variables of future unknown samples to predict the dependent variables of the future samples. This process is known as regression or model validation.
The first critical step in any multivariate regression analysis involves the removal of colinearity in the spectral data. Spectral data colinearity is typically eliminated using modern principal component analysis (PCA), where the original spectral data set is transformed and transposed to a new orthogonal variance scaled data set.55,–57 The principal components (PCs) in the new variance scale data set are orthogonal to each other, eliminating colinearity in the data set. In addition to the removal of colinearity, the dimensions of a data set are often reduced, allowing the use of fewer PCs to represent the data, ultimately eliminating the inherent noise in a data set. The next critical phase in a multivariate regression analysis is careful optimization of the regression models by selecting optimum wavelength regions where changes in spectra correlate most with analyte concentrations of interest.
The wavelength region between 288 nm and 500 nm was found to be the optimum wavelength region where Hg(II) concentrations correlated most with changes in the fluorescence emission of Hg(II)-HSA complexes. Using five principal components, the developed PLS1 model for Hg(II) from Hg(II)-HSA emission data resulted in a slope of 0.99464, a square correlation coefficient of 0.99464, and offset of 1.716 × 10* 6 . A perfect model would have a slope of 1, a square correlation coefficient of 1, and offset of 0. While the merit of the PLS1 model was significant, the practical application of any regression model is the ability of the model to predict analyte concentration. Figure 4 shows the plot of the actual Hg(II) concentration in the HSA sample versus the predicted Hg(II) concentration by the PLS1 model. Clearly, the predicted Hg(II) concentrations were in close agreement with the actual Hg(II) concentrations in HSA samples.

Plot of actual versus predicted Hg(II) concentrations in human serum albumin samples.
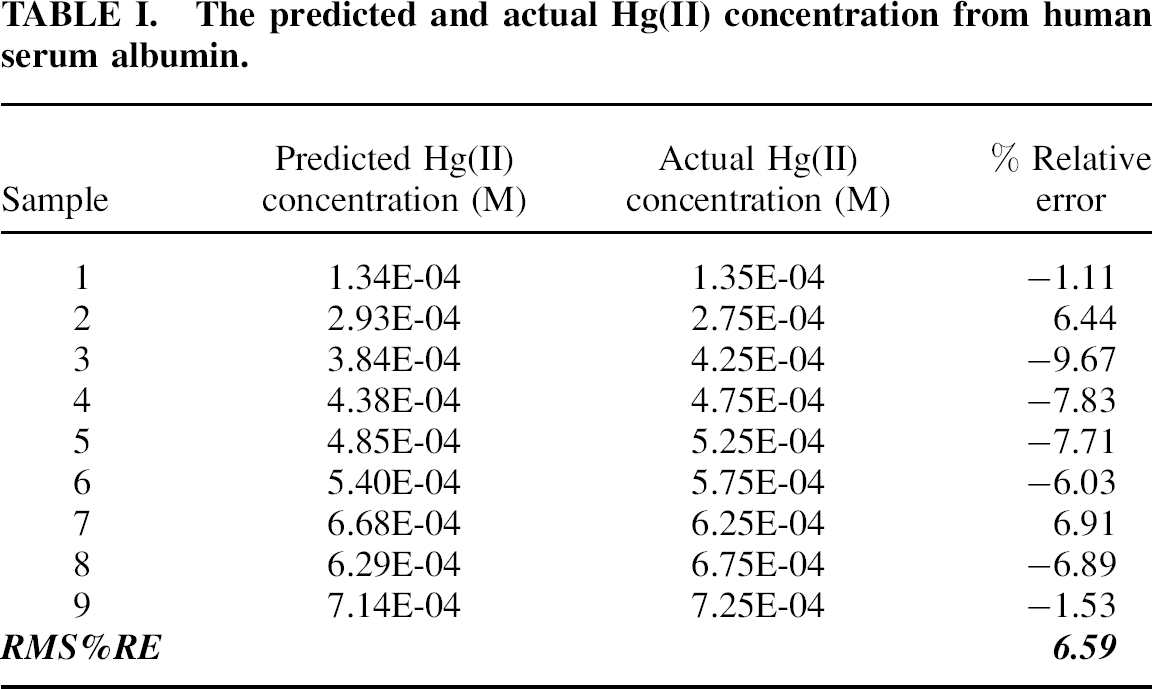
Table I shows the result of the predicted and actual Hg(II) concentrations in HSA of the independent test validation samples. The ability of the regression model to correctly predict the Hg(II) concentration in the HSA sample was evaluated by the root mean square percent relative error (RMS%RE). An RMS%RE of 6.59% was obtained for the prediction of Hg(II) concentration in HSA of the validation samples.
The predicted and actual Hg(II) concentration from human serum albumin.
The use of simple, rapid, and relatively inexpensive spectroscopy in conjunction with the multivariate regression analysis strategy reported in this study is promising. The techniques may be a viable alternative technique for rapid determination of Hg(II) concentration, particularly in biological samples. The practical utility of multivariate regression spectral analysis for direct determination of protein and water content in agricultural products with little or no sample preparation has been widely demonstrated.44,45 Additionally, multivariate regression analysis of spectral data is increasingly being used in biomedical, medical, and clinical studies for effective diagnosis of various cancer cells in complex biological matrices and for the determination of venous blood and muscle pH.46,50 The use of multivariate regression analysis of spectral data for analysis of muscle oxygen saturation with no sample pretreatment without influence from skin and fat has also been reported. 47 Another advantage of multivariate regression modeling is its robustness. The robustness of multivariate regression models for accurate prediction of analyte concentrations up to six months without recalibration has been demonstrated. 52 With further development and more studies, the reported multivariate regression technique for Hg(II) analysis in HSA samples used in this study can be adapted for the analysis of other toxic and volatile heavy metals such as arsenic. The method can also be employed to analyze other metals including Pb, Cd, Cr, Ni, or Co in HSA or other biological specimens.
CONCLUSION
Fourier transform infrared, ultraviolet-visible, and fluorescence spectroscopy were utilized to investigate the binding of Hg(II) with human serum albumin. In addition, this study reported the first use of fluorescence spectroscopy, guest-host HSA chemistry, and multivariate regression analysis in combination for the prediction of Hg(II) concentration in human serum albumin samples. The results of FT-IR analysis indicated the binding of Hg(II) at HSA amide I and amide II sites. In general, the binding of Hg(II) with HSA resulted in a decrease of HSA UV-visible absorption and dramatic quenching of HSA fluorescence emission. The developed PLS1 regression model from Hg(II)-HSA fluorescence emission data was able to correctly predict Hg(II) concentrations of independent validated HSA samples, with low root mean square percent relative error of prediction. The simplicity, rapidity, and low cost of the reported method in this study makes it a promising alternative method for a rapid determination of Hg(II) concentration in biological samples. The protocol reported in this study for Hg(II) analysis can also be adapted for the determination of other toxic heavy metals including As, Pb, Cd, Cr, Ni, or Co in HSA or other biological specimens.
Footnotes
ACKNOWLEDGMENT
The study was supported by NSF HBCU-UP: Award # 0927905.