
Abstract
Vibrational sum-frequency spectroscopy (VSFS) has been used for some time as a laboratory-based surface chemical analytical tool. Here, theoretical considerations in applying the method as a remote-sensing probe for detecting trace levels of chemicals adsorbed on surfaces are presented. Additionally, a VSFS instrument is configured to operate at a stand-off distance of 2.2 m using near-nadir incidence angles. This system was used to measure VSFS spectra for films of pure 1-amino-4-nitrobenzene (p-nitroaniline, PNA) and pure 2-hydroxy-1,3,5-trinitrobenzene (picric acid, PA) adsorbed on polished T-6061 aluminum alloy. These spectra are used to investigate the effect of optical polarization on the sum-frequency response of these compounds at nadir optical geometries. Detection limits for each compound are also estimated and found to be 0. 51 ig cm2 for PNA and 0.89 μg cm2 for PA. The implications of these results regarding remote sensing applications of VSFS are discussed.
INTRODUCTION
Modern laboratory-based analytical methods for trace detection of organic molecules on surfaces can detect specific compounds at the parts-per-trillion concentration level with excellent discrimination between target analytes and chemical interferents. However, most of these methods are not amenable to non-contact analysis with sub-second timescale response. Therefore, a method for rapid stand-off detection and identification of trace level contaminants adsorbed on surfaces would be useful in environmental, forensic, and homeland-security applications. Because electromagnetic radiation can be propagated for significant distances through the atmosphere, there has been considerable interest in developing stand-off detection methodologies using a variety of spectroscopic techniques. 1 However, the use of a second-order nonlinear optical technique of vibrational sum frequency spectroscopy (VSFS) as a method for stand-off chemical analysis has not been studied in detail.
VSFS was developed as a non-contact probe for studying surfaces and interfaces and the chemical composition, molecular orientation, and molecular conformation of molecules adsorbed on those surfaces and interfaces.
2
VSFS is based on the nonlinear optical process of sum-frequency generation (SFG). Conceptually, SFG is a second-order (or two-photon-mixing) process where the nonlinear interaction between the electric dipole of a molecule and two incident light beams with light of frequencies ω1 and ω2, respectively, leads to the generation of photons with frequency equal to the sum frequency (SF), ωSF = ω1 + ω2. This occurs because the electrical fields of the incident light create a second order polarization of the material whose components in the x, y, and z directions are given by3,4
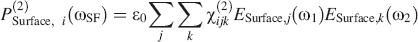
where P(2)Surface,i(ωSF) is the surface-bound component of the second order material polarization in the ith direction (with z being the direction normal to the plane of the surface and x and y defining the surface plane) at the sum frequency, ε0 is the vacuum permittivity, χ(2) ijk is ith, jth and kth component of the second order nonlinear susceptibility tensor χ(2), and ESurfacem,j(ω n ) is the jth component of the electrical field generated on the surface by the n′th incoming light beam. By convention, the indices of χ(2) ijk are interpreted so that i denotes the component of the SF polarization, j denotes the electrical field component of the first incoming beam (typically with a wavelength in the visible region), and k denotes the electrical field component of the second incoming beam (typically with a wavelength in the infrared region).
Because the tensor χ(2) describes a physical process, it must be invariant on inversion of coordinate systems in an isotropic media. However, being a third-rank tensor χ(2) must also satisfy the condition that when the coordinate system is inverted each χ(2) ijk comprising χ(2) must change sign. These symmetry considerations imply that in centrosymmetric media all elements of χ(2) are zero. As a result, in the electric dipole approximation SFG is forbidden and isotropic media such as fused silica or liquids do not generate an SFG response from the bulk phase.3,4 However, at the surface of an isotropic material or in an anisotropic bulk phase SFG is allowed because the symmetry is broken. This surface specificity has led VSFS to become an important tool for studying surface chemical processes.4,5
The coherent nature of SFG implies that the sum-frequency photons generated in reflection from a surface will propagate in a direction defined by conservation of momentum of the incoming beams. Assuming the incoming beams are propagating through air toward a flat planar surface and both beams lie in the same plane normal to the surface, the sum-frequency light will be emitted from the surface at an angle θSF defined by4,5

where nAIR(ω n ) is the index of refraction of air at the frequency ω n , kn is the wave numbers of the photons at frequency ω n , and θ n is the angle of the photons at frequency ω n (by definition, it is assumed that 1 corresponds to the visible photons and 2 is the IR photons). Here, kn is defined as the ratio of ω/c where c is the speed of light and the change in sign accounts for co-propagating beams (plus sign) or counter-propagating beams (negative sign). Equation 2 shows that the sum-frequency light generated at a surface will be highly directional and that if θ1 and θ2 are both zero, θSF must also be zero. This leads to the potential for SFG configurations in which the incident beams and return signal can be aligned to be both collinear and perpendicular to a planar surface (i.e., a nadir-looking configuration). These would be useful for stand-off use so that the signal can be generated and detected despite target distance.
Molecular specificity of SFG is achieved through resonance enhancement. Assuming ω2 is in the infrared (IR) region, when the energy of the IR photons matches the energy of molecular vibrations of molecules being irradiated, increases in the SFG signal of at least several orders of magnitude can occur. Therefore, by scanning the wavelength of one of the incoming laser beams across the infrared region, sum-frequency vibrational spectra of molecules exposed to the two laser beams can be generated. Compared to surface enhanced Raman spectroscopy (SERS), which also has been proposed for this application, 1 VSFS shares the benefits of being able to generate spectra with acquisition times on order of 10 s and in principle can be used in eye-safe configurations. Also, like SERS it is a non-destructive method where the analyte and substrate remain undamaged during analysis. However, VSFS can also be used in a fixed-wavelength configuration as a probe for the presence of specific molecules, in which case detection would take on order of milliseconds since acquisition of complete spectra would not be required.
Because of the high degree of surface specificity of SFG and the potential for developing VSFS as a remote sensing probe, proof-of-concept studies designed to show the efficacy of using VSFS in a nadir geometry configuration to detect trace levels of organic chemicals adsorbed on surfaces were conducted. In this paper, VSFS spectra of films of 1-amino-4-nitrobenzene (p-nitroaniline, PNA) and 2-hydroxy-1,3,5-trinitrobenzene (picric acid, PA) films adsorbed on a metal surface are presented and detection limits in terms of mass loading per square centimeter for each are estimated.
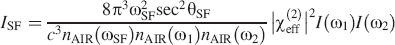
where c is the speed of light in a vacuum, I(ω
i
) is the intensity of the incoming light at ω
i
, and χ(2)eff is the effective nonlinear susceptibility defined as5,6
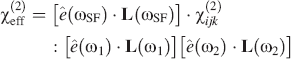
where ê(ω
i
) is the unit surface electric field vector for photons with frequency ω
i
and the elements of
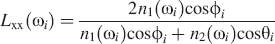
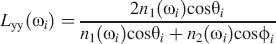
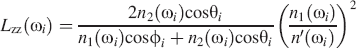
where the x and z directions define the plane of the incident laser beams and the reflected sum-frequency photons and n′(ω i ) is the refractive index of the interfacial layer as defined by Zhuang et al. 6 Equations 5, 6, and 7 can be used to expand Eq. 3 in terms of the specific elements of χ(2) that will contribute to the SFG signal for a given scattering geometry and polarization configuration of the incoming and reflected SFG beams.
In the special case of SFG configurations using a nadir geometry, all θ
i
are equal to zero. This leads to a relatively simple form for χ(2)eff as both s and p polarizations lie in the plane of the surface and all elements of χ(2) containing a z component of an electrical field unit vector will be zero (i.e., they contain sin(θ
i
) with θ
i
= 0). Therefore, for each polarization combination of the two incoming beams pp, ss, ps, and sp (defined so that p polarization is collinear with the x-axis and s is collinear with the y-axis), only two elements of χ(2) will contribute to the signal. For the polarization combinations ss and ps, χ(2)eff is given by
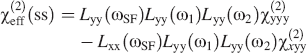
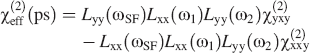
where it should also be noted that in a nadir geometry the two additional polarization configurations, sp and pp, have functional forms that are identical to Eqs. 8 and 9 but with y substituted for x and vice versa. Because the only elements of χ(2) that are nonzero for isotropic interfaces have a z component,5,6 Eqs. 8 and 9 also show that nadir optical configurations require planar nonisotropic surfaces to generate SFG signals. This implies that stand-off geometries would not be particularly useful for study of most common liquid surfaces. This result is consistent with the theoretical work done by Gan et al. 7 showing that the SFG signal intensity from the surface of liquid methanol decreases to zero as incidence angle decreases to zero.
In addition to relating the intensity of the SF signal to the incoming light intensities and the optical geometry, χ(2) also contains its dependence on the chemical speciation of the surface. In particular, χ(2) is a function of the second-order nonlinear susceptibility of the substrate, the susceptibility of molecules adsorbed to the surface, and any resonances between electronic or molecular vibrational energy transitions of the adsorbed molecules and the energy of the incident photons. It is these resonances that make VSFS possible, for when the energy of one of the incident photons matches the energy of a vibrational transition a large increase in the SF signal can be observed.
The macroscopic nonlinear susceptibility of the surface defined by χ(2) must be related to the nonlinear polarizability of the individual molecules adsorbed on the surface, β(2), in order to calculate signal intensities. In general, χ(2) and β(2) are related by
7
where NS is the number density of molecules on the surface having a second-order nonlinear response defined by β(2) and Rll, Rmm, and Rnn, are the three elements of the Euler rotation matrix transforming the molecular coordinates a, b, and c into the laboratory coordinates x, y, and z.
The behavior of β(2) when the frequency of one of the incoming laser beams is near the frequency of a vibrational band determines the SFG response used to make VSFS measurements. Near a vibrational resonance, it can be shown that β(2) can be estimated from the Raman and vibrational transition moments using
5
where Mαβ is the Raman transition moment along the a-b coordinates of the molecule and Aγ is the infrared transition moment along the c coordinate of the molecule, ω v is the frequency of the vibrational transition, ω2 is the frequency of the incoming beam, and γ−1 is the relaxation time of the excited state. Although it is possible to calculate Map and Ac from perturbation theory, 8 discussion of this is beyond the scope of this paper. Equation 11 shows that a general selection rule of VSFS is that for a particular vibrational transition to be active in SFG, it must be active as both a Raman band and an infrared band. Equation 11 also can be used to obtain quantitative information concerning the spectral properties of VSFS resonances. 5
VSFS is commonly used in laboratory settings with distances between the transmitting optics, detectors, and sample of at most a few tens of centimeters and incidence angles of 45° or higher.4,5 However, it has not been demonstrated that sum-frequency signals can be generated or detected with samples located a few meters from the transmitting and receiving optics or with near-nadir optical configurations that would be required for remote sensing applications. Nor has it been shown that there are classes of compounds whose presence can be detected at trace levels using these near-nadir optical geometries.
EXPERIMENTAL
Demonstrating that SFG emissions from contaminants on surfaces can be detected using optical configurations with very small incidence angles is the primary goal of this work. A secondary objective is to determine detection limits in terms of average mass concentration per unit surface area when working at stand-off distances. The near-nadir optical configuration used in these experiments was laid out on a 1.2 m by 3.6 m optical table as shown in Fig. 1. It provided a maximum standoff distance of 2.2 m, which is defined to be the distance between the final optical element in the transmitting optics and the target (the distance between the target and the first optical element in the receiving optics was 2.5 m).
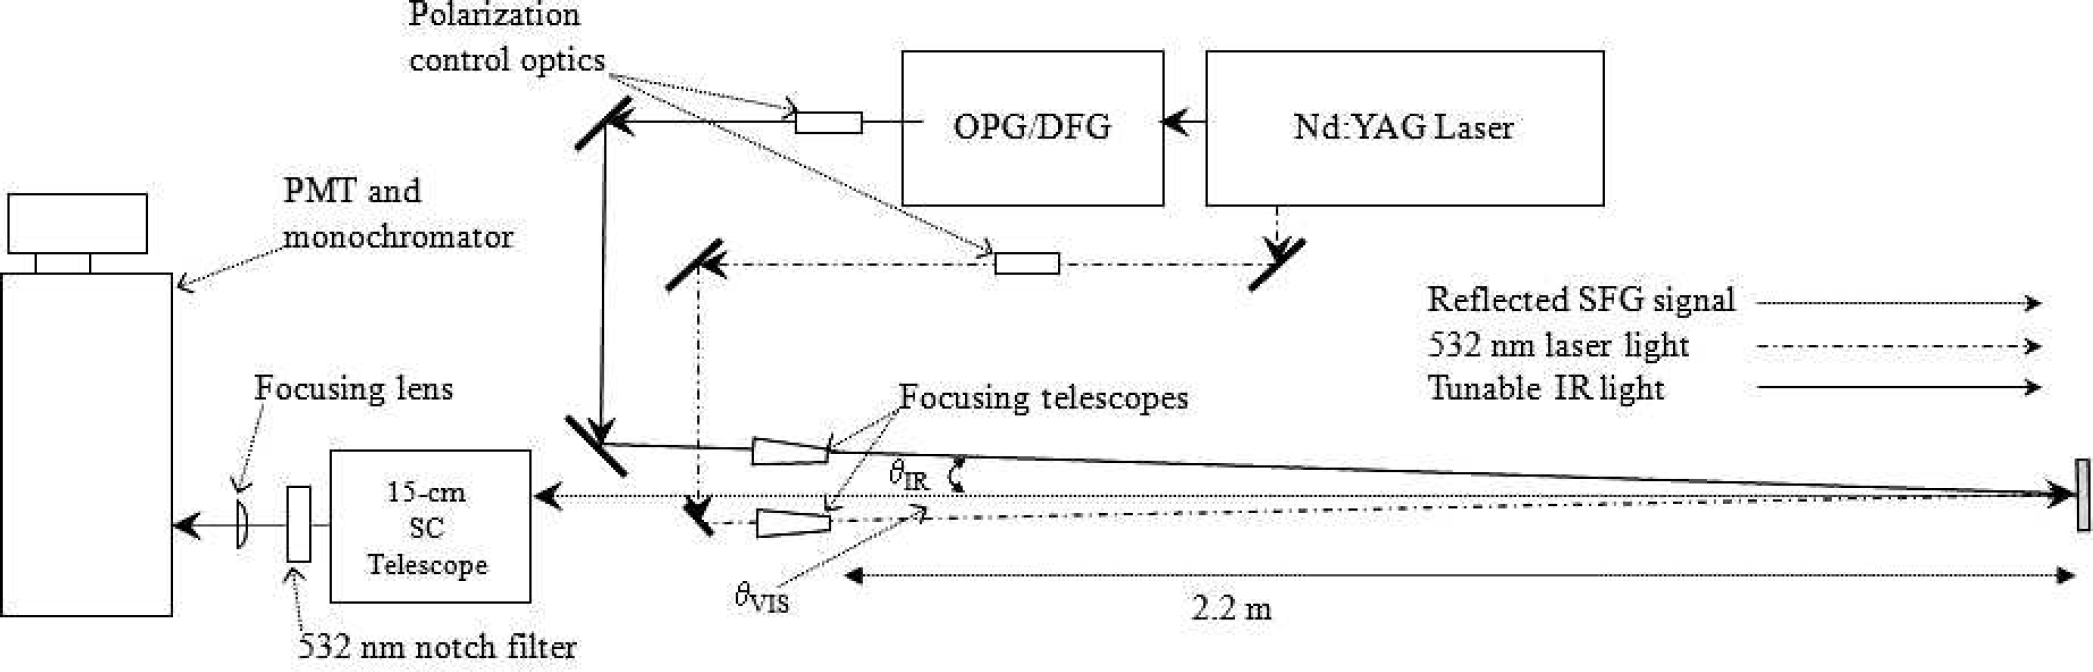
Schematic diagram of the optical arrangement used to demonstrate stand-off detection of trace levels of chemicals adsorbed on surfaces using VSFS. The optical geometry was configured for near-nadir incidence angle with the details provided in the text.
Tunable IR pulses in the wavenumber range from 1250 cm−1 to 1400 cm−1 (8.00 μm to 7.14 μm) with a spectral width of 6 cm−1 and energies of 100 μJ and durations of 30 ps were generated using a mode-locked Nd : YAG laser (Model 2241A, Ekspla, Vilnius, Lithuania) driving an optical parametric generator/difference frequency generator (Model 301/DFG, Ekspla). The second harmonic of the Nd : YAG laser at a wavelength of 532 nm was used as the visible beam for the sum-frequency measurements. To correct for fluctuations in the pulse energies of the 532 nm and IR beams, the intensities of both the IR and 532 nm pulses were monitored using fast-response silicon photodiodes.
The incoming laser beam at 532 nm was focused to a spot of approximately 0.5 mm diameter on the target using a 10X beam expander (BE10M-A, Thorlabs, Newton, New Jersey). Similarly, a Galilean telescope consisting of a CaF2 planoconvex lens and a CaF2 plano-concave lens was used to focus the tunable IR light to a spot size of approximately 0.5 mm on the target. Both CaF2 lenses were uncoated to provide at least 92% transmission to wavenumbers as low as 1250 cm−1. The primary detection optic to collect the SFG emissions from the target was a 15 cm Schmidt-Cassegrain telescope (Model C6-SGT, Celestron, Torrance, California). The output of the telescope was transmitted through a dielectric notch filter to reject reflected 532 nm light, then focused onto the slit of the monochromator (Model MS 2001, Solar-Tii, Minsk, Belarus) using a plano-convex lens. The SFG light was detected using a photomultiplier tube (Model R7899, Hamamatsu Corp., Iwata, Japan) and a proprietary correlated double-sample amplifier circuit designed and manufactured by Ekspla. All data acquisition and instrument control were performed using proprietary software from Ekspla.
Equation 2 shows that the angle at which the SFG emissions will occur is determined mainly by the path of the 532 nm beam because the momentum of the 532 nm photons is much larger than the momentum of the IR photons. Therefore, the optical arrangement in Fig. 1 was chosen both to simplify changing the working distance and so that the reflected SFG signal could be detected at near-nadir viewing angles. The turning mirror and focusing telescope for the 532 nm laser beam were mounted to be co-axial with the centerline of the telescope whose central aperture was already blocked by the secondary mirror of the telescope. Because the center of the telescope aperture was blocked, the target surface was rotated −0.3° with respect to the telescope axis and offset from the centerline of the telescope so that the emitted SFG light would be offset from the centerline of the telescope by approximately 3 cm but remain parallel to its axis. Defined relative to the telescope axis, θ2 and θ- for the stand-off geometry were 1.4° and −0.2°, respectively. Following Eq. 2, for an IR wavenumber of 1300 cm−1, the SFG light will be emitted with an angle of approximately −0.1°.
In a conventional laboratory VSFS instrument, the incidence angles of the IR and 532 nm beams with respect to the surface normal of the target, θ1, and θ2, respectively, are on order of 57°. Therefore, θSF will be approximately −57°, which is the direction of the specularly reflected 532 nm light.
The presence of water vapor in the atmosphere affects its transmissivity with respect to IR light, especially in the range of 2000 cm−1 to 1400 cm−1. Therefore, compounds chosen for use in this study were selected based on their having an SFG-active vibrational band at a wavenumber lower than 1400 cm−1. In particular, it is known that the symmetric stretch of organic nitro groups (R–NO2) occurs in the range of 1360 cm−1 to 1270 cm−1. Therefore, two compounds having nitro-group functionality were used: 1-amino-4-nitrobenzene (p-nitroaniline, PNA) and 2-hydroxy-1,3,5-trinitrobenzene (picric acid, PA). These compounds were obtained as reagent-grade samples and solutions of each dissolved in methyl alcohol at a concentration of 1 mg cm−3 were prepared. Thin films of each compound were formed on the substrates studied by adding 10− cm3 aliquots to the surface and allowing the solvent to evaporate. Given the extremely low vapor pressures of both PNA and PA (2.0 × 10⁻⁵ atm and 6.1 × 10⁻¹² atm, respectively, at 293 K as calculated using SIMPOL.19), it was assumed that no sample was lost to the atmosphere in this process.
Accurate calculation of the mass of sample per unit of surface area required digital image analysis of microphotographs of samples prepared as described above. Figure 2 shows images of PA and PNA samples on different substrates taken using a standard compound microscope adapted to a Hitachi KP-120F megapixel monochrome CCD camera using a 2X camera adaptor. The left image is 10 μg of PA deposited on a polished aluminum surface, the middle image the same total mass of PA deposited on a fused silica surface, and the right image is 10 μg of PNA on a fused silica surface. The total patch diameter in each case was approximately 1.2 cm. The image shown in Fig. 2 taken of the polished aluminum surface was lit from above using reflected light. These were found to be impossible to segment in terms of surface area coverage of PA because of the large range in brightness. Therefore, for calibration purposes, a series of samples of PA and PNA were prepared using fused silica substrates so that the samples could be photographed using backlit illumination. Microphotographs such as the middle and right images were then subjected to digital image analysis to determine the average fractional area of the surface that was covered by crystals of the sample. The total mass deposited was then divided by product of the total sample area and the fractional area of crystal coverage. This could be turned into an equivalent surface thickness in terms of average number of molecules using the known densities of PA and PNA.
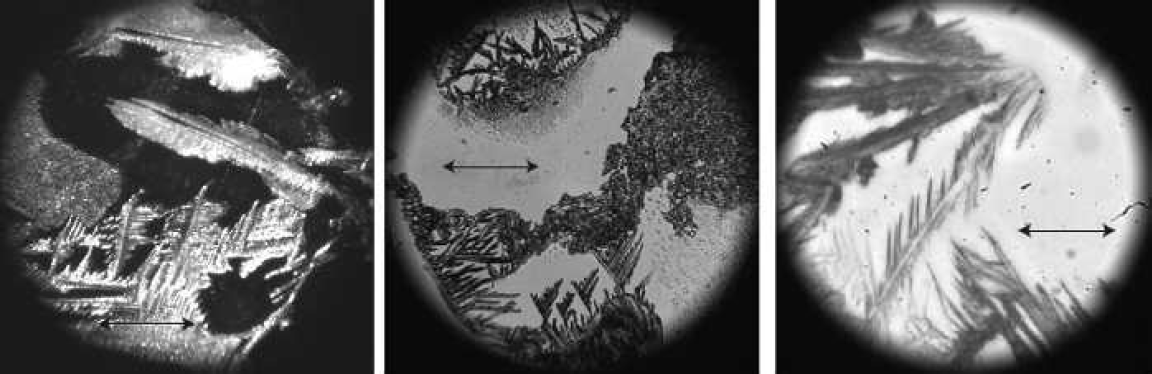
Images of 1-amino-4-nitrobenzene (p-nitroaniline, PNA) and 2-hydroxy-1,3,5-trinitrobenzene (picric acid, PA) deposited on surfaces by the droplet evaporation method. The left-hand image is a 200X microphotograph of a polished aluminum surface with a 10 × 10−3 cm3 of a 1 mg cm−3 solution of PA added to it. In this image the PA crystals are the white and gray areas because the surface is illuminated by reflection. The middle image is the same magnification and the same total mass of PA but deposited on a fused silica surface. The lighting in this case is from beneath so the crystals are seen as the dark areas. The right-hand image is 10 × 10−3 cm3 of a 1 mg cm−3 solution of PNA deposited on a fused silica surface. The images show that both PA and PNA are distributed non-uniformly across each type of surface in the form of discrete crystals rather than as an amorphous thin film. The solid black arrow shows a scale distance of 100 μm, with the image area being approximately equal to the diameter of the VSFS interrogation circle.
VSFS spectra of samples of each compound deposited on polished T-6061 aluminum alloy substrates were taken using both the “stand-off” geometry shown in Fig. 1 and a conventional “laboratory” optical geometry where θIR and θVIS were both approximately −57° (in the case of the laboratory geometry, the SFG emissions were emitted at an angle of approximately 57°). The samples were prepared as described above, where a small volume of a solution containing the dissolved analyte was allowed to evaporate. Spectra were recorded over the wavenumber range 1250 cm−1 to 1400 cm−1, which spanned the symmetric –NO2 stretch of both PA and PNA. Approximately 10 μJ per laser pulse of 532 nm radiation and 100 μJ per laser pulse of IR radiation were used for both the stand-off and laboratory measurements (IR pulse energies were measured using a Fieldmaster GS meter (Coherent, Santa Clara, California) and a Coherent LM-P-209 energy sensor). SFG emissions from 100 individual laser shots were collected every 1 cm−1 and averaged. These averaged SFG counts were then normalized by dividing by the average power of the 532 nm beam multiplied by the average power of the IR beam.
The optical polarizations used for the laboratory measurements were sss where by convention the first s refers to the polarization of the SFG light, the second the 532 nm laser, and the third the IR beam. This polarization combination was chosen because it represents only electrical fields that are parallel to the plane of the surface, which most closely matches the polarization combination used for the stand-off measurements. In the stand-off configuration, it is not possible to use an optical polarization that provides a component of the electrical field that is perpendicular to the surface. As a result, the s and p designations for the stand-off case refer to the two orthogonal directions in the surface plane. To maximize the SFG signal at the detector, both s and p polarized SFG emissions were collected for the stand-off VSFS experiments. Because of this, the symbol “t” for “total signal” will be used in place of s or p to specify the polarization components of the SFG signals. For example, the polarization configuration tss implies the total SFG signal (both s and p polarizations) generated by s-polarized 532 nm light and s-polarized IR light.
RESULTS AND DISCUSSION
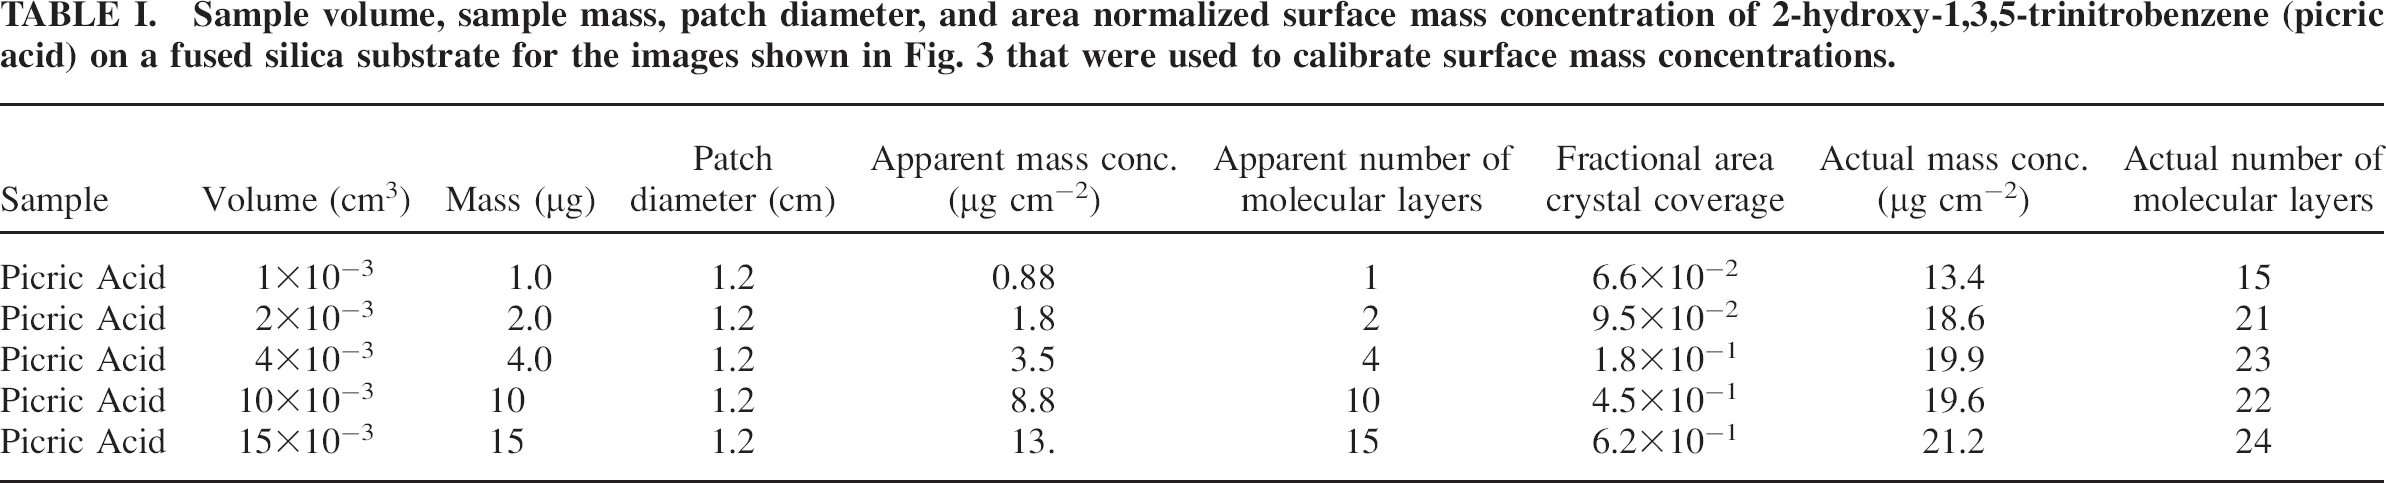
Preparing samples for VSFS analysis by evaporation of solutions as done here results in a surface containing a non-uniform coverage of sample in the form of randomly oriented microcrystals. This will have relevance in understanding both the surface SFG response for the different experimental geometries and the detection limits for these materials using VSFS. The microphotographs shown in Fig. 3 can be analyzed using techniques similar to that used for determining fractional area whitecap coverage 10 to determine the area coverage of the crystals as a function of nominal mass concentration. Figure 4 is a plot of fractional area surface coverage of PA crystals plotted as a function of the apparent surface mass concentration. This shows that for the mass loadings used here the PA did not spread as a uniform surface layer but as discrete and aggregated crystals whose coverage increases linearly with overall mass. Table 1 lists the apparent mass concentrations, apparent sample layer thicknesses, measured fractional area surface coverage of crystals, area normalized mass concentration, and area normalized layer thickness. The apparent layer thickness is calculated to increase from being a monomolecular film to one that is tens of molecules thick. In contrast to the apparent thickness, when normalized by surface area coverage the actual layer thickness is nearly uniform with a minimum thickness of 15 molecules and a maximum of 23 molecules, corresponding to a surface structure dominated by small crystals with thicknesses on order of 100 nm (i.e., thin compared to the optical wavelengths but thick in terms of the nonlinear optical characteristics).
Sample volume, sample mass, patch diameter, and area normalized surface mass concentration of 2-hydroxy-1,3,5-trinitrobenzene (picric acid) on a fused silica substrate for the images shown in Fig. 3 that were used to calibrate surface mass concentrations.
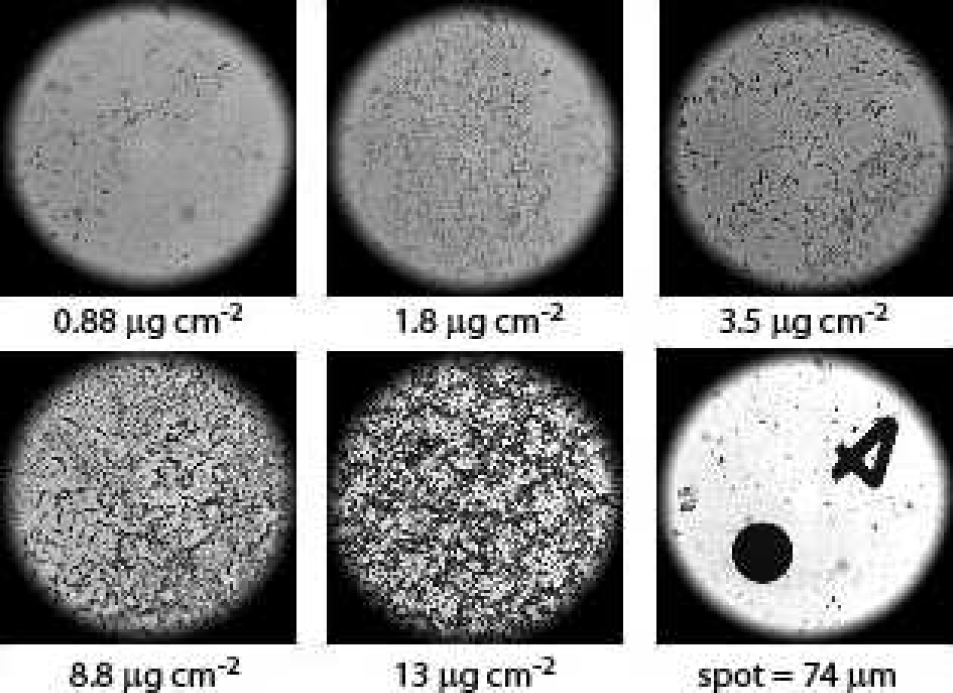
A series of images of 2-hydroxy-1,3,5-trinitrobenzene (picric acid) on fused silica substrates used to calibrate the actual mass per unit area of the samples on the substrates. These images were photographed using backlighting so the areas with sample are shown as the dark patches and areas containing no sample are bright white. The apparent surface mass concentrations from Table 1 are given below each image and the last image is a scale reference of the “4” globe of a Patterson Globe reticle, which is 74 μm in diameter, taken at the same magnification as the other images.
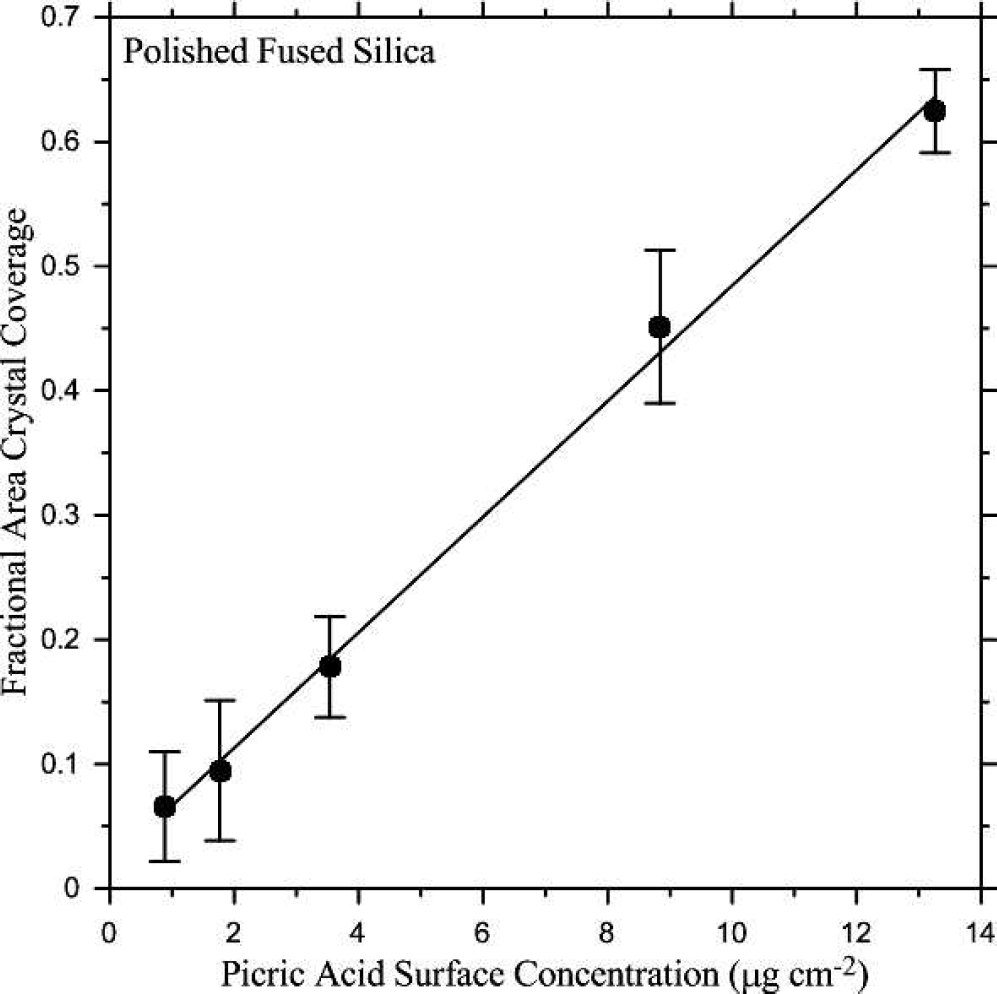
Plot of the fraction of total surface area covered by crystals as a function of apparent surface concentration of 2-hydroxy-1,3,5-trinitrobenzene (picric acid) as determined by image analysis of the microphotographs shown in Fig. 3.
Figure 5 shows VSFS spectra of PNA and PA for the laboratory optical geometry for the polarization combination of sss and for the polarization combinations of tss and tsp for the stand-off geometry. The area-normalized surface concentration for both PNA and PA was 20 μg cm−2, corresponding to an equivalent layer thickness of approximately 100 nm or 20 molecules assuming a molecular thickness of 5 nm. The SFG intensity, ISFG, has been normalized by dividing the intensity at a particular wavelength by the maximum intensity for that spectrum. The existence of a measurable SFG signal at nadir incidence angles for each compound using the stand-off geometry is explained by the fact that the SFG response is from a thin layer of crystals of material (see Fig. 2 and Fig. 3) rather than an isotropic thin film. The large nonlinear response of these samples demonstrates the crystals are noncentrosymmetric and that the signal is being generated in the crystalline bulk phase. However, for these types of samples it is clear that stand-off geometries can produce large SFG signals that can be used for detection and spectroscopic analysis.
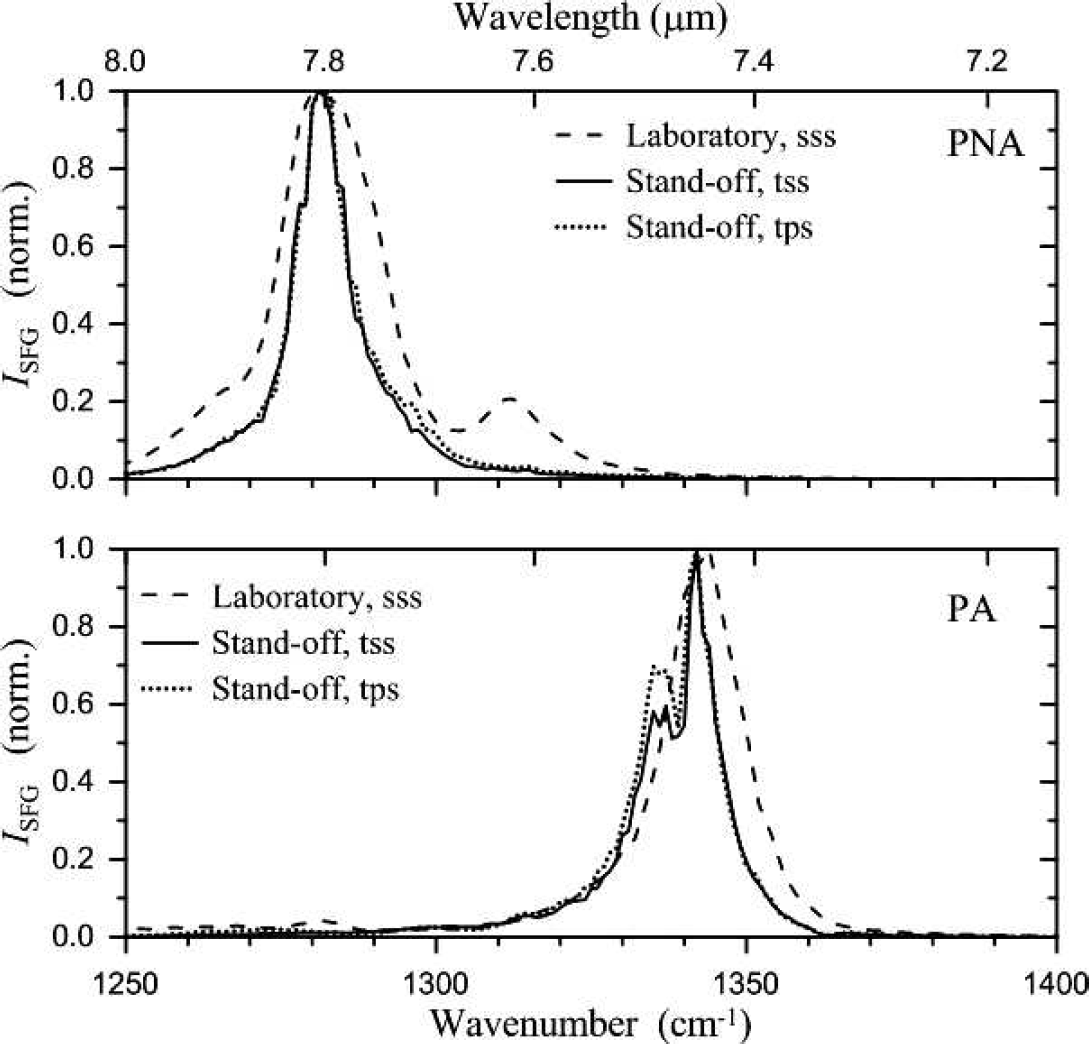
VSFS spectra of 1-amino-4-nitrobenzene (p-nitroaniline, PNA) and 2-hydroxy-1,3,5-trinitrobenzene (picric acid, PA) adsorbed on polished T-6061 aluminum alloy. The dashed curves show data for the laboratory configuration taken at close range where the incidence angle for both the 532 nm and IR beams was 57° and the polarization was sss (SFG, 532 nm, IR). The solid curves show data for the stand-off configuration with incidence angles for the 532 nm and IR beams of 0° and 1.7°, respectively, taken at a range of 2.2 m where the polarization was tss. The dotted curves show data for the stand-off configuration taken at a range of 2.2 m where the polarization was tps.
The large nonlinear response from PNA or PA samples such as these is unsurprising given that crystals of either are noncentrosymmetric11,–13 (in particular, PNA crystals are used as nonlinear optical elements because of its high nonlinear optical susceptibility 11 ). Furthermore, previous studies have demonstrated that samples consisting of noncentrosymmetric crystals14,15 or a thin layer of noncentrosymmetric crystals 16 produce large sum-frequency responses. Unfortunately, interpreting these spectra in terms of molecular orientation, molecular conformation, or bulk crystal structure is not as straightforward as interpreting surface SFG data because Eqs. 8 and 9 do not describe a bulk-phase SFG response and the equivalent relations are much more complicated.
Modeling the laboratory VSFS spectra for PNA and PA using linear combinations of Eq. 11 as suggested by Lambert et al. 4 can be done to determine locations of the major peaks 14 .
This shows that for the spectra in Fig. 5, the main peak for PNA occurs at 1282 cm−1 and at 1342 cm−1 for PA. These values are in good agreement with literature values for the resonance of the symmetric —NO2 stretch using Raman and IR for PA and using Raman for PNA.17,–19 (The IR spectrum of PNA in this region is anomalous 20 and the observed IR peaks do not correspond to the observed VSFS peaks.) However, modeling the PNA VSFS spectra using Eq. 5 identifies three resonances at 1263 cm−1, 1282 cm−1, and 1313 cm−1 and these match the observed solid-phase Raman transitions of PNA in the region. 17 Using Raman spectroscopy, Lewis et al. 18 found the symmetric -NO2 stretch for PA occurs at 1345 cm−1, which agrees with the modeled peak wavelength of 1342 cm−1. The spectra show that for both PA and PNA the wavelength where the maximum value of 1SFG occurred is not affected by the optical geometry or by the polarization components of the incoming light. This demonstrates that in terms of wavelength VSFS spectra taken at nadir geometries would provide robust estimation of spectral features simplifying use of the method as a trace detection technique.
Although the wavelength of the nitro-group resonance is invariant with optical polarization, polarization does affect absolute SFG signal intensities. Figure 6 shows 1SFG for the stand-off spectra in Fig. 5 where the SFG intensities have not been normalized to a maximum value of one. Here is it seen that although the peak wavelength is independent of polarization, 1SFG is not and spectra taken using the tss polarization combination (i.e., 532 nm and IR electric fields parallel to each other) have higher peak intensity than spectra taken with the tps combination (i.e., 532 nm and IR electric fields perpendicular to each other). It is also seen that this effect is much more pronounced for PNA than PA with the ratio the maximum in 1SFG for tss to the maximum in 1SFG for tps being a factor of 5 for PNA and a factor of 1.5 for PA.
VSFS spectra for 1-amino-4-nitrobenzene (p-nitroaniline, PNA) and 2-hydroxy-1,3,5-trinitrobenzene (picric acid, PA) adsorbed on polished T-6061 aluminum alloy showing absolute SFG intensities as a function of optical polarization for the stand-off geometry with incidence angles for the 532 nm and IR beams of 0° and 1.7°, respectively, taken at a range of 2.2 m. The solid curves are spectra (tss) taken with the 532 nm and IR beams both having s polarization (i.e., electric fields parallel to each other and in the plane of the surface). The dotted curves are spectra (tps) taken with the 532 nm beam having p polarization and the IR beam having s polarization (i.e., electric fields perpendicular to each other and in the plane of the interface).
It is clear that in terms of detection limits the tss polarization combination is preferred for stand-off detection of trace contamination because it provides higher signal return. Therefore, detection limits were estimated for the tss polarization configuration. Figure 7 shows 1SFG measured using the stand-off optical geometry for PNA adsorbed on a polished T-6061 aluminum substrate measured at a wavenumber of 1282 cm−1. In Fig. 7 ISFG has been normalized so that a value of unity represents the approximate detection limit of the method. When plotted as a function of the apparent surface mass concentration, ISFG is linear down to surface concentrations of a few tenths of a microgram per square centimeter. The least-squares linear regression shown in the figure predicts a minimum detection limit of 0.51 μg cm−2. However, ISFG = 20.3 for the lowest surface concentration of 0.2 μg cm−2, which is well above the nominal detection limit of 1. Given the heterogeneous surface distribution of material on the surface at low mass loadings (see Fig. 3), it is possible the high response at the lowest concentration was due to selecting an area of the surface with a relatively high local surface area coverage of crystals. The SNR of PNA was very large, calculated to be on order of 1000 at the lowest concentration (i.e., ISFG = 1000 counts with a noise level of 30 counts).
Plot of the VSFS intensity measured at 1282 cm−1, ISFG, for 1-amino-4-nitrobenzene (p-nitroaniline, PNA) plotted versus its surface concentration on polished T–6061 aluminum alloy. ISFG has been normalized to incident power so that a value of unity represents the minimum signal that could be detected using the stand-off optical system shown in Fig. 1. The solid line represents a least-squares linear regression of the data showing a theoretical minimum detection limit of 0.51 μg cm−2. Error bars represent ±1 σ of ISFG measured within 6 6 cm−1 of 1282 cm−1 of three spectra taken at different locations on the same sample.
Figure 8 is similar to Fig. 7 except it shows ISFG for PA. As was observed for PNA, the SFG response of PA is also linear with surface concentration and the linear regression predicts a sub-microgram per square centimeter detection limit of 0.89 μg cm−2. At the lowest surface concentration of PA the SNR was 53 (i.e., power normalized ISFG = 223 ± 100 counts with a noise level of 30 counts).
Plot of the VSFS intensity measured at 1342 cm−1, ISFG, for 2-hydroxy-1,3,5-trinitrobenzene (picric acid, PA) plotted versus its surface concentration on polished T-6061 aluminum alloy. ISFG has been normalized to incident power so that a value of unity represents the minimum signal that could be detected using the stand-off optical system shown in Fig. 1. The solid line represents a least-squares linear regression of the data showing a theoretical minimum detection limit of 0.89 μg cm−2. Error bars represent ±1σ of ISFG measured within 6 6 cm−1 of 1342 cm−1 of three spectra taken at different locations on the same sample.
In both Fig. 7 and Fig. 8 the SFG response from the surface is linear with increasing surface concentration. This is problematic because Eqs. 3 and 10 imply that the SFG response from a surface should increase as the square of the surface concentration. However, as was seen above, both PNA and PA do not form thin films on the aluminum substrate and the relations for surface response do not apply. For these samples, the SFG signal is more likely determined by total mass of crystals in the laser beams. Because the data in Table 1 show the crystals were of near uniform thickness, their total volume (and mass) is proportional to their fractional area coverage. Figure 4 shows crystal area coverage increases linearly with surface concentration and this would explain the linear correlation of the SFG signal with concentration.
CONCLUSIONS
It has been shown here that it is possible to generate and detect vibrational sum-frequency generation emissions from trace-level contaminants adsorbed on metal surfaces at nearnadir incidence angles at stand-off distances relevant for environmental, security, and forensic applications. Although it remains to be established whether environmental contaminants such as the products from photochemical smog will interfere with VSFS detection, whether the method can be extended to compounds other than those containing nitro-group functionality, and whether contaminants of interest are distributed as noncentrosymmetric crystals on surfaces, these results indicate that with further development instruments based on VSFS could provide a realistic option for stand-off detection. Although it is probable that no single analytical method will provide a universally applicable approach to the wide range of problems involving stand-off detection of chemicals adsorbed on surfaces, VSFS presents another option that could be useful for specific classes of compounds.
Footnotes
ACKNOWLEDGMENTS
This research was supported by the Department of Homeland Security under contract 958318 through Johns Hopkins University and the Office of Naval Research under grant N00014-09-1-0983.