
Abstract
Ferron dosage ([Ferron]) is key to ferron-timed spectrophotometry (ferron assay). In order to clarify some important questions, the following studies were conducted: (1) The effect of [Ferron] on the sensitivity of total aluminum (AlT) determination was experimentally investigated and 27Al nuclear magnetic resonance (27Al NMR) spectroscopy was used to verify our developed Ferron assay; (2) the chemical equilibrium calculation was employed to analyze the effect of [Ferron] on the determination of AlT; and (3) the main reason for insufficient [Ferron] was further analyzed. This is the first study to standardize a ferron assay operating procedure.
INTRODUCTION
Spectrophotometric methods have often been applied to trace metal determination due to such advantages as accuracy and precision, low cost, and simple operation. The ferron assay is the most widely used method for AlIII determination in the field of water treatment. It can achieve the quantitative determination of AlIII and speciation of aqueous Al simultaneously;1–7 however, the major problem of this method is that a uniform and standardized operating procedure has not been established. 8
Ferron was first proposed for FeIII determination. Then, three main stages were established. The present ferron assay for the speciation of hydroxyl–Al and efficiency evaluation of Al-based flocculants was finally formed.
Generally, when spectrophotometry is used to measure a solution's absorbance, the colorimetric reaction in this solution must reach equilibrium. The dosage of the chromogenic agent is one of the important factors and directly influences the sensitivity of colorimetric determination.35–37 For the ferron assay, although many factors such as composition of ferron reagent, pH, the maximum absorption wavelength, and the way the reagent was added had been investigated, [Ferron] had never been explored. As a result, the ferron assay had not been normalized and unified. The objectives of this work were (1) to investigate the effect of [Ferron] on the sensitivity of AlT determination and ascertain optimal [Ferron], (2) to prove the correctness of [Ferron] proposed in this experiment by the chemical equilibrium calculation, and (3) to analyze the main reason of the insufficient [Ferron] in AlIII–ferron system.
EXPERIMENTAL
All chemicals were at least of analytical grade unless otherwise stated. Quartz doubly distilled water and polyethylene containers were used for the preparation of all aqueous solutions. The colorimetric studies were performed at 25 °C.
The stock standard solution of mononuclear aluminum (mononuclear Al; 0.223 M) was prepared by dissolving 0.601 g of Al power (99.99%, Shanghai, China) in 35 ml of HCl (1:1), and then diluted to 100 mL with water. The stock standard solution of NaAl(OH)4 (0.100 M) was prepared by dissolving 0.677 g of Al power (99.99%, Shanghai, China) in 35.0 mL NaOH (4.0 M) and then diluting it to 250 mL with water. Similar preparations of these reagents can be found elsewhere.12,39–41
Instrumentation. The UV-VIS 3600 Spectrophotometer (1 cm quartz cell; SHIMADZU, Japan), the DRX-500 superconducting nuclear magnetic resonance (NMR) spectrometer (Bruker, Germany), an inductively coupled plasma atomic emission spectrometer (ICP-AES; JA1100, Kempston Controls, USA), and the PHS-3B pH meter (Shanghai, China) were used to obtain the various measurements.

[Ferron]
The distribution of Al species, ferron, and Al-ferron complex at various pH values was calculated with MATLAB 7.0 software, and the step (ΔpH) was 0.01; meanwhile, the distribution of Al–ferron complex at pH = 5.2 under different [Ferron] obtained by the Eqs. (2) and (3), and the step (Δ[Ferron]) was 3 × 10⁻⁵ M.
RESULTS AND DISCUSSION
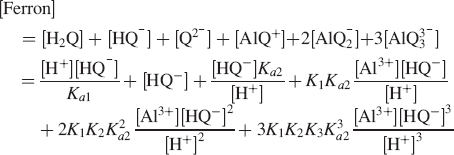
Effect of pH on the absorption spectra of ferron reagent and Al–ferron complexes. (
In order to further confirm the optimal pH of the AlIII–ferron reaction, four Al concentrations of the mononuclear Al solution were employed (Fig. 1d). The results indicated that the absorbance determined at 370 nm and pH 5.2 ± 0.2 was at the highest; moreover, in this pH range, the absorbance measured at 370 nm for ferron was near its minimum (Fig. 1b). Thus, the background interference was the weakest at this pH. The pH of 5.2 ± 0.2 is favorable for the ferron assay. The above experimental results were consistent with those reported in the literature.12,14,20
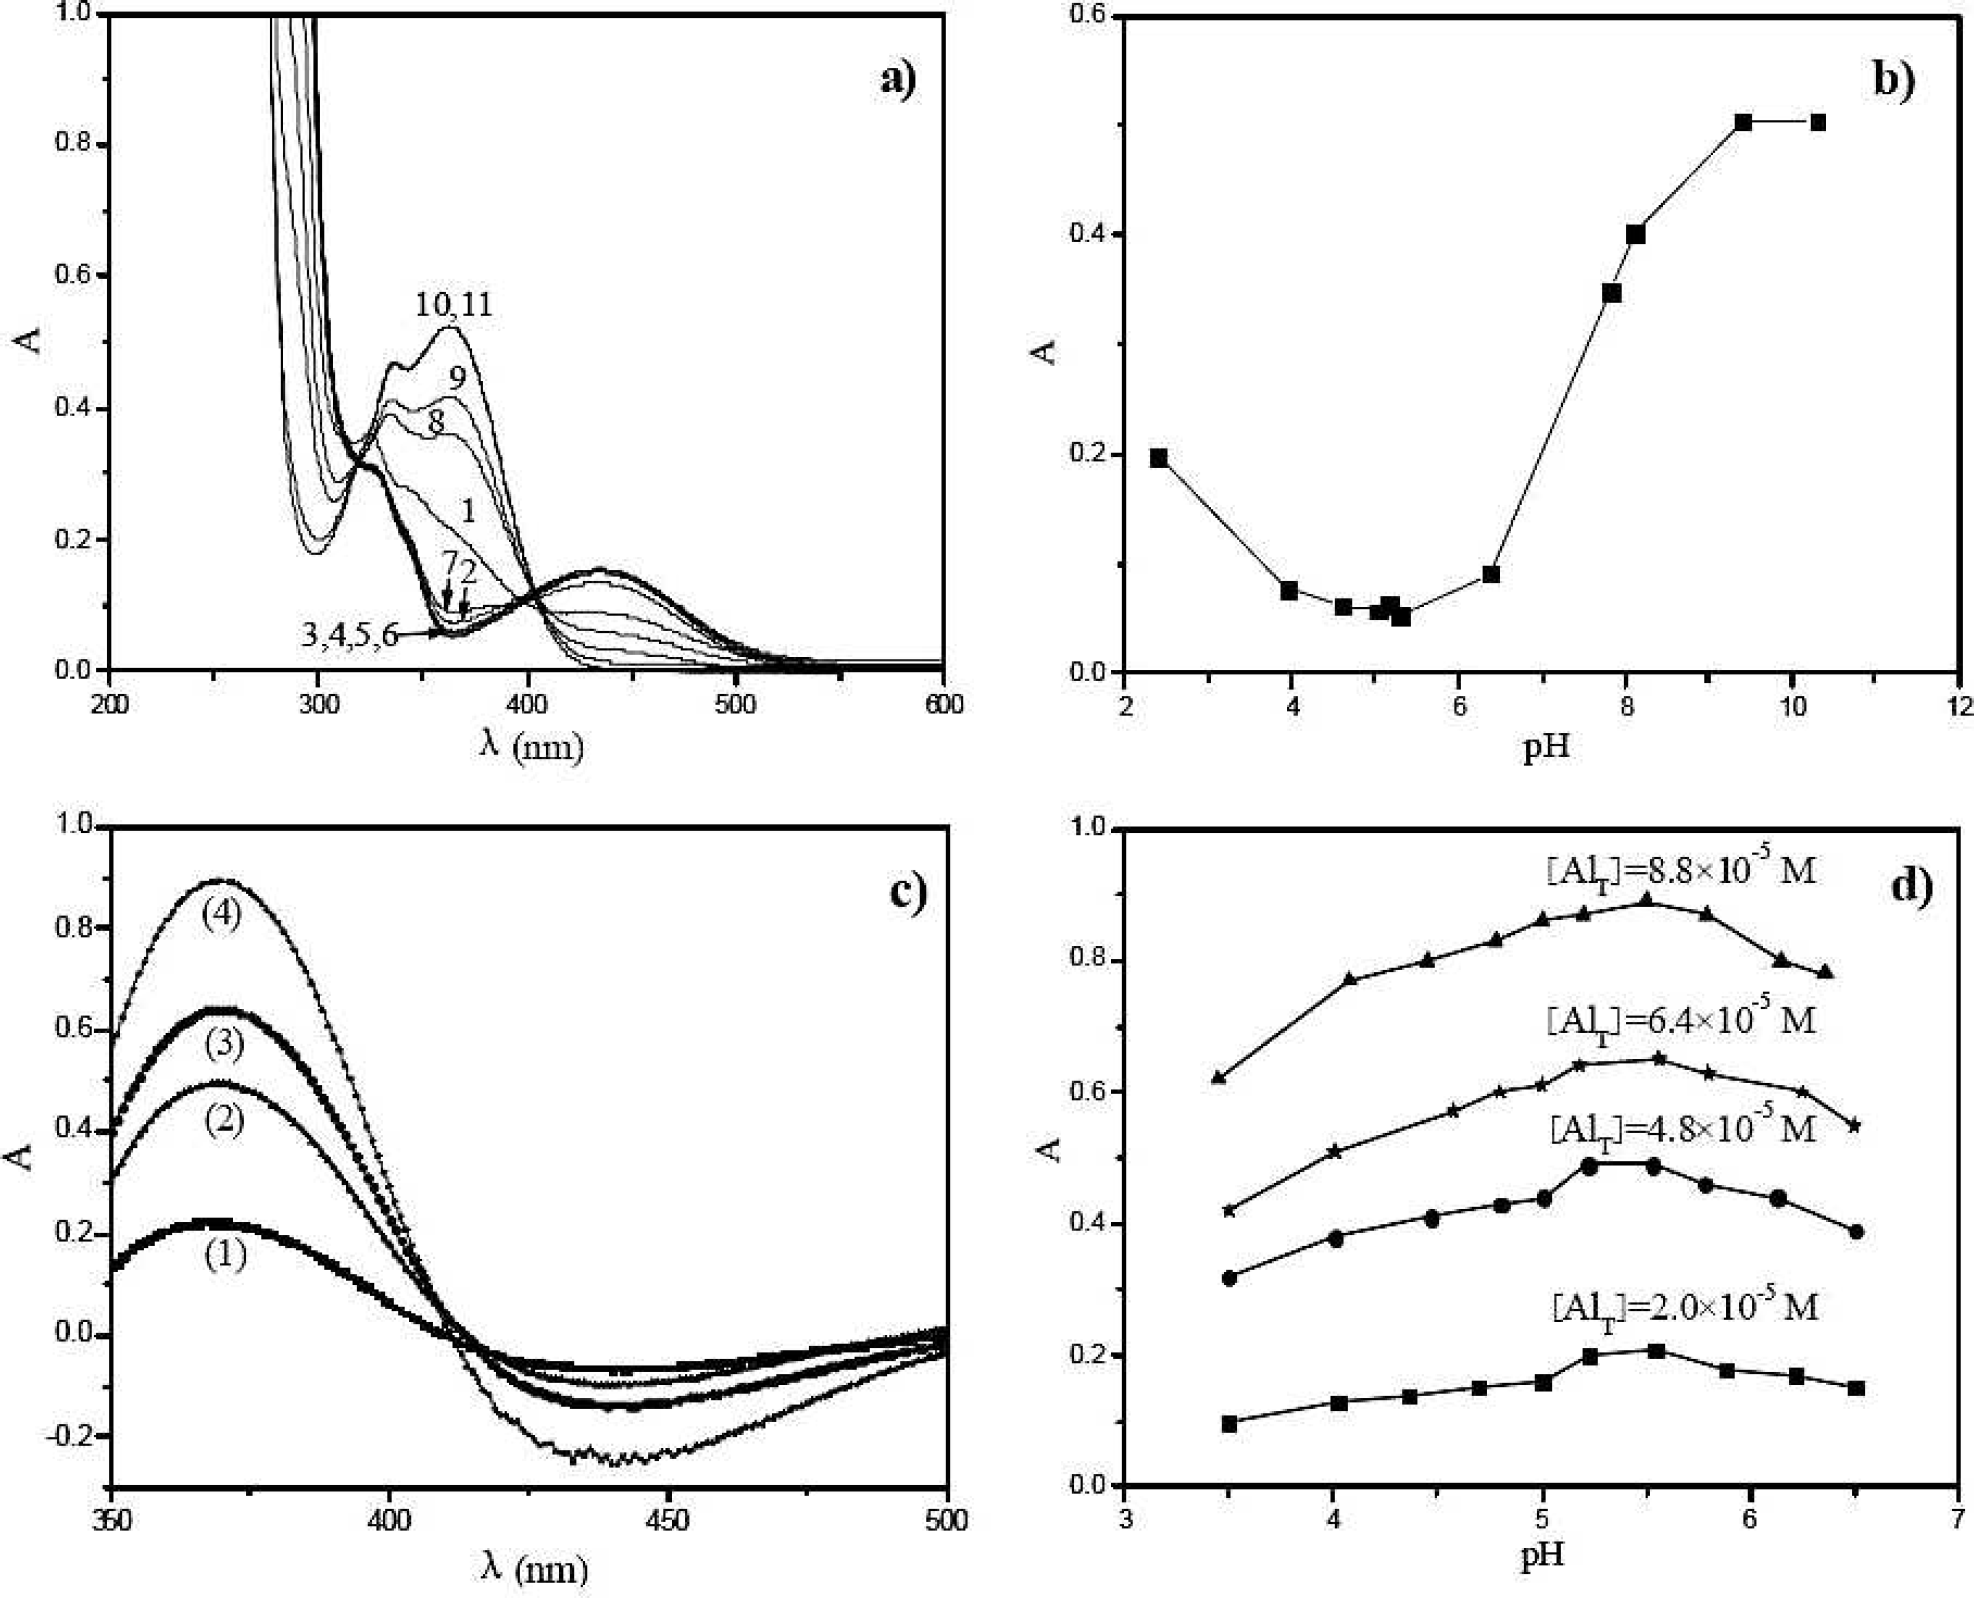
Effect of [Ferron] on the Sensitivity of Total Aluminum Concentration Determination. The change trend of absorbance determined at 370 nm with increasing [Ferron] was analyzed. As shown in Fig. 2a, the absorbance increased with increases in [Ferron], ranging from 2 × 10⁻⁴ to 2 × 10⁻³ M. Then, as the [Ferron] concentration rose, the absorbance basically kept constant and a platform presented, which implies that [Ferron] = 2 × 10⁻³ M was sufficient for Al determination, and all the AlIII in this color system could be converted to the stable complexes. Therefore, we can conclude that [Ferron] should be at least 2 × 10⁻³ M in order to ensure AlT measurement is the most sensitive when AlT is within 2.0 × 10⁻⁵ to 8.0 × 10⁻⁵ M. Jardine et al. 21 and Parker et al. 24 had been proposed the condition of [Ferron]/AlT ≥ 50. It was established according to the kinetic reaction characteristic and had nothing to do with the accurate selection of the colorimetric reaction condition. More importantly, in the case of the absorbance versus [Ferron]/AlT curve being employed to ascertain the lower limit of [Ferron] (Fig. 2b), AlT should be considered simultaneously. For those samples with unknown Al concentrations that are difficult to measure, the ferron assay will lose general meaning.21,24 Furthermore, when the AlT is less than 4.0 × 10⁻⁵ M, the color reaction of AlIII–ferron is conducted under insufficient [Ferron], and follow-up studies should be conducted on the incorrect experimental results. Thus, the [Ferron]/AlT ratio is not used as a criterion for [Ferron] selection, but only as a reference condition.
Effect of [Ferron] on the colorimetric reaction between the mononuclear Al solutions and ferron (pH = 5.2 ± 0.2, T = 25 °C) (average of three experiments). (
Figures 2c and 2d show the effect of [Ferron] on the sensitivity of the AlIII–ferron reaction. With the increase of [Ferron], the slope of absorbance–AlT curves also increased. Therefore, [Ferron] has an obvious influence on the sensitivity of the AlIII–ferron reaction, i.e., when [Ferron] < 2 × 10⁻³ M, five absorbance–AlT curves approaching the x-axis in Fig. 2c could be clearly identified. The insufficient [Ferron] decreased the sensitivity of the Al determination, and the determined absorbance was low. When [Ferron] ≥ 2 × 10⁻³ M, most of the absorbance–AlT curves overlapped. It is because the sufficient [Ferron] made the AlIII completely complex, the colorimetric sensitivity reached the utmost, and the absorbance became stable. Accordingly, the e value of AlIII–ferron system is not a constant before [Ferron] reaches 2 × 10⁻³ M. The change of e with increasing [Ferron] had the following relationship:

C1, C2, and C3 were 9690, 5105, and 0.00054, respectively. Under sufficient amounts of [Ferron], the e value of AlIII–ferron system is 9737 ± 420 M−1·cm−1.
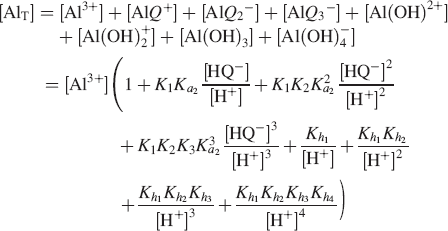
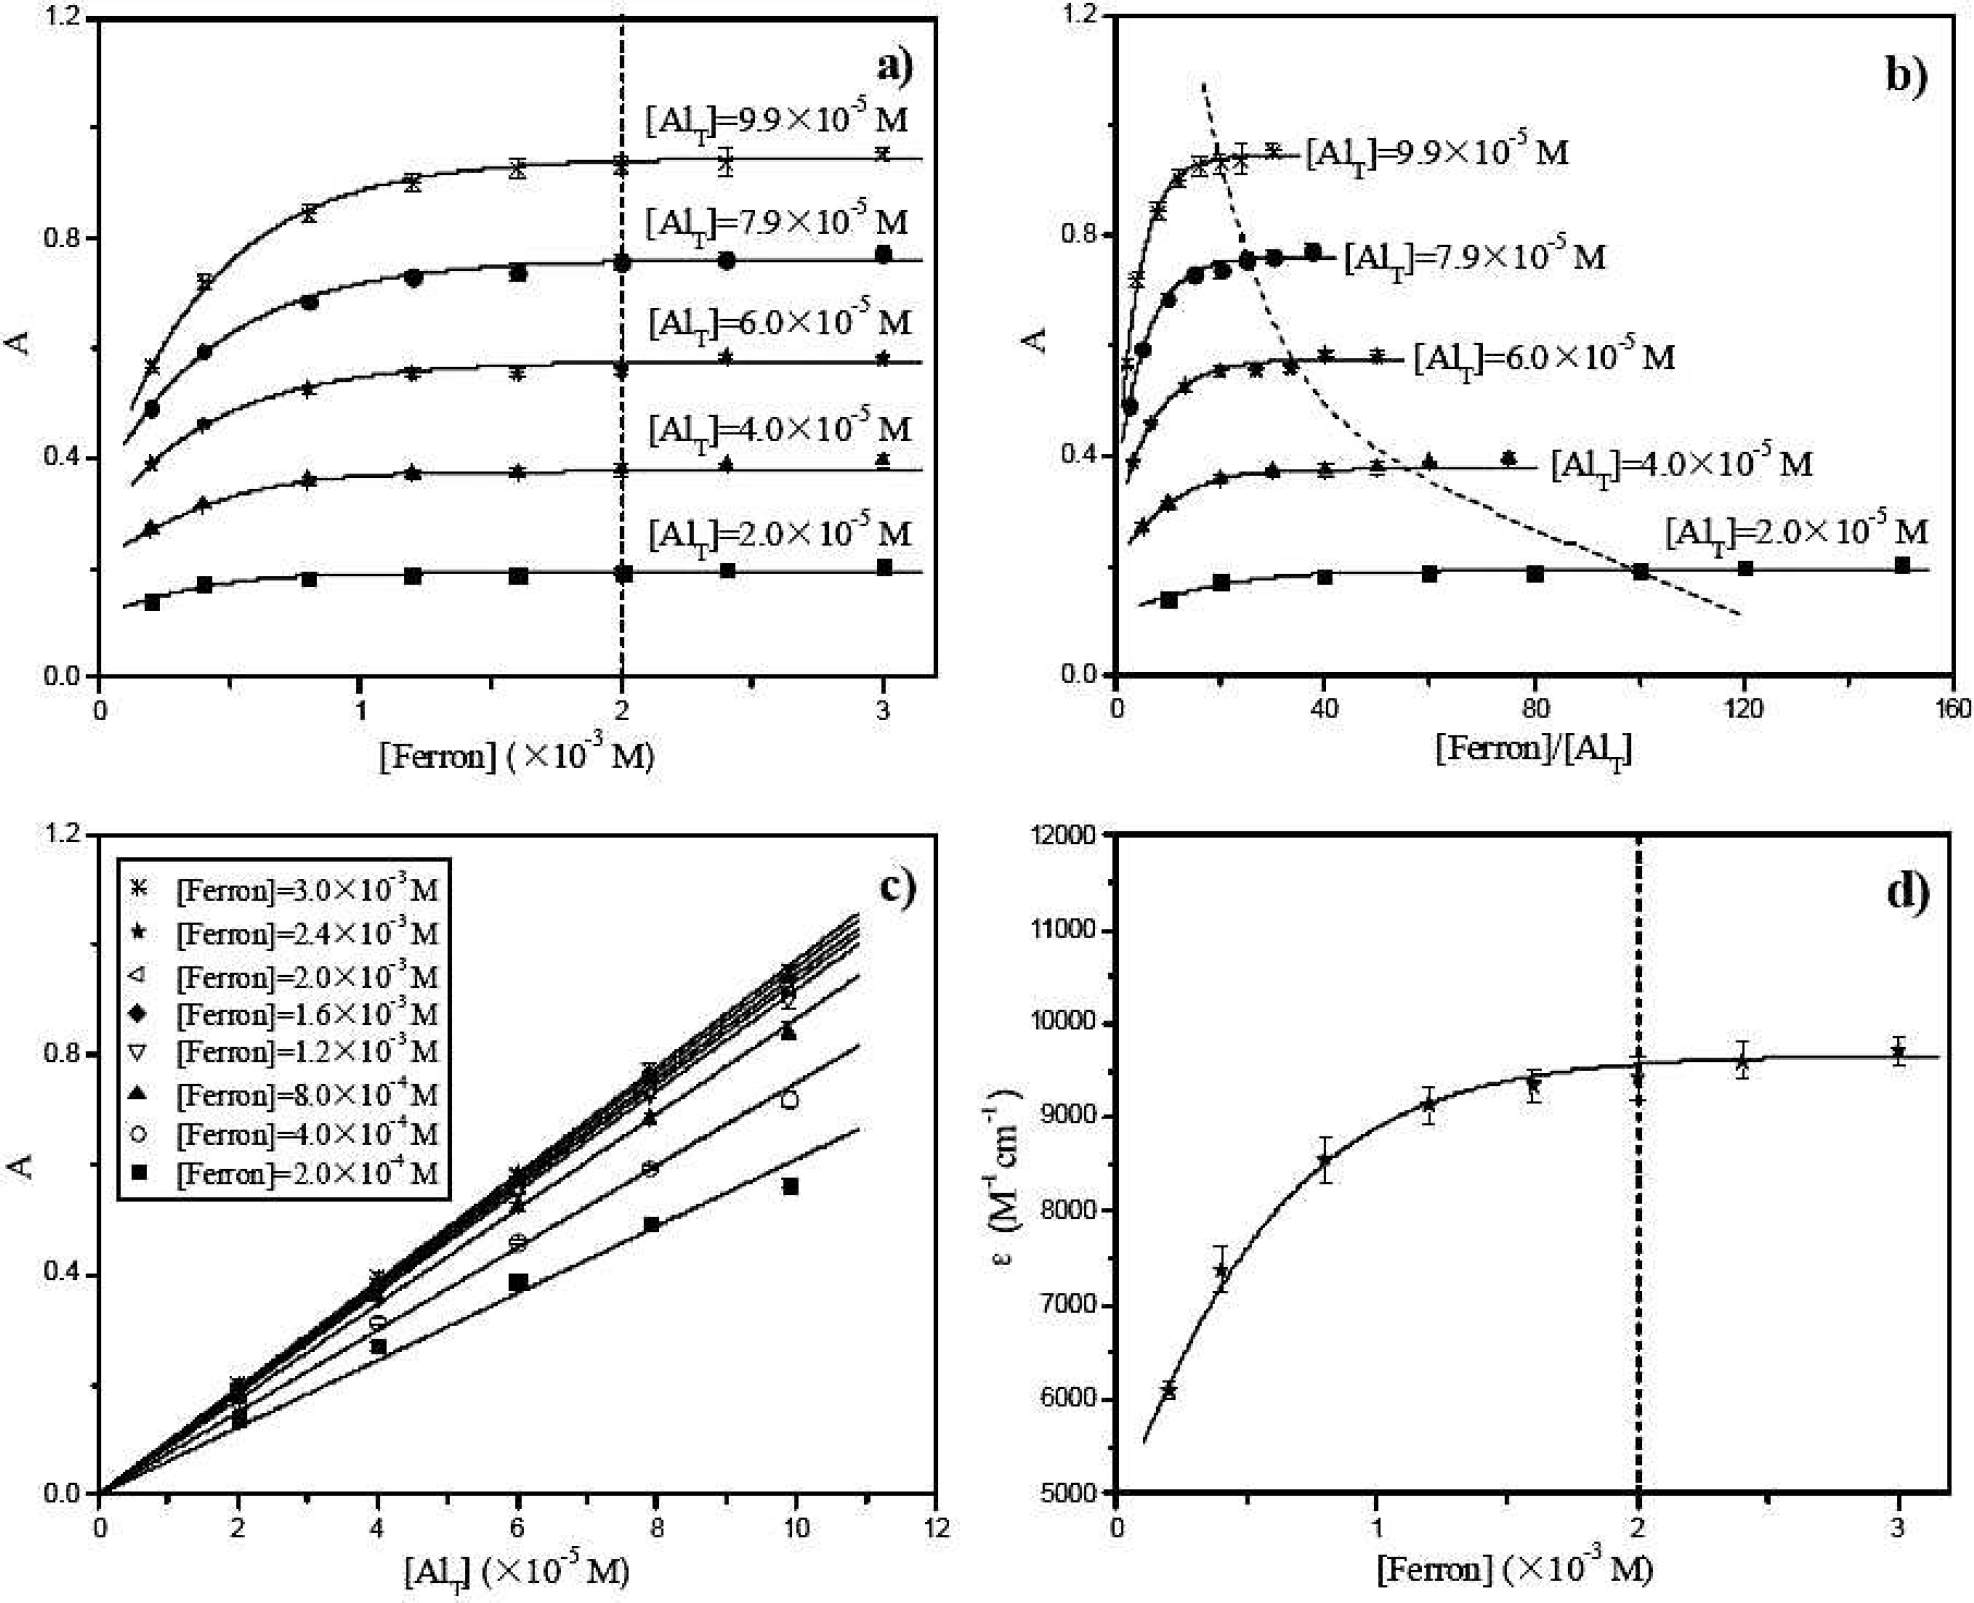
Because the question concerning the dosage of the chromogenic reagent of the ferron assay has never been unified and standardized, 7000 to ≥ 10 000 M−1·cm−1 for the e value can be found in the works referenced in Table I. The change trend of e with increasing [Ferron] summarized in the literature was in line with that proposed in our study (Fig. 3). The reason for the formation of this trend is that in the AlIII–ferron reaction system, with the increases in [Ferron], AlIII and ferron can form a series of complexes with different coordination numbers:
The ε values of Al–ferron colorimetric system reported in literature.
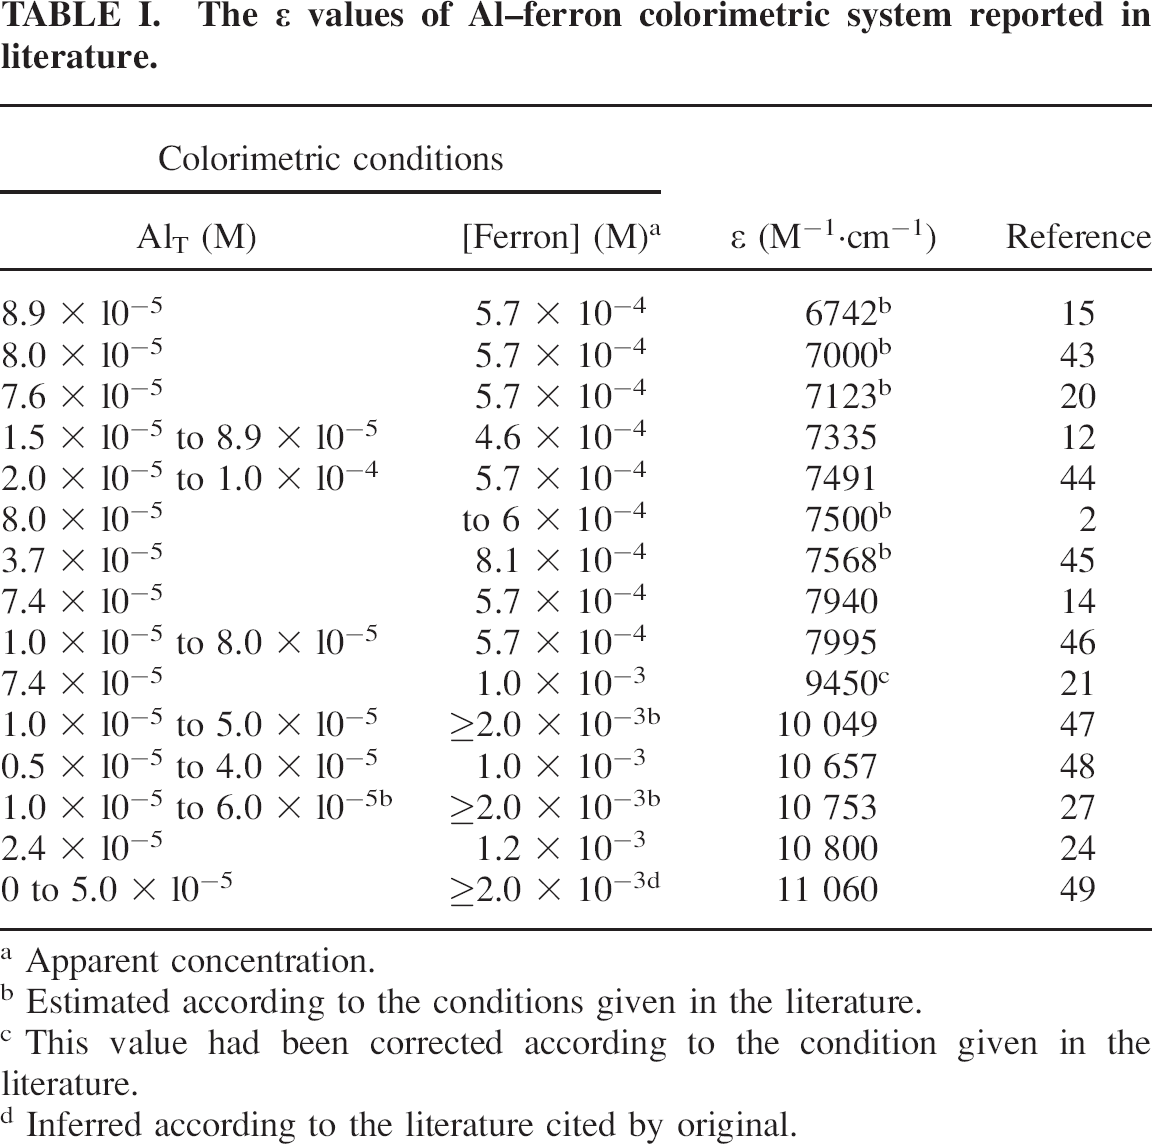
Apparent concentration.
Estimated according to the conditions given in the literature.
This value had been corrected according to the condition given in the literature.
Inferred according to the literature cited by original.
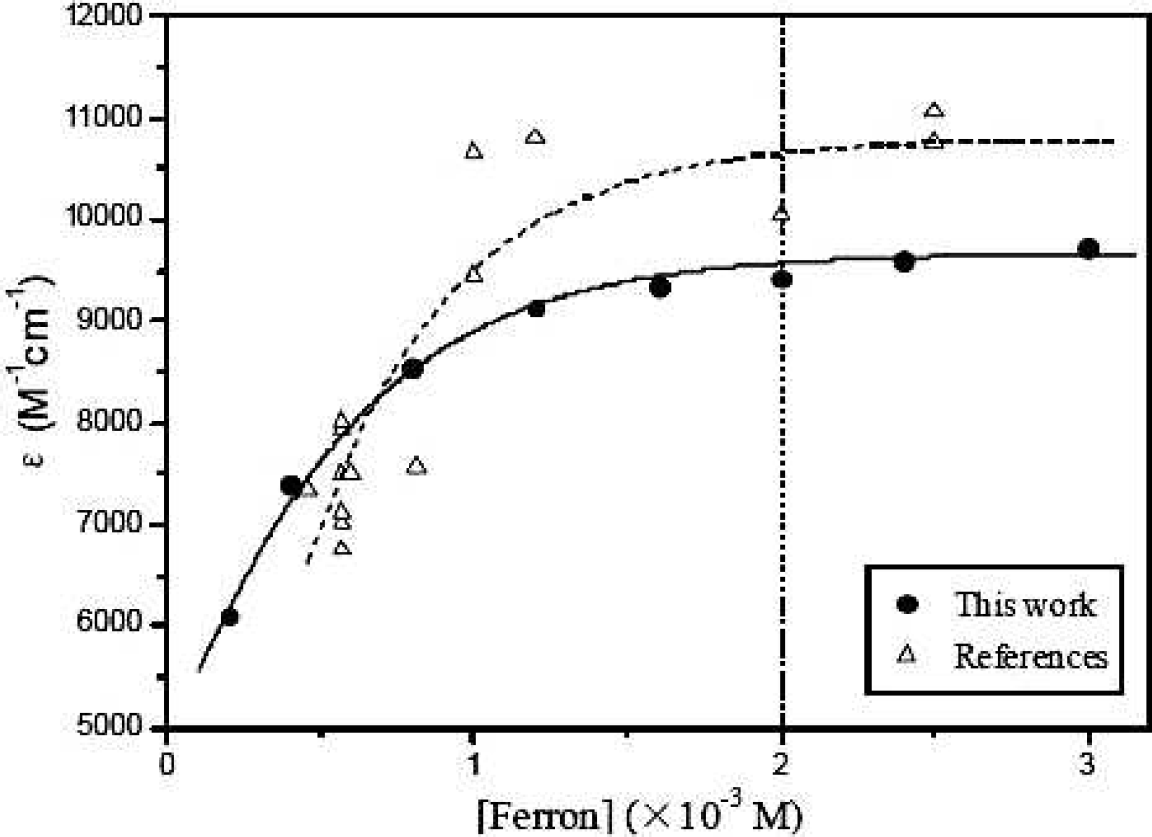
Comparison of the change trend of ε values with increasing [Ferron] proposed in this work and literature (this work: λmax = 370 nm, pH = 5.2 ± 0.2, T = 25 °C).

whereas the absorbance at 370 nm only comes from AlQ33−.15,21,35 Hence, when the [Ferron] concentration increases, the distribution ratio of the four species Al3+, AlQ+, AlQ2−, and AlQ33−) continuously changes. The concentrations of Al3+, AlQ+, and AlQ2− falls, and the concentration of AlQ33− rises. The direct result is the increasing of the absorbance. After all the AlIII in the colorimetric solution is transformed to AlQ33−, further increase in [Ferron] effects no increase in the absorbance. Thus, the trend of ε first increases, and then gradually ends on a plateau with the rising [Ferron]. Only at the plateau does the determined absorbance match well with the AlT.
27Al NMR was used to verify the AlT as measured by this optimized ferron assay. For the same mononuclear Al solution (AlIII concentration was 0.401 M, determined by the ICP-AES spectrometer.), the ferron and 27Al NMR assays were simultaneously employed to determine their mononuclear Al content, AlT and Alm, respectively. As shown in Fig. 4, AlT and Alm were almost the same. Thus, AlT could be accurately determined when the experimental conditions were [Ferron] ≥ 2 × 10⁻³ M and AlT = 2.0 × 10⁻⁵ to 8.0 × 10⁻⁵ M.
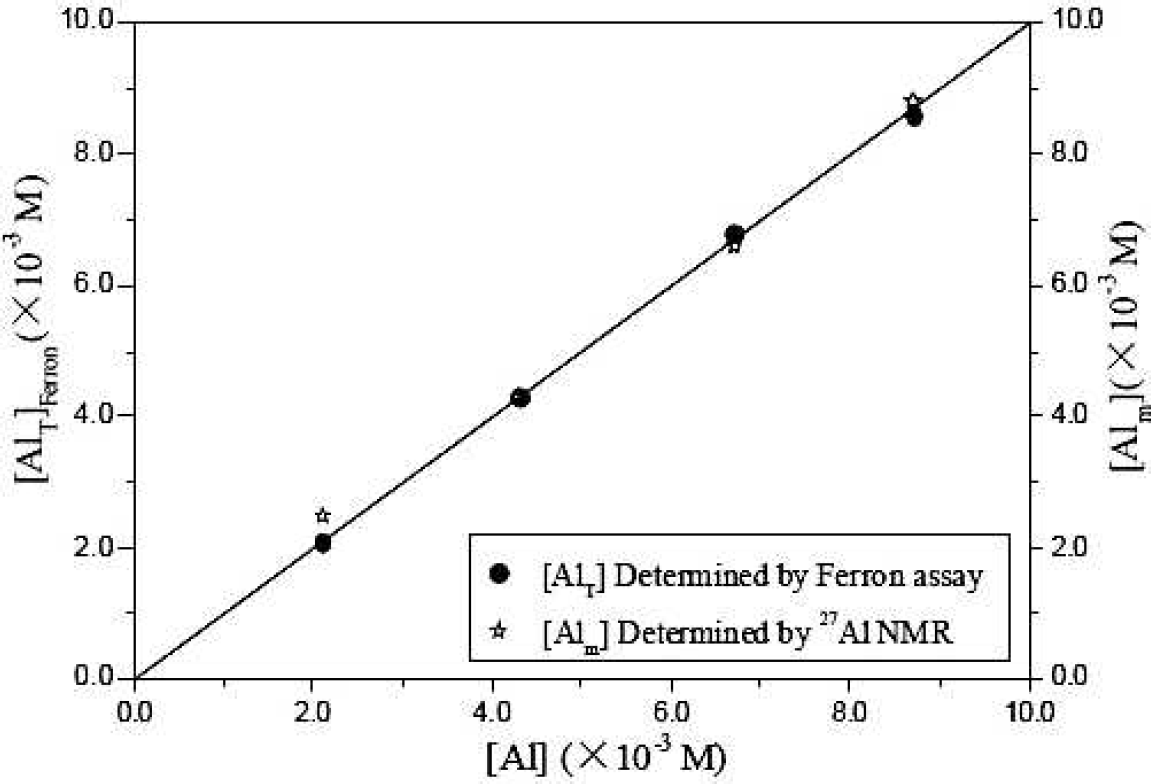
Comparison between AlT determined by ferron assay and Alm determined by 27Al NMR (the red line indicates equality). The Al solutions used in the ferron assay were all diluted from that used in 27Al NMR. [Ferron] = 2 × 10⁻³ M, λmax = 370 nm, pH = 5.2 ± 0.2, T = 25 °C.)
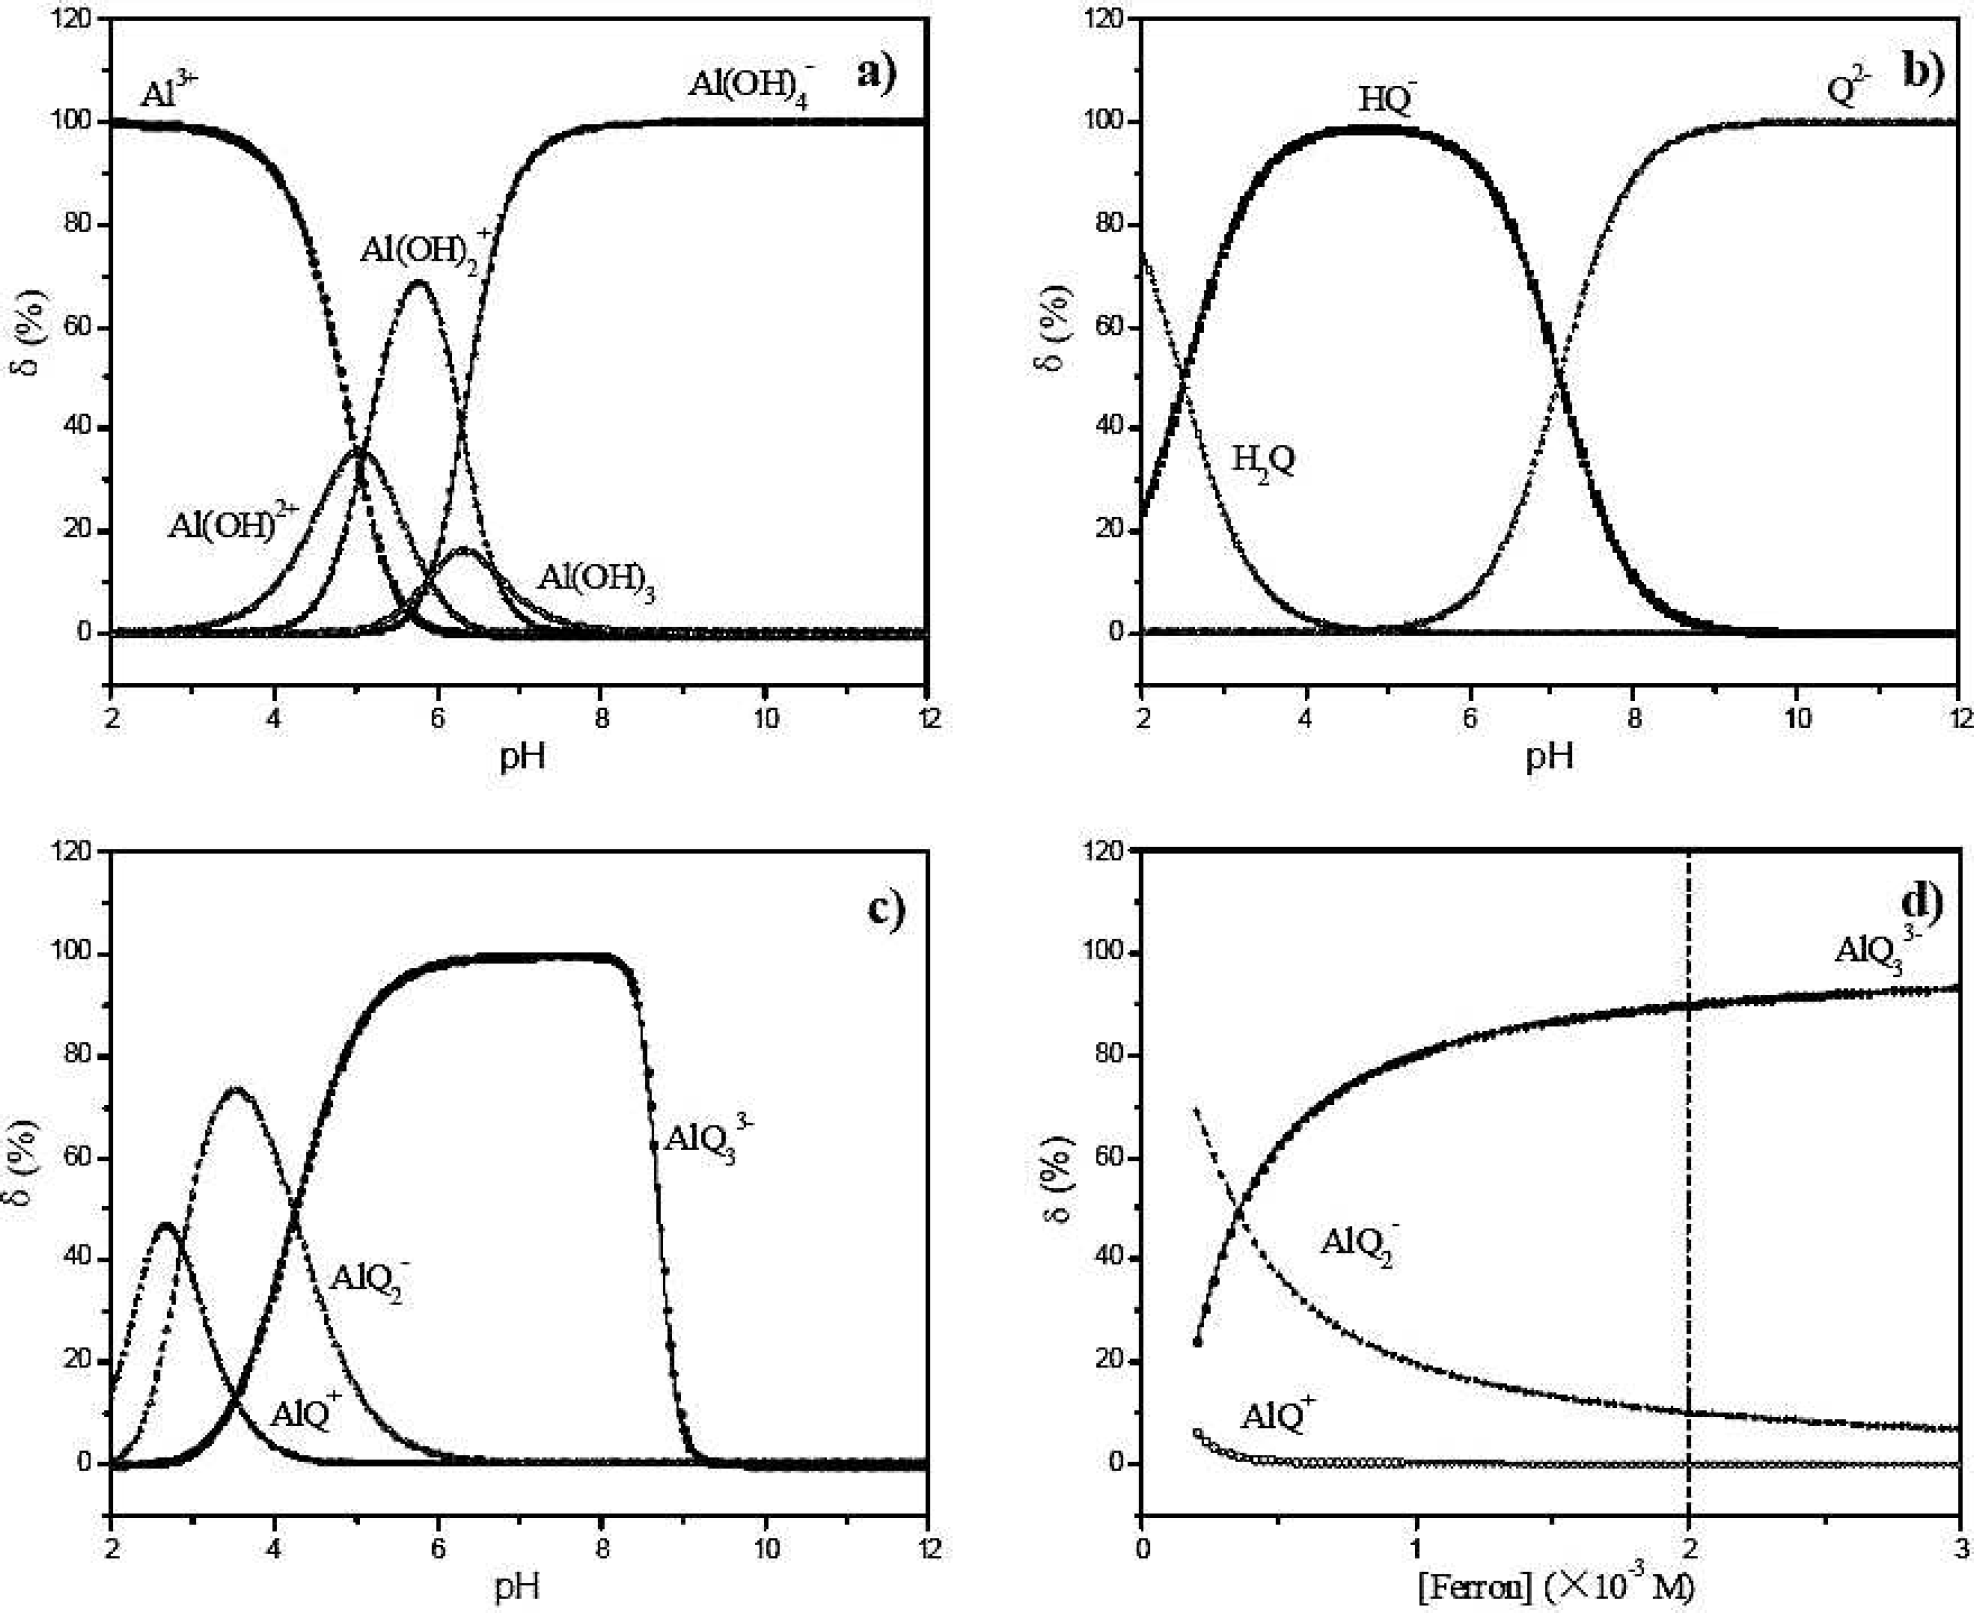
The distribution of mononuclear Al species, ferron, and Al–ferron complexes under different pH conditions (
Comparison of ferron solubility under different dissolution means.
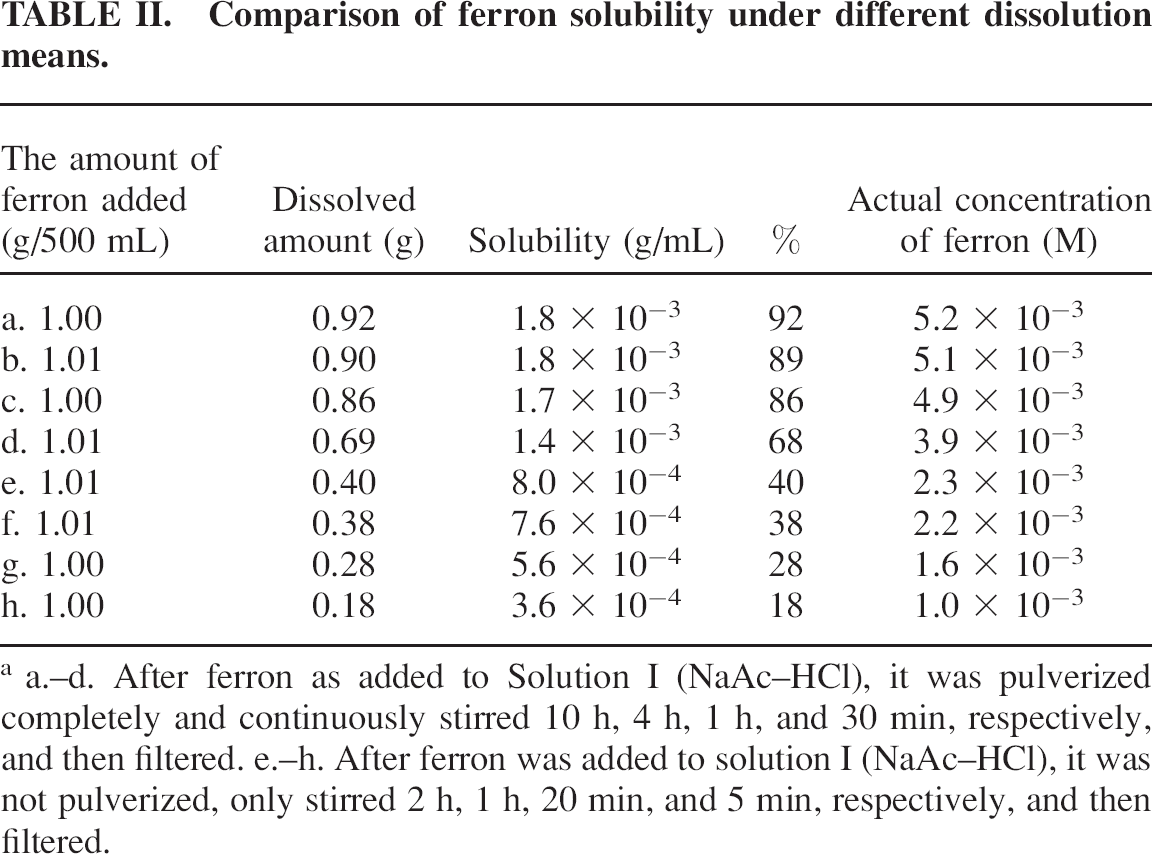
a.–d. After ferron as added to Solution I (NaAc–HCl), it was pulverized completely and continuously stirred 10 h, 4 h, 1 h, and 30 min, respectively, and then filtered. e.–h. After ferron was added to solution I (NaAc–HCl), it was not pulverized, only stirred 2 h, 1 h, 20 min, and 5 min, respectively, and then filtered.
As shown in Table II, because the operation of preparation could not be unified, the dissolved quantity of ferron decreased by 3–74%. In other words, if the above situation was neglected when the ferron colorimetric solution was prepared, the actual concentration of ferron could be far less than the apparent concentration of ferron obtained by theoretical calculations. Thus, the following operation was suggested to prepare ferron colorimetric solution: After ferron is dissolved in NaAc–HCl buffer solution, the bigger particles clumped together should be pulverized with a glass rod completely. Then, the NaAc–HCl buffer solution dissolving the ferron should be continuously stirred for 10 h.
CONCLUSION
The uniformity and standardization of the ferron assay provides a correct experimental method for the further determination of hydroxyl–Al species. The reconfirmed colorimetric conditions of the AlIII–ferron system are pH = 5.2 ± 0.2 and λmax = 370 nm. [Ferron] is the key for AlT determination. The main conclusions of this study can be drawn as follows:
The ε of AlIII–ferron system is not a constant before [Ferron] reaches 2 × 10⁻³ M. The change of
The influence of [Ferron] on the sensitivity of AlIII–ferron reaction analyzed by the chemical equilibrium calculation is in line with that obtained from our experiment. The optimal [Ferron] should be at least 2 × 10⁻³ M, and the experimental result is then reasonable.
The main reason for the insufficient [Ferron] in the AlIII–ferron system is the uncertainty of the ferron concentration in the prepared ferron colorimetric solution.
Footnotes
ACKNOWLEDGMENTS
We thank State Key Laboratory of Analytical Chemistry for Life Science of Nanjing University for help with all experiments and NMR determination. The present study was financially supported by Natural Science Foundation of Ningbo City (No. 2010A610020).